$BTC – Breaking Out of the Pattern?📈 Bitcoin ( CRYPTOCAP:BTC ) is testing the upper resistance zone of a multi-month structure.
✅ Break of Structure (BOS) has already occurred, adding fuel to the bullish case.
🚀 Just a bit more upside and CRYPTOCAP:BTC could escape this consolidation pattern completely.
Key levels to watch:
Break above ~$110K area
Green trendline remains strong support
Eyes on higher timeframe close to confirm breakout
This could be a pivot point for Bitcoin’s next leg higher — or a trap if sellers step in hard.
1-BTCUSD

BTC Crypto Futures Trade Plan 2025-05-26BTC Crypto Analysis Summary (2025-05-26)
Comprehensive Summary of Each Model
Grok/xAI Report
BTC at $109,553, trading above all major MAs (20/50/200 SMAs, 9/21 EMAs) → strong bullish trend RSI 67.02 (approaching overbought), MACD positive but slight bearish divergence Volume declining → possible consolidation or reduced buying interest Funding rate low (0.0002%) → not overleveraged long Trade suggested: long at $110,000, SL $107,000, TP1 $113,000, TP2 $115,000, size 1% equity, confidence 80%
Claude/Anthropic Report
Confirms price above all key MAs, RSI approaching overbought, MACD divergence Price near upper Bollinger Band → resistance Concludes short-term momentum weakening → moderately bearish bias Recommends no trade (confidence 72%), waits for break above $111,800 or below $105,000
Llama/Meta Report
Bullish MA alignment, RSI slightly overbought, price near upper BB Funding rate neutral, sentiment generally positive Trade suggested: long on pullback to SMA20 at $105,295.59, SL $103,000, TP $110,000, size = 2–3% equity, confidence 80%
Gemini/Google Report
Strong bullish trend (EMA9 > EMA21 > SMA20 > SMA50 > SMA200), RSI 67, BB upper ~$111,724 MACD bearish crossover → potential short-term pullback Recommends long at ~$109,550, SL $107,700, TP $113,100, size 1 BTC, confidence 75%
DeepSeek Report
Price near upper Bollinger Band, MACD bearish crossover, RSI divergence Countertrend short trade: entry $109,553, SL $111,725, TP $105,295, size 1 BTC, confidence 75% Areas of Agreement and Disagreement
Agreement
BTC is in a strong uptrend, trading above all major moving averages RSI ~67 suggests rising momentum but nearing overbought MACD shows a bearish divergence or crossover, warning of short-term momentum loss Price is close to the upper Bollinger Band → stretched conditions
Disagreement
Directional bias: Grok, Llama, and Gemini bullish; Claude is cautious/no-trade; DeepSeek bearish countertrend Entry levels: ranges from pullbacks to 105k (Llama) to market price ~109.55k (Gemini/Grok) Risk appetite: varying leverage and position-sizing recommendations Trade/no-trade: Claude advises holding; others recommend active positions Conclusion and Trade Recommendation
Overall Market Direction Consensus
Moderately Bullish: the dominant trend is up, supported by MA structure and recent performance, despite short-term momentum warnings.
Recommended Trade
Direction: Long BTC futures Entry Range: Near current market (109,500–109,600) or immediate retest of EMA9 (~109,550) Stop Loss: 107,700 (below EMA9 and minor support) Take Profit: 113,100 (just above recent swing highs/upper BB) Position Size: 1 BTC (adjust per account to risk ~1–2%) Confidence Level: 78%
Key Risks and Considerations
Momentum Divergence: MACD bearish crossover and RSI near overbought may trigger a pullback Volatility Spikes: leverage can amplify slippage and liquidation risk Broader Crypto Moves: altcoin correlation or market-wide news can quickly shift prices Funding Rate Shifts: a sudden spike could accelerate long-side liquidations
TRADE_DETAILS (JSON Format) { "instrument": "BTC", "direction": "long", "entry_price": 109550.0, "stop_loss": 107700.0, "take_profit": 113100.0, "size": 1, "confidence": 0.78, "entry_timing": "market_open" }
📊 TRADE DETAILS 📊 🎯 Instrument: BTC 📈 Direction: LONG 💰 Entry Price: 109550.0 🛑 Stop Loss: 107700.0 🎯 Take Profit: 113100.0 📊 Size: 1 💪 Confidence: 78% ⏰ Entry Timing: market_open
Disclaimer: This newsletter is not trading or investment advice but for general informational purposes only. This newsletter represents my personal opinions based on proprietary research which I am sharing publicly as my personal blog. Futures, stocks, and options trading of any kind involves a lot of risk. No guarantee of any profit whatsoever is made. In fact, you may lose everything you have. So be very careful. I guarantee no profit whatsoever, You assume the entire cost and risk of any trading or investing activities you choose to undertake. You are solely responsible for making your own investment decisions. Owners/authors of this newsletter, its representatives, its principals, its moderators, and its members, are NOT registered as securities broker-dealers or investment advisors either with the U.S. Securities and Exchange Commission, CFTC, or with any other securities/regulatory authority. Consult with a registered investment advisor, broker-dealer, and/or financial advisor. By reading and using this newsletter or any of my publications, you are agreeing to these terms. Any screenshots used here are courtesy of TradingView. I am just an end user with no affiliations with them. Information and quotes shared in this blog can be 100% wrong. Markets are risky and can go to 0 at any time. Furthermore, you will not share or copy any content in this blog as it is the authors' IP. By reading this blog, you accept these terms of conditions and acknowledge I am sharing this blog as my personal trading journal, nothing more.


Bitcoin New ATH - Where now?After Bitcoin makes new all time highs, the next steps are very important. Where price goes now can be tricky to predict as there is the rare factor of price.
One of the only ways to predict where BTC may find resistance during price discovery is to use Fibonacci levels, using Fib extensions the first target for me would be between $117,500-$120,000. This area would be between the fib extension and the big even level, RSI would also be overbought on the daily time frame.
For the bearish scenario I think it's a much simpler play from a TA standpoint, lose the trend channel and get back under the old ATH level and I think we see a pullback towards $97,000. After such an extreme rally over the last 2 months with little to no rest a 10% correction would not be out of the ordinary despite such bullish ETF inflows. I have mapped a second target area should $97,000 fail, a SFP of the range can lead to a retest of the midpoint, this correction path would be much more severe with a more than 15% move lower.
To sum it all up Bitcoin has been on a great run in the last 2 months and has reached most traders common target of making a new ATH. Now there must be a new objective... Continue the move into price discovery or a corrective move? Price discovery has no previous selling history and so Fib levels along with big even levels are used to predict resistance levels. Corrective move would mean dropping out of the bullish trend channel and falling into a place of support, in my mind that would be ~$97,000 or failing that ~$91,000 (range midpoint).

bitcoin on bearish#BTCUSD price have shown reverse trend which will drop below 106k.
Firstly we await for drop below 109300 for sell, Target 106k, SL 110151
But if prices move above 110151 Firstly then it will reach 110747 which will decline to head bearish.
Bullish is not valid yet.
#BTC

26/05/25 Weekly OutlookLast weeks high: $111,965.73
Last weeks low: $101,994.78
Midpoint: $106,980.26
New BTC ATHs! Well done to those who capitalized on the move and continue to believe in this Bitcoin.
For the last two weekly outlooks I have talked about the pattern of consolidation for 1 week --> expansion the next. Last week We got our expansion week right on queue and this time around BTC made a new ATH hitting just shy of $112,000.
Should the pattern continue this week will be a week of consolidation/chop, however this week is different now that we're at ATH levels. My gut says a pullback is coming after such an aggressive move up with almost no pullbacks at all.
Should BTCs price drop below the Midpoint I think there will be a big struggle to continue this rally in the short term. Initially target would be weekly low and main HTF target would be $97,000 IMO. That would be a healthy pullback to continue the rally.
For the bulls you don't want momentum to stop in the short term, flipping $110,450 and weekly high would put BTC back into price discovery, once any asset is in price discovery it's very difficult to tell where the sell pressure will come from and so shorting becomes very risky.

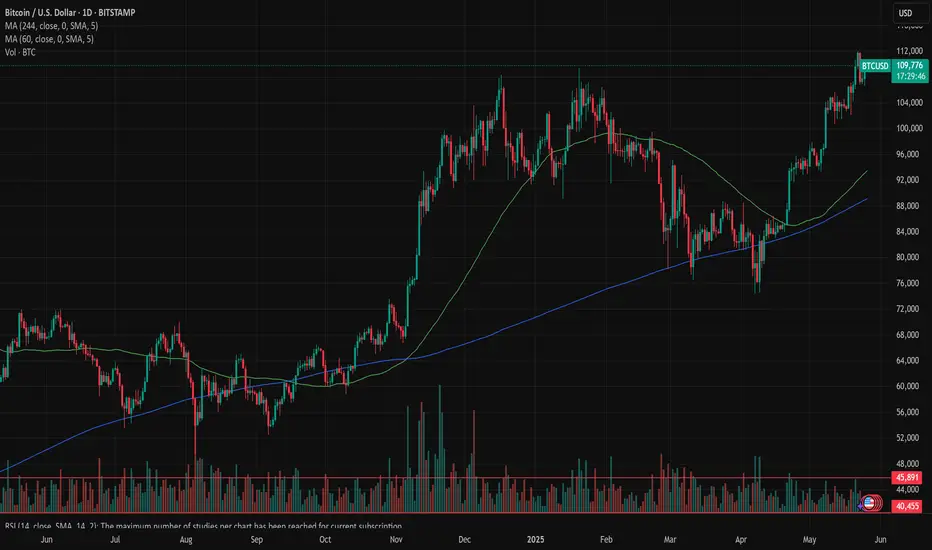
Daily BTC OverviewThe daily chart in its simplest form can be broken down into this range. Since President Trumps inauguration, BTC has declined from a range high of $108,000 back to the lows of $74,500 closing the FVG caused by the US election rally. After a double bottom Bitcoin mean reverted back to the range midpoint which to me is the most important area on the entire chart because it decides if the bull run can continue or if it dies.
I like to keep a close eye on the 200 EMA on multiple timeframes but the 1D is important to gauge the momentum of the move. As the US election results came in a massive push away from this moving average causes the level to steepen in its climb showing strength. Since BTC spent quite some time in the top half of the range the 1D 200 EMA flattens out signaling a loss of momentum, once this level does become flat it no longer provides support. For a bullish cycle to be just that ideally the corrective moves do not spend too much time below this level before expanding above and beyond it once again starting the next leg of the move. A persistent move down below causes a rollover and the cycle looks to be over with a bear market beginning.
Bullish scenario - The correction is over and BTC consistently posts HH's & HLs bringing the 1D 200 EMA up with price and continues the previous bullish trend. I would want to see the retest of the midpoint be successful and then move to reclaim the next local high before targeting range high. The bull market correction looks to be over and bullish continuation resumes.
Bearish scenario - This move is nothing more than a LH, BTC wicks the supply above midpoint, swing fails back under and continues to make LH's & LL's back down to range low where the 1D 200EMA will have now rolled over providing more of a resistance level. The bear market looks to have begun.
I am not here to make a call on where BTC is going next as I do not have that answer, but I do have to plan for each eventuality and that is what I have done here from a TA pint of view. Now it is entirely possible that Geo-political news or an exchange hack etc throws TA out of the window and I have to rethink the plan but in a strictly chart structure perspective this is how I see it.
The indicator "TRADING ENVIRONMENT+V1.0" used in the Idea post is now publicly available for use, give it a try and leave your thoughts and suggestions on the post, thank you.

May 23 Bitcoin Bybit chart analysisHello
It's a Bitcoinguide.
If you have a "follower"
You can receive comment notifications on real-time travel routes and major sections.
If my analysis is helpful,
Please would like one booster button at the bottom.
Here is the Bitcoin 30-minute chart.
There will be a Nasdaq indicator announcement at 11 o'clock in a little while.
Yesterday was also a sideways market with no movement,
and the participation rate was low, so I will leave it as a brief analysis.
In the case of Nasdaq, today's daily chart MACD dead cross pressure
so I judged that a vertical rise would be difficult.
I made today's strategy based on the high possibility of a sideways move.
In the upper left corner, from the analysis article on the 22nd,
I moved the 1st section / 111,426.6 dollars as it is with a purple finger.
*Red finger movement path
One-way long position strategy
1. 109,917.6 dollars long position entry section / green support line breakout stop loss price
Since the 4-hour chart MACD dead cross pressure is in progress
Based on the 1+4 pattern,
At least 2 additional 4-hour candles are created
I think there will be a long position wait after 1:30 p.m.
2. Top section 113,701.9 dollars long position 1st target -> Good 2nd target
If it breaks through the orange resistance line at the top
It can be connected to a vertical rise,
So if you were short yesterday or are going to challenge today,
Use it as a stop loss price, but be careful.
If it goes up within the purple support line after 1->2 or after touching 2 times,
It can be a vertical rise or a strong rise.
At the bottom, Bottom -> 3 times -> 106982.3 dollars
I marked the support line.
In case of a strong rise over the weekend,
Good is the Great section hidden picture search.
Up to this point, I ask that you simply use my analysis for reference and use,
and I hope that you operate safely with principle trading and stop loss prices.
Thank you for your hard work this week.
Thank you.

Bitcoin to 140k - 170k (26MAY2025)On monthly timeframe we have few trendlines which show us, 140 to $170,000 is likely according to the 100% of Fibonacci Extension as well, but above that is unlikely IMO.

BITCOIN $119k coming shortlyBitcoin (BTCUSD) has been trading within a 6-week Channel Up and Friday's tariff threats led pull-back was its latest Bearish Leg. That pull-back hit the 4H MA50 (blue trend-line) yesterday and rebounded. As long as the 4H MA100 (green trend-line) which is directly below the Channel Up holds, the current rebound is technically the pattern's new Bullish Leg.
All 4 previous Bullish Legs have ended on fairly similar % rises but the weakest has been +11.41%. With the 4H MACD just now completing a Bullish Cross (which has always been a strong buy signal), a repeat of the +11.41% minimum, gives us an immediate $119000 Target.
Do you think that's coming shortly before the beginning of June? Feel free to let us know in the comments section below!
-------------------------------------------------------------------------------
** Please LIKE 👍, FOLLOW ✅, SHARE 🙌 and COMMENT ✍ if you enjoy this idea! Also share your ideas and charts in the comments section below! This is best way to keep it relevant, support us, keep the content here free and allow the idea to reach as many people as possible. **
-------------------------------------------------------------------------------
💸💸💸💸💸💸
👇 👇 👇 👇 👇 👇

Hellena | BITCOIN (4H): LONG to resistance area of 115,000.I see that price has shown a violent rise in a five-wave move and I have redrawn the waves a bit to make it clear where to expect a correction. I think we are currently seeing a correction in wave “4” (104,000).
But most importantly, I expect an update of the high. Therefore, I believe that the level of 115,000 will be reached and it may be a wave “5”, after which we can expect a deeper correction.
Manage your capital correctly and competently! Only enter trades based on reliable patterns!

Bitcoin (BTC/USD) Bullish Breakout – Targeting $116K Using MMCBitcoin has printed one of the most powerful continuation setups in technical analysis — a Bullish Pennant — and it's playing out beautifully, backed by Mirror Market Concepts (MMC). Let's break down the structure, the reasoning behind this move, and how smart money could be driving this price action.
📈 1. Market Context – The Impulsive Rally That Set the Stage
The first thing to notice is the strong bullish move that occurred before the pennant started forming. This rally is important because a Bullish Pennant is a continuation pattern, and without a strong preceding trend, the pattern loses its credibility.
This initial move acts as the “pole” of the pennant — a clean, impulsive leg upward, driven by demand and momentum.
Such moves are often the result of strong buying from institutions, retail FOMO, or positive macroeconomic catalysts.
🧠 Psychology Insight: The rally injects confidence into the market. Buyers who missed the move now wait for a pullback, while early buyers prepare to scale in on continuation.
🔺 2. Bullish Pennant Structure – The Calm Before the Next Storm
After the bullish pole, the price enters a tight consolidation phase, forming a symmetrical triangle:
Lower highs and higher lows compress price into a pennant shape.
Volume usually declines during this phase, showing that the market is resting, not reversing.
The market is essentially "charging up" for the next big move.
💡 Why This Matters: The Pennant shows temporary equilibrium between buyers and sellers. A breakout typically signals which side wins — and in this case, buyers have taken control.
🪞 3. Mirror Market Concepts (MMC) – The Secret Weapon
This chart also showcases the power of MMC (Mirror Market Concepts), a strategy based on the idea that the market tends to reflect its previous behavior, structure, and reactions.
Here’s how MMC applies:
The price broke out of the pennant, then came back to retest the breakout area, just like it did during the previous breakout from the consolidation zone.
The Mini SR – Interchange zone acted as resistance before, and now it’s acting as support — a classic Support/Resistance flip (SR flip).
The retest behavior mirrors the earlier breakout structure, offering a confirmation that the market is following a familiar rhythm.
📊 Trading Logic: When a market behaves similarly at two different points in time, it’s often a signal of institutional activity — "smart money" repeating proven entry points and exits.
🔁 4. Retesting – The Entry Opportunity for Smart Traders
After the breakout from the pennant, price didn’t just shoot up — it pulled back to retest the broken structure. This is a high-conviction setup in technical trading:
✅ Retest confirms the breakout was valid (not a fakeout).
✅ It provides a safe entry point for traders who missed the initial impulse.
✅ Volume and bullish candle structure post-retest indicate buyer interest.
📌 The Mini SR – Interchange zone, around $106,631.69, acted as the perfect launchpad for the next bullish leg.
🎯 5. Trade Setup – High R:R Swing Opportunity
Let’s look at the exact setup this chart offers:
Entry: After the breakout and retest near $107K–$108K
Stop Loss (SL): Below the support zone at $106,631.69
Target (TP): At $116,105.65 — derived by projecting the height of the pole from the breakout zone
This gives an excellent reward-to-risk ratio, a key principle in sustainable trading.
🧠 6. Psychological Fuel – Why This Move Has Legs
Traders who missed the earlier rally are now watching closely for entries.
Retail traders are seeing confirmation.
Institutions may already be in from lower levels and are now defending support zones.
Sentiment is bullish post-retest, increasing volume and momentum.
It’s a self-fulfilling prophecy: as more traders recognize the pattern and the confluence, the trade becomes even more likely to play out.
🗓️ 7. What to Watch Next – Smart Risk Management
Even though the pattern looks strong, smart traders always remain cautious:
✅ Move SL to breakeven once price moves halfway toward the target.
🔄 Consider taking partial profits near interim resistance zones (like $112K).
📆 Stay alert for economic events or Bitcoin news that could cause sudden volatility.
📘 Conclusion: Bullish Setup with Proven Structure and MMC Confirmation
This BTC/USD chart is a textbook example of a Bullish Pennant breakout, with added strength from Mirror Market Concepts and a clean SR Flip retest. For swing traders and price action lovers, this setup offers a structured, strategic, and smart opportunity to ride the next wave of Bitcoin momentum.

BTC/USD SELL SIGNALEntry Zone: 110400 to 110850
Stop Loss: 111100
Take Profit Targets:
* TP1: 109895 ✅
* TP2: 109403 ✅
* TP3: Open/Trailing 📉
Enter with the proper confirmation

Bitcoin - Will Bitcoin Continue to Rise?!Bitcoin is above the EMA50 and EMA200 on the four-hour timeframe and is in its medium-term ascending channel. A break of the drawn trend line will lead to a decline in Bitcoin. If Bitcoin moves downwards towards the specified demand zone, we can look for its next buying opportunities. Maintaining the drawn trend line will lead to its reaching $120,000.
It should be noted that there is a possibility of heavy fluctuations and shadows due to the movement of whales in the market and compliance with capital management in the cryptocurrency market will be more important. If the downward trend continues, we can buy within the demand range.
Over the past 200 days, since Trump’s electoral victory, investment funds (ETFs) and major corporations have collectively purchased and withdrawn approximately 607,000 bitcoins from the market.
▪️ Around 200,000 bitcoins were acquired by ETFs.
▪️ MicroStrategy alone accumulated nearly 300,000 bitcoins.
▪️ The remaining 100,000 bitcoins were bought by other companies.
This substantial level of acquisition has removed a significant portion of bitcoin from circulation, creating what is known as a “supply shock”—a situation where the reduced availability of bitcoin could drive prices higher due to scarcity.
On February 6, 2025, Eric Trump declared that it was an opportune time to invest in bitcoin. Shortly after this statement, the price of bitcoin dropped by about 25%. However, the market soon shifted momentum, and bitcoin entered a strong upward trend. On May 22, Trump tweeted again, stating: “Hope you listened… This is just the beginning!”
Meanwhile, U.S. Vice President JD Vance is scheduled to speak at the Bitcoin 2025 Conference, set to take place on May 28 in Las Vegas.Earlier in March, President Trump signed an executive order establishing a “Strategic Bitcoin Reserve” and a “U.S. Digital Asset Reserve,” solidifying the government’s new, supportive stance toward cryptocurrencies.
The Vice President’s upcoming participation in this event underscores the seriousness of the administration’s digital asset policy and reinforces the likelihood that digital assets will gain a more formal and structured role within the U.S. financial and strategic reserve systems.
Jurrien Timmer, Chief Economist at Fidelity, believes that bitcoin surpassing the $100,000 mark signals its growing alignment with gold as a store-of-value asset. He suggests a 4-to-1 ratio of gold to bitcoin in a value-preservation investment portfolio.
Although bitcoin had a sluggish start in 2025, capital inflows into bitcoin ETFs have resumed—especially as macroeconomic conditions have begun to improve. While gold has posted gains of around 30% so far this year, bitcoin hasn’t matched that performance yet. Nonetheless, analysts continue to project significantly higher price targets for bitcoin within this same year.
Meanwhile, the crypto exchange Kraken announced that it will soon launch tokenized stock offerings for Apple, Tesla, and Nvidia. These tokenized stocks will be available for trading by users outside of the United States.
Importantly, these assets will be tradable 24/7—much like cryptocurrencies—which marks a major departure from the traditional trading hours of Wall Street. Kraken confirmed that the feature will roll out in the coming weeks, initially targeting regions such as Europe, Latin America, Africa, and Asia.

BITCOIN New Update (4H)This analysis is an update of the analysis you see in the "Related publications" section
In the previous analysis, we mentioned that you should avoid looking for sell/short positions, as Bitcoin's price pattern was designed to trap short positions. The price followed the direction of the previous yellow arrow as anticipated.
Currently, the major resistance zone for Bitcoin on the chart is the red area. In this zone, a complete bullish pattern could potentially form | or at the very least, one leg of a bullish pattern may be completed.
Let’s see how it plays out.
For risk management, please don't forget stop loss and capital management
Comment if you have any questions
Thank You

$FETUSDTHere's a clearer and more polished version of your statement:
My projection for FET is that it will rise to around $1.569 before facing any significant correction. After this correction, I expect the price to resume its upward rally.
Not a financial advice. Trade at your own risk!

Bitcoin: Pizza Day ATHLast week was the celebration of the so-called Pizza Day, which represents an anniversary for the crypto community, as on this day the first bitcoin purchase transaction. This year, the anniversary was additionally celebrated as BTC managed to reach a fresh, new all time highest level at $111.636. Indeed, BTC holders had a day to celebrate.
Although the week started modestly above the $102K level, BTC swiftly turned to the upside, reaching its new ATH. The coin reverted a bit as of the weekend, but still manages to hold above the $108K during weekend trading. For the last two weeks RSI is moving in a highly overbought market side, indicating that the reversal might come soon. However, during periods of high market demand, the movement in the overbought period might be extended for a longer period of time. The MA50 crossed the MA200 from the downside, indicating a formation called “golden cross” in technical analysis, meaning higher potential for the trend change.
BTC reached a new milestone. Considering strong demand during the last two weeks, the price of BTC might hold at higher levels for some time. On the opposite side, the profit-taking might modestly impact the short term reversal. As per current charts, there is some probability for the levels around the $105K. However, if demand continues to hold, the BTC might also try to break the current ATH. Both scenarios currently have equal chances for occurrence.
Next Step $155,600, Bitcoin Closes 7th Week Green +AltcoinsThe next target and major All-Time High has been confirmed as $155,601.73 for Bitcoin and this isn't likely to be the end of the bull market. This target is now confirmed after Bitcoin wicked lower on the weekly timeframe to test support but ended up closing green, the 7th consecutive week Bitcoin closes green.
This is a major, major bullish signal. It means one thing only, the demand for Bitcoin is just too strong. So strong, that nobody is willing to sell, at least not for longer than a few hours or a few days.
Sold at 100K? Good! Buy back in but higher.
Sold at 105K? Bad! Bitcoin continues rising.
Bought below $80,000? Congratulations, you are a genius and you are holding a great position, you have months and months of bullish action yet ahead of you.
Bought below $90,000? You are still good, you are wise, you are great. You have to congratulate yourself and know that all the gains you receive you deserve. You bought when the time was right, you bought regardless of what the others said.
Bought at $95,000 or lower? There was higher risk because resistance was strong right in front, 100K-110K, and yet, you took action, now you will be rewarded for being brave. The market will bless you with tons of profits and continued success.
Missed the Bitcoin bus? There is absolutely no need to worry, at all, because the Altcoins market is still trading near its bottom and is soon to grow; What one does, the rest follows.
The Altcoins market will follow Bitcoin. The Altcoins will move to strong highs, new heights and new All-Time Highs.
It is not too late... Crypto (Bitcoin & The Altcoins) is going up!
Namaste.

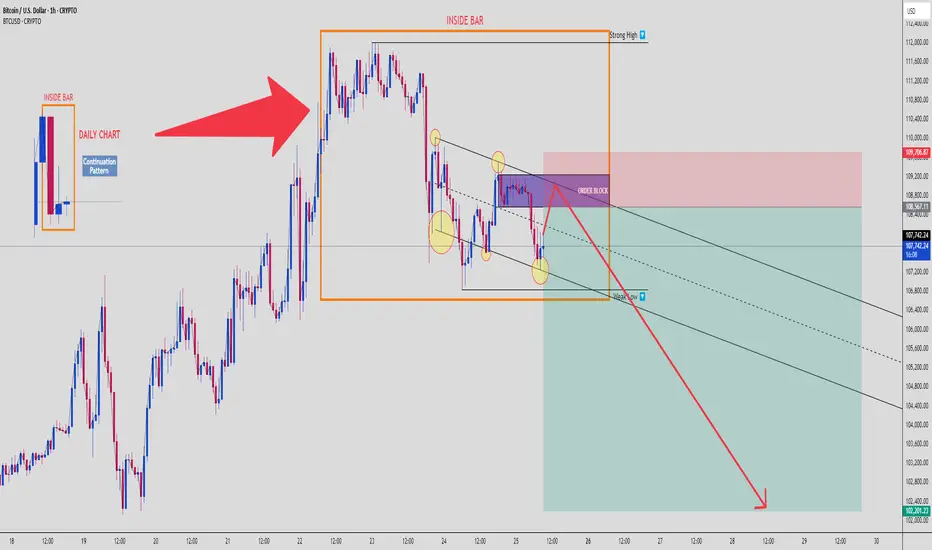
BTCUSD: Inside Bar Trap + Order Block Rejection Targeting $102K📉 Bitcoin | SMC Breakdown | 1H Chart
Welcome to a clean Smart Money setup, where retail gets baited and Smart Money gets paid. Let’s break down what’s happening on BTCUSD, 1H chart, using multi-timeframe confluence and Smart Money Concepts. 👇
🗓️ 1. Daily Chart Confluence
We start with a Daily Inside Bar Pattern – a classic continuation setup, often used by institutions to trap traders before expansion. BTC ranged tightly, then broke to the upside to grab liquidity, not start a rally.
🟥 Daily High = Liquidity Pool
🟧 Inside Bar Range = Manipulation Zone
This is the trap zone.
🧱 2. Order Block Rejection (1H)
Price tapped a clearly defined Bearish Order Block in premium pricing, just above the mid-range of the Inside Bar.
💥 Reaction confirmed:
Rejection candles from OB
Structure respecting downside bias
Fakeout = Fuel for downside expansion
📉 3. Bearish Continuation Structure
Price is moving within a descending channel, respecting internal supply zones. Each lower high is met with supply pressure, and internal lows are swept before moving lower.
You’re looking at a high-probability continuation move toward the weak low marked near $102,200.
🧊 4. Weak Low as Final Target
This level is a classic liquidity magnet – weak lows = retail stop clusters = Smart Money target.
We expect BTC to:
Tap OB
Reject with minor pullback
Break structure
Fill imbalance and target weak low
It’s a beautiful setup if managed correctly.
🧠 5. Psychology & Trap Narrative
Retail is:
Buying the breakout of Inside Bar
Placing stops under weak lows
Ignoring the OB rejection
Smart Money is:
Selling from OB
Riding the imbalance
Grabbing liquidity from below
This is where you flip from reaction-based trading to narrative-based execution.
🧮 6. Trade Setup Summary
📍 Entry Zone: $108,500–$109,700 (OB zone)
🔐 Stop Loss: Above $109,800 (invalidate OB)
🎯 Target:
TP1: $106,500
TP2: $104,000
TP3: $102,200 (Sell-side Liquidity Sweep)
⚖️ RRR: Approx. 1:4 to 1:5 depending on entry
⚠️ Risk Management:
Do not overleverage.
This setup rewards patience and narrative confirmation, not emotional entries. Wait for OB confirmation and rejection.
📈 If this hits, it’s a chart you screenshot and study again and again.
💬 Comment “INSIDE BAR MASTERCLASS” if you’re watching this play out live. Share with your trading circle.
BTC- New Impulse Soon You Can See read captionbitcoin (BTC) – Bullish Outlook
Price action breaking above key resistance, signaling potential trend continuation
Strong volume supports the move, confirming buyer strength
Higher highs and higher lows forming—classic bullish market structure
RSI and MACD both showing bullish divergence
Next target zone: TSXV:XX ,XXX – watch for consolidation or breakout
Overall sentiment shifting positive with macro tailwinds

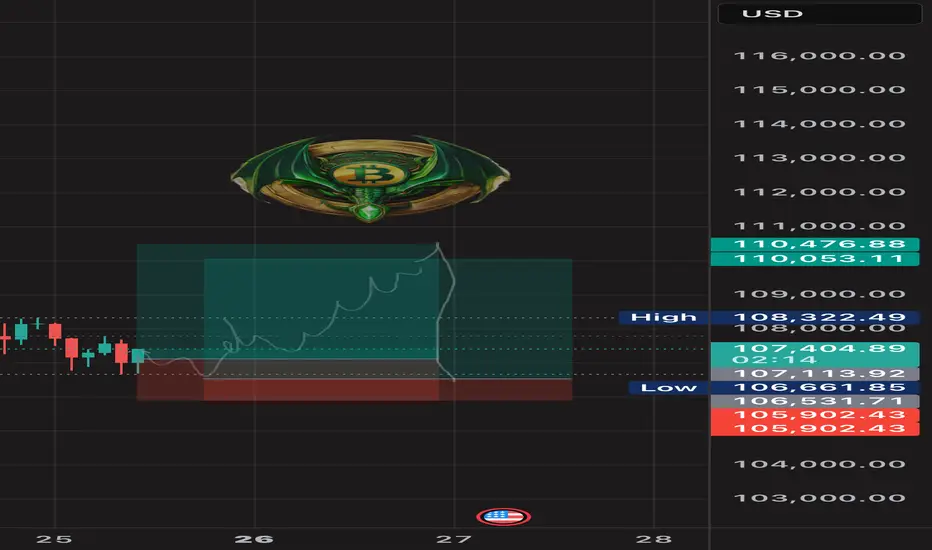
BTC LONG TP:110,000 25-05-2025🚀 LONG setup in play
Looking to enter between 106,500 and 107,000, targeting 109,800–110,300 on the 2H chart.
Estimated duration: 24 hours ⏳
We’re riding a bullish rebound — clean structure, strong reaction.
If the move doesn’t happen within the projected window, the setup is invalid.
We don’t use indicators, we’re not out here drawing lines or cute little shapes — I just give you a clean trade.
#BTC #PriceAction #Reydragon21
Bitcoin H1 | Overlap support at 50% Fibonacci retracementBitcoin (BTC/USD) is falling towards an overlap support and could potentially bounce off this level to climb higher.
Buy entry is at 106,479.20 which is an overlap support that aligns with the 50.0% Fibonacci retracement.
Stop loss is at 104,000.00 which is a level that lies underneath a swing-low support.
Take profit is at 110,363.00 which is a pullback resistance that aligns close to the 61.8% Fibonacci retracement.
High Risk Investment Warning
Trading Forex/CFDs on margin carries a high level of risk and may not be suitable for all investors. Leverage can work against you.
Stratos Markets Limited (tradu.com ):
CFDs are complex instruments and come with a high risk of losing money rapidly due to leverage. 63% of retail investor accounts lose money when trading CFDs with this provider. You should consider whether you understand how CFDs work and whether you can afford to take the high risk of losing your money.
Stratos Europe Ltd (tradu.com ):
CFDs are complex instruments and come with a high risk of losing money rapidly due to leverage. 63% of retail investor accounts lose money when trading CFDs with this provider. You should consider whether you understand how CFDs work and whether you can afford to take the high risk of losing your money.
Stratos Global LLC (tradu.com ):
Losses can exceed deposits.
Please be advised that the information presented on TradingView is provided to Tradu (‘Company’, ‘we’) by a third-party provider (‘TFA Global Pte Ltd’). Please be reminded that you are solely responsible for the trading decisions on your account. There is a very high degree of risk involved in trading. Any information and/or content is intended entirely for research, educational and informational purposes only and does not constitute investment or consultation advice or investment strategy. The information is not tailored to the investment needs of any specific person and therefore does not involve a consideration of any of the investment objectives, financial situation or needs of any viewer that may receive it. Kindly also note that past performance is not a reliable indicator of future results. Actual results may differ materially from those anticipated in forward-looking or past performance statements. We assume no liability as to the accuracy or completeness of any of the information and/or content provided herein and the Company cannot be held responsible for any omission, mistake nor for any loss or damage including without limitation to any loss of profit which may arise from reliance on any information supplied by TFA Global Pte Ltd.
The speaker(s) is neither an employee, agent nor representative of Tradu and is therefore acting independently. The opinions given are their own, constitute general market commentary, and do not constitute the opinion or advice of Tradu or any form of personal or investment advice. Tradu neither endorses nor guarantees offerings of third-party speakers, nor is Tradu responsible for the content, veracity or opinions of third-party speakers, presenters or participants.

Volatility Period: Up to May 29
Hello, traders.
If you "Follow", you can always get the latest information quickly.
Have a nice day today.
-------------------------------------
(BTCUSDT 1D chart)
It is showing a downward trend below the previous ATH range.
Accordingly, we need to see if it can rise to around 109588.0 and receive support.
However, since it is currently going through a period of volatility, we need to be careful about trading until May 28th.
-
If it falls further, we need to check if it can receive support near the Fibonacci ratio range of 1.902 (101784.54) ~ 2 (106178.85).
In particular, whether it can receive support near the M-Signal indicator on the 1D chart is key.
If it falls below the M-Signal indicator on the 1D chart, there is a possibility that it will touch the M-Signal indicator on the 1W chart, so we need to think about a response plan for this.
Therefore, if it shows support near the M-Signal indicator on the 1D chart, there is a possibility that it will show a pull back pattern.
The HA-High indicator of the 1D chart is formed at 102302.08, so it is important to see if there is support around this point.
-
The OBV indicator shows that OBV is falling below the High Line, and the StochRSI indicator is also showing that it has switched to a state of K < D.
Therefore, it is necessary to check whether OBV can touch the previous High Line or OBV EMA and rise.
If it falls below that, it is highly likely to lead to further decline.
I compared the previous OBV movements, that is, A, B, C, and the current movement, and the difference can be distinguished by whether it fell below the previous candle or not.
You can see that there is a difference from the previous movement because it is highly likely to close below the previous candle.
Therefore, the point to watch is whether it falls below 102302.08 after the volatility period or rises above 109588.0-110787.38.
If it falls below 102302.08 and receives resistance, it will turn into a short-term downtrend, and if it rises above 109588.0-110797.38, it is likely that the uptrend will resume, so it is a meaningful section.
-
Thank you for reading to the end.
I hope you have a successful trade.
--------------------------------------------------
- This is an explanation of the big picture.
(3-year bull market, 1-year bear market pattern)
I will explain more details when the bear market starts.
------------------------------------------------------
