BITCOIN Will Keep Growing! Buy!
Hello,Traders!
BITCOIN is trading in an
Uptrend and the coin made a
Great breakout of the previous
ATH which makes us super
Bullish biased so as BTC is
Making a local bearish correction
We will be expecting a bullish
Rebound from the rising support
And a further bullish move up
Buy!
Comment and subscribe to help us grow!
Check out other forecasts below too!
Disclosure: I am part of Trade Nation's Influencer program and receive a monthly fee for using their TradingView charts in my analysis.
1-BTCUSD

Bitcoin has the potential to return to $30,000A simple idea:
The Bitcoin price trend has clearly weakened, as you can see in the image above, the upward waves are getting weaker (the angle of the blue lines is getting smaller).
The price is moving in a curved channel and has the potential to reach $30,000.
BTC ...Take care of your trades...just sayinbearish setup confirmed by th ebreak of 101200
targets and invalidations on the chart

BTCUSD: 1D Golden Cross signals more upside to 155k.Bitcoin dropped below the overbought barrier on its 1D technical outlook (RSI = 69.592, MACD = 4447.700, ADX = 32.855) following today's Trump led pullback. On the long term though, this is nothing but a technical reaction to fundamentals and not enough to invalidate the bullish trend as not only did we make new ATH this week but also just completed a 1D Golden Cross. This is the first such pattern since October 27th 2024, which validated the previous bullish wave that peaked on the 2.0 Fibonacci extension. According to that, Bitcoin should extend the current uptrend with TP = 155,000.
## If you like our free content follow our profile to get more daily ideas. ##
## Comments and likes are greatly appreciated. ##

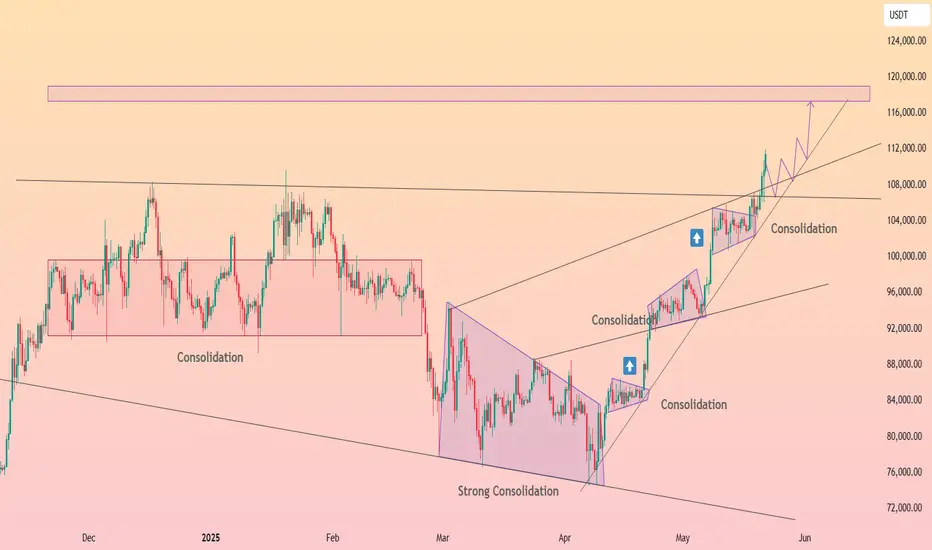
HolderStat┆BTCUSD has reached a new peakCRYPTOCAP:BTC has stair-stepped from 75 k to 110 k inside a steeply guided channel, carving neat consolidation bricks at every leg. A fresh box rests over 102 k support; defend that and the rising wedge projects toward the long-watched 118-120 k new-ATH zone. Break the inner rail and a glide to 96-97 k tests the mid-channel without derailing the dominant ascent.
BTCUSD (Bitcoin) Setting Up for a Trap and Crash📊 BTCUSD Smart Money Breakdown – May 23, 2025
This is a textbook liquidity trap setup — and the roadmap is crystal clear. The market already induced buyers at the top, is now tapping into an Order Block (OB) + 79% zone, and is preparing to nuke.
🔍 Market Narrative:
Strong high established – retail likely placing longs above that.
Clean retracement into Order Block zone (110,322 – 110,850) – where Smart Money is selling into demand.
PA is projected to fake a bullish breakout, reverse, and go for a deeper Fair Value Gap fill near 107,786, eventually targeting the Sell-Side Liquidity zone at 106,188.31.
📍 Key Confluences:
✅ OB + 79% Fibonacci = strong SMC reversal zone
✅ Clear FVG waiting to be filled = imbalance = magnet
✅ Weak low at 107,786.83 = perfect inducement for Smart Money run
✅ Final stop = Sell Side Liquidity sweep below 106,200
📉 Price Path Forecast:
Reject Order Block + Premium zone (110,496 – 110,850)
Retrace → FVG fill (between 108,900 – 107,800 zone)
Minor pullback or fake rally
Final move: liquidity raid under 106,188
Smart Money buys low again, setting up next bullish leg (later)
🎯 Trade Plan (Short Idea):
Entry Zone: Between 110,322 – 110,850 (OB)
SL: Above 111,000 (above inducement)
TP1: 107,786 (Weak Low)
TP2: 106,188 (Sell-Side Liquidity Pool)
RRR: Approx. 1:4 to 1:5 🔥
🧠 Institutional Logic:
Retail sees sideways structure = buys top resistance
SM sees that = sells into premium zone
This is accumulation → manipulation → distribution at its finest.
💬 Think BTC’s about to drop hard? Type “DUMP” or 🔻 in the comments! Let’s see who’s trading with the big boys.

SPY/QQQ Plan Your Trade for 5-23 : Carryover PatternLooking at the charts today, I want to say that it certainly looks like the SPY Cycle Patterns are blending into a consolidated CRUSH/BOTTOM pattern (see the weekend patterns) today and possibly "carrying over" into the early trading next week.
I have been warning of a pending rollover/breakdown in this uptrend for weeks. Today's breakdown seems a bit aggressive, but it is what it is.
If the patterns are consolidating/blending into a bigger breakdown over the Memorial Day weekend, then we could be looking at a very big downward/rotational move in the SPY/QQQ/Bitcoin over the next 5+ trading days while Gold/Silver continue to rally.
Silver is lagging Gold right now, but I don't think that lasts. Once Gold gets back above $3400, I believe Silver will start to make a big move higher.
The big question in my mind is - how does this carry into Monday's holiday trading schedule and into Tuesday's OPEN?
I'll have to see how things play out today - but it certainly looks like I'll be adding some SPREADS to potentially catch any big move over this weekend.
GET SOME.
This could play out exceptionally well for skilled traders.
#trading #research #investing #tradingalgos #tradingsignals #cycles #fibonacci #elliotwave #modelingsystems #stocks #bitcoin #btcusd #cryptos #spy #gold #nq #investing #trading #spytrading #spymarket #tradingmarket #stockmarket #silver

BITCOIN Ready for PUMP or what ?Bitcoin has completed and broken the ascending triangle in the monthly timeframe, The price is currently supported well, which can increase the price. I expect the price to rise to around 600k .
Give me some energy !!
✨We spend hours finding potential opportunities and writing useful ideas, we would be happy if you support us.
Best regards CobraVanguard.💚
_ _ _ _ __ _ _ _ _ _ _ _ _ _ _ _ _ _ _ _ _ _ _ _ _ _ _ _ _ _ _ _
✅Thank you, and for more ideas, hit ❤️Like❤️ and 🌟Follow🌟!
⚠️Things can change...
The markets are always changing and even with all these signals, the market changes tend to be strong and fast!!

Golden Cross? No Thanks. Here’s How to Get In Early.” – Part 2📉 “Golden Cross? No Thanks. Here’s How to Get In Early.” – Part 2
By FXProfessor
First of all — thank you for the likes, comments, and support on Part 1. It means a lot. 🙏
Let’s take it a step further today and fill in the gaps.
🔄 Quick Recap:
Last time, we exposed the Golden Cross for what it is —
📉 A lagging tool
📉 A confirmation at best
📉 The afterparty, not the entry
I showed you how EMAs are better than SMAs…
…but structure and trendlines still come first in my world.
⚙️ The FXProfessor Method (In Order):
Trendlines (my style)
Fibonacci Wedges
Structure – channels, ranges, pressure zones
EMAs
Divergences
Other indicators (case-by-case)
📉 Live Example – BTCUSD 1H:
Trendline rejection: We shorted the third touch 💥
Structure zone: Repeated tests + rejection = confidence
Divergences: I use an amazing divergence tool (min divergence = 3)
Result: Market turned exactly where structure and divergence aligned
🧠 A Little Secret:
I have a separate layout just for divergences.
Sophisticated. Tailored.
But even this simplified version shows 3 bearish divergences....
That’s not coincidence. That’s precision. And it comes Fast!
📌 Key Insight:
EMAs can be useful, but they come after the story is already unfolding.
Even if they support the price, by the time they cross — the trade is halfway done.
So remember:
Structure and pressure give us the first clues.
Indicators confirm what structure already told us.
This is what I call:
💡 Trading Rethought.
You don’t need to wait for lagging signals.
You can see the move forming, if you know where to look.
More content coming soon — and yes, it’s going to take your trading to another level.
One Love,
The FXProfessor 🧠📈

DeGRAM | BTCUSD new ATH📊 Technical Analysis
● Daily candle has closed above 108 250 $ – the February swing cap – completing an 8-week ascending triangle inside the rising channel and confirming fresh trend-acceleration.
● Momentum push has opened clear air to the red 112 000 $ supply / channel roof; former breakout line at 105 400 $ now acts as layered support together with the purple guideline.
💡 Fundamental Analysis
● Spot-ETF cohort (IBIT, FBTC, ARKB) logged a three-day net inflow >5 000 BTC while exchange reserves printed a new 3-year low (CryptoQuant), pointing to tightening tradable supply.
● DXY pulled back after FOMC minutes showed no appetite for further hikes, tempering real-yield gains and reviving crypto bid.
✨ Summary
Buy dips 106-108 k; upside window targets 112 k, stretch 115 k. Bull bias void only on a daily close beneath 100.7 k.
-------------------
Share your opinion in the comments and support the idea with a like. Thanks for your support!

Where' s BTC heading to?#bitcoin price did well in May. It was spot buying with good volume, that was positive. I' ve been observing some issues on #btc chart.
CRYPTOCAP:BTC has been moving in an ascending channel, breaking down these channels results with heavy correction. (As CRYPTOCAP:ETH broke a long time ascending channel and dumped heavily months ago) . Plus, There have been a bearish divergence whilst #btcusd moving upside for weeks. I showed the divergence on the chart. 113 - 114K is the very important resistance point for btc price. A hard declination there will result a heavy but healthy correction.
Above 115K with weekly closes are the invalidation. Not financial advice.

Digital gold breaks records: Bitcoin broke through the $111,000 On May 22, 2025, Bitcoin (#BTCUSD) reached a new all-time high, surpassing the $111,000 mark. Notably, this record was set on the day marking the 15th anniversary of Bitcoin Pizza Day - a symbolic date commemorating the first real-world purchase made with #BTCUSD in 2010.
Several major factors have contributed to the recent rise of Bitcoin:
Institutional Investment : The launch of spot Bitcoin ETFs by BlackRock, Fidelity, and others has opened the door for large-scale investors to access #BTCUSD, boosting both liquidity and demand.
Regulatory Clarity : The adoption of clear cryptocurrency regulations in the U.S. and the EU has increased trust in digital assets and attracted more conservative capital.
Banking Integration : Support for #BTCUSD by apps like PayPal, Revolut, and major banks has simplified access for millions of users and expanded its real-world usage.
Macroeconomic Instability : Inflation, geopolitical tensions, and the weakening of fiat currencies have strengthened demand for #BTCUSD as "digital gold" and a means of capital preservation.
Halving and Technological Progress : The reduction in BTC issuance and the ongoing development of the Lightning Network are reinforcing Bitcoin’s scarcity and enhancing its fundamental value.
Surpassing such a significant price level has reinforced #BTCUSD’s position as one of the key assets in today’s financial markets, confirming its status as "digital gold." The rally has sparked a wave of optimism and renewed activity on crypto exchanges, while also drawing increased interest in digital assets from the broader public.
FreshForex analysts share the view that #BTCUSD still holds significant growth potential. In our assessment, the breakout above $111,000 in May signals a continuing upward trend and the possibility of further gains, driven by growing institutional interest.

May 22 Bitcoin Bybit chart analysisHello
It's a Bitcoinguide.
If you have a "follower"
You can receive comment notifications on real-time travel routes and major sections.
If my analysis is helpful,
Please would like one booster button at the bottom.
This is the Nasdaq 30-minute chart.
Where the mid-term pattern is restored
Blue finger short->long switching
Long waiting strategy up to section 1.
I marked the target price section at the top / the support line price at the bottom
I will try to apply it to Bitcoin as is.
Here is the Bitcoin 30-minute chart.
Nasdaq indicators will be announced at 9:30 and 11:00 shortly.
Nasdaq movement + short-term pattern is broken,
and the Tether Dominance short position operation method is applied to Bitcoin, which moves in the opposite direction.
* One-way long position strategy when the red finger moves
1. $109,917.6 long position entry section / When the green support line is broken,
or when section 2 is touched, stop loss price
2. $113,701.9 long position 1st target -> Good 2nd target price
Section 1 at the top is the last short position operation section of the day,
and when it breaks through, it can be connected to an upward trend,
so it seems advantageous for beginners to use it as a long waiting strategy in an upward wave.
If you touch the red finger long position entry section first among 1 or 109.9K,
You can go around and rise strongly.
If you succeed in rebounding without breaking the purple support line,
Vertical rise
Movement within the 1st section at the top and 2nd section at the bottom is sideways.
Because it is open from Bottom -> 3,
Be careful of Nasdaq fluctuations,
If you succeed today, you will have 4 consecutive perfects.
Please use my analysis articles for reference and use only
I hope you operate safely with principle trading and stop loss prices.
Thank you.

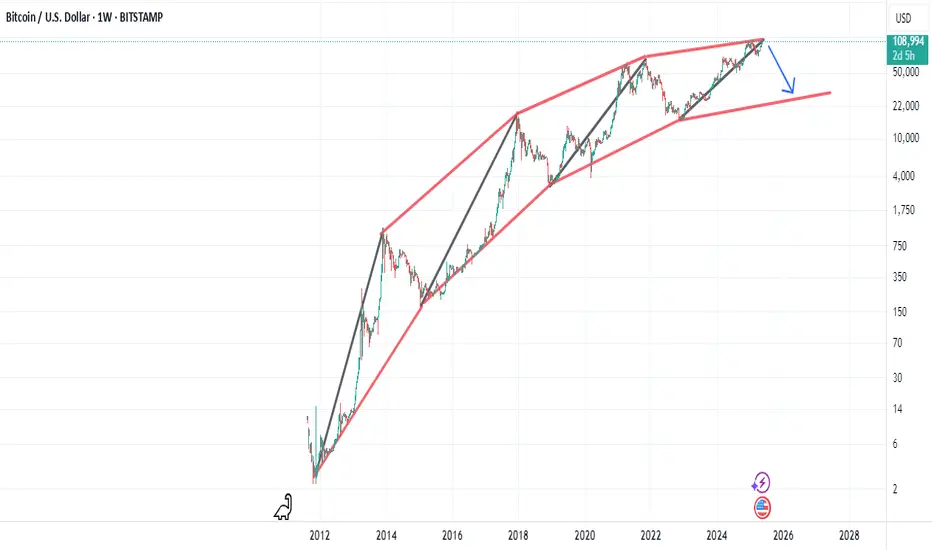
BITCOIN is attempting to converge with past Cycles!Bitcoin (BTCUSD) is experiencing the weakest Bull Cycle in its history, a natural product of the Theory of Diminishing Returns (TDM).
This chart couldn't have put it better as we show all Cycles since BTC's first day, one on top of the other. Naturally the first Cycles were the most aggressive, witnessing extraordinary gains as the upside potential of a fresh market was enormous in its early days.
The 2015 - 2017 (blue trend-line) and 2019 - 2021 (black trend-line) Bull Cycles have been harmonized to a more traditional capital market state and this is obvious on their trend-lines, which exhibit similar parallel price action. Whenever the two diverged, they converged at some point during the Cycle.
The current Cycle (2023 - 2025) following the late February 2025 divergence, is now attempting to converge again with its strong rebound in the past 6 weeks. Being however within a Channel Up throughout the entirety of the Cycle, it appears that it will do so in a structured way and as the TDM suggests, will offer weaker gains.
What we can project, as we've shown on previous studies in great detail, is the timing of the Cycle Top. Based on past Cycles, it should be within October - December 2025. Timing your exit strategy can perhaps be more effective than assigning a certain Target, even though the peak is expected to be anywhere within the $150k - $200k range.
So do you agree that the rise we're witnessing is the Cycle's attempt to converge with past ones and close the gap before it tops? Feel free to let us know in the comments section below!
-------------------------------------------------------------------------------
** Please LIKE 👍, FOLLOW ✅, SHARE 🙌 and COMMENT ✍ if you enjoy this idea! Also share your ideas and charts in the comments section below! This is best way to keep it relevant, support us, keep the content here free and allow the idea to reach as many people as possible. **
-------------------------------------------------------------------------------
💸💸💸💸💸💸
👇 👇 👇 👇 👇 👇

BTCUSD Double Tap Into OB Before Massive Sell-Off! 2,000+ PipsHere’s why this could be one of the cleanest bearish setups of the week based on institutional flow and price action:
🚨 Step 1: Liquidity Engineering in Full Effect
We’ve got multiple areas where price was engineered to grab liquidity — clearly visible with those highlighted zones. Bitcoin pumped into a Strong High, tagging liquidity above a key trendline while respecting an internal parallel channel.
This move was not random. It was a textbook liquidity sweep.
🔁 Step 2: Order Block + 70.5% Fib Confluence
After the sweep, price retraced precisely into a bearish Order Block that overlaps perfectly with the 70.5% Fibonacci level — a hidden gem Smart Money loves to use for optimal entries. It’s the sniper zone.
This is where the first rejection came in, marking the start of bearish intent.
⚠️ Step 3: Break of Structure + Weak Low Exposed
As price dropped, it broke back under a weak low, confirming shift in market structure. This is your Change of Character (ChoCh) — the moment sellers regain control.
We’re now seeing retracement candles struggling to push above the OB/Fib zone. Rejection here confirms the setup.
🎯 Target Zones Breakdown:
✅ TP1 - Weak low around 110,200
✅ TP2 - -27% Extension (~109,500)
✅ TP3 - -62% Fib extension (109,268)
🚀 Extended Target - Possible sweep of Sell Side Liquidity all the way to 108,000–107,500
This is a potential 2000+ pip move if the full extension plays out.
🧠 Market Psychology in Play:
Institutions love to trap traders long after major breakouts. That last pump into the high? It wasn’t retail demand — it was liquidity generation. Now that they’ve swept the highs, they're driving price down to rebalance and mitigate.
Every highlighted zone on this chart? It’s a Smart Money footprint.
📌 Entry Game Plan:
Watch how price behaves around the current OB zone (111,250–111,618).
If price rejects and flips back under the midpoint (111,116), that’s your trigger.
Enter with tight SL above 111,750 and aim for TP1, TP2, and trail the rest to TP3 or lower.
📈 Risk Management Reminder:
Set your SL above structure.
Don’t overleverage — this is a clean setup, but patience is 🔑.
Let price come to you, not the other way around.
✍️ Final Thoughts:
This BTCUSD setup screams Smart Money — we’ve got:
Liquidity grabs ✅
Clean OB + Fib confluence ✅
ChoCh + structural rejection ✅
Strong R:R with multiple targets ✅
This might be the move to catch before the weekend liquidity sweep.
💬 Comment "BTC MOVE" if you’re watching this with me!
🔁 Tag your trading fam who needs to see this breakdown!

Bitcoin Remains Bulish once again, almostinner cycle 5 waeces impulse looks completed , but bigger cycle not just yet,
Sell from current levels to 103.000
Buy from 103.000 Targetting 117.000 / 123.000
GG

Bitcoin H1 | Pullback support at 23.6% Fibonacci retracementBitcoin (BTC/USD) is falling towards a pullback support and could potentially bounce off this level to climb higher.
Buy entry is at 109.174.00 which is a pullback support that aligns with the 23.6% Fibonacci retracement.
Stop loss is at 105,800.00 which is a level that lies underneath a multi-swing-low support and the 50.0% Fibonacci retracement.
Take profit is at 113,948.50 which is a resistance that aligns with the 100.0% Fibonacci projection.
High Risk Investment Warning
Trading Forex/CFDs on margin carries a high level of risk and may not be suitable for all investors. Leverage can work against you.
Stratos Markets Limited (tradu.com ):
CFDs are complex instruments and come with a high risk of losing money rapidly due to leverage. 63% of retail investor accounts lose money when trading CFDs with this provider. You should consider whether you understand how CFDs work and whether you can afford to take the high risk of losing your money.
Stratos Europe Ltd (tradu.com ):
CFDs are complex instruments and come with a high risk of losing money rapidly due to leverage. 63% of retail investor accounts lose money when trading CFDs with this provider. You should consider whether you understand how CFDs work and whether you can afford to take the high risk of losing your money.
Stratos Global LLC (tradu.com ):
Losses can exceed deposits.
Please be advised that the information presented on TradingView is provided to Tradu (‘Company’, ‘we’) by a third-party provider (‘TFA Global Pte Ltd’). Please be reminded that you are solely responsible for the trading decisions on your account. There is a very high degree of risk involved in trading. Any information and/or content is intended entirely for research, educational and informational purposes only and does not constitute investment or consultation advice or investment strategy. The information is not tailored to the investment needs of any specific person and therefore does not involve a consideration of any of the investment objectives, financial situation or needs of any viewer that may receive it. Kindly also note that past performance is not a reliable indicator of future results. Actual results may differ materially from those anticipated in forward-looking or past performance statements. We assume no liability as to the accuracy or completeness of any of the information and/or content provided herein and the Company cannot be held responsible for any omission, mistake nor for any loss or damage including without limitation to any loss of profit which may arise from reliance on any information supplied by TFA Global Pte Ltd.
The speaker(s) is neither an employee, agent nor representative of Tradu and is therefore acting independently. The opinions given are their own, constitute general market commentary, and do not constitute the opinion or advice of Tradu or any form of personal or investment advice. Tradu neither endorses nor guarantees offerings of third-party speakers, nor is Tradu responsible for the content, veracity or opinions of third-party speakers, presenters or participants.

Altcoin Season Brewing?Hi,
The OTHERS/BTC pair represents the collective market capitalization of altcoins relative to Bitcoin. This ratio is a critical indicator of altcoin strength or weakness against Bitcoin. The weekly chart reveals a prolonged bearish phase for altcoins, with Bitcoin dominance persisting. However, recent data suggests potential inflection points worth monitoring.
Key Technical Elements:
- Ascending Channel: The pair is moving within a well-defined macro upward channel. It is currently sitting at the bottom boundary, suggesting a potential reversal point.
- Support Zone: The lower boundary of the channel (purple line) aligns with previous bounce points (2019, 2020, mid-2023), reinforcing its validity.
- RSI Indicator: The RSI has shown bullish divergence with price making lower lows while RSI forms higher lows.
My Opinion:
This chart suggests we are near the bottom for altcoins vs BTC, and the risk/reward is heavily tilted in favor of a bounce, especially going into a potential Q3-Q4 altseason. It’s a classic accumulation zone where smart money tends to position.
And what to do?
- scale into altcoin positions cautiously.
- Use the channel low as a stop-loss zone.
- Look for confirmation over the next 1–2 weeks with bullish candles or increased volume.
Happy Trading,

Next Target: Right Fibonacci Ratio 2.24 (116940.43)
Hello, traders.
If you "Follow" me, you will always get the latest information quickly.
Have a nice day today.
-------------------------------------
(BTCUSDT 1D chart)
It was supported near the Fibonacci ratio 2 (106178.85) and rose to renew the new high (ATH).
If this upward trend continues, it is expected to rise near the Fibonacci ratio 2.24 (116940.43).
-
If it falls,
1st: 102302.08
2nd: 97226.92
3rd: 89294.25
You need to check which of the 1st and 3rd areas above is supported.
Since the M-Signal indicator on the 1D chart is passing near the 1st area, if it falls below this, there is a possibility that it will turn into a short-term downtrend.
The M-Signal indicator on the 1W chart is still rising around 94K, but since the 97226.92 point is the HA-High indicator point on the 1W chart, I think it is likely to continue the upward trend if it receives support around this area.
The 89294.25 point is the HA-Low indicator point on the 1D chart, so if it receives support around this area, it is a good time to buy.
-
(30M chart)
If the price continues to rise by renewing the ATH, it is difficult to set support and resistance points.
Therefore, you need to be careful when trading coins (tokens) that are renewing the ATH.
Therefore, I think it is better to trade in a short-term trading (day trading) method, but to leave the number of coins (tokens) corresponding to the profit for the profit realization method.
In other words, when the price rises and then falls by the purchase price, the method is to sell only the purchase amount (+ transaction fee) to leave the coin (token) corresponding to the profit.
When selling, you should not sell the number of coins (tokens), but you should sell only the purchase amount.
You do not necessarily have to sell all of the purchase amount, but if possible, it is better to sell close to the purchase amount.
The reason is that when the price plummets or turns downward, there is a possibility of psychological pressure.
In my chart, the trading strategy is when the HA-Low and HA-High indicators are touched.
If it is supported near the HA-Low indicator, it is the time to buy, and when it meets the HA-High indicator, it is the time to sell.
However, if it is supported near the HA-High indicator, there is a possibility that a stepwise upward trend will continue, so a split selling strategy is necessary.
On the other hand, if it falls after receiving resistance from the HA-Low indicator, it is likely to show a stepwise downtrend, so a split buying strategy is needed.
-
When you meet the HA-Low and HA-High indicators, if you check the movement of the OBV indicator, it can help you create a trading strategy.
That is, when the OBV indicator breaks upwards through the Low Line, High Line, and OBV EMA, the price is likely to rise, and if the opposite happens, the price is likely to fall.
-
Thank you for reading to the end.
I hope you have a successful trade.
--------------------------------------------------
- This is an explanation of the big picture.
(3-year bull market, 1-year bear market pattern)
I will explain more details when the bear market starts.
------------------------------------------------------

Bitcoins LinesPrice is approaching previous highs with strong bullish momentum and no major resistance until the red-marked level around 240,000. Given the breakout structure and Fibonacci confluence, the most likely scenario is continuation toward the 140,000–160,000 range before facing any significant rejection. A stop loss would be prudent just below 91,000, with the initial target set at 139,000, and extended TP zones at 155,000 and 239,000. This trade aligns with a longer-term macro trend.

BTCUSD update May 22nd, 2025I have returned and here is my updated chart. I'm such a perfectionist sometimes when it comes to lines that it takes my hours to get them exactly how I envision. To start off, yes I am bullish on Bitcoin and believe that this cycle hasn't ended yet but I will admit that I think the end of it is closer than the beginning. With that being said, I will not disappear when the bear market starts, I will simply make updates and try to catch the bottom like I did in the past. So far I am going with history and my bottom target is above 66,800 and I expect the floor to fizzle out around 71-73k; if it ends up being higher than that, great! Overall this idea is just an update for my own personal records and my prediction is based on what has happen that last time this pattern was brought to us.
Stay safe out there, happy trading, and as always--Cheers!


BTC traffic update and channel exit.As we can see, the BTC price is moving according to the previously mentioned rules. Here we can see how the price left channel number 1 at the top, and the increase after leaving the channel gave an upward movement at the level of the height of the channel itself.
In this situation, it is worth paying attention to channel number 2, from which we also previously got an exit at the top with a strong upward movement, currently we can see how the price is fighting with strong resistance at the level of $ 111,500, however, taking into account the height of channel number 2, we can mark the level of around $ 121,500 as another very strong resistance.
