May 21 Bitcoin Bybit chart analysisHello
It's a Bitcoinguide.
If you have a "follower"
You can receive comment notifications on real-time travel routes and major sections.
If my analysis is helpful,
Please would like one booster button at the bottom.
This is the Nasdaq 30-minute chart.
There is no separate indicator announcement today.
After the red finger chase purchase,
I explained the main demand section drawing and price.
I applied it to Bitcoin as is.
This is a Bitcoin 30-minute chart.
At the bottom left, the purple finger
connects the strategy to the long position entry section that was entered on the 20th.
*When the red finger moves,
it is a one-way long position strategy.
1. $105,263.7 long position entry section / stop loss price when the sky blue support line is broken
2. $108,207.6 long position 1st target -> Top 2nd target -> Good 3rd target price
The 1st section at the top is the rising wave confirmation section,
and the strategy is more likely to succeed if the purple support line is broken after the touch.
(If it goes up right away, there is a possibility of a vertical rise)
Red finger long hold
If it goes down right away without touching, it is the final long hold strategy at 2.
From the 2nd section deviation, I marked Bottom -> 3
Since the mid-term pattern was broken yesterday,
you should succeed in rebounding within the green support line if possible.
Up to this point, I ask that you simply use my analysis for reference and use,
and I hope that you operate safely with principle trading and stop loss prices.
Thank you.
1-BTCUSD

My buy view for BTCFollowing my previous analysis, BTC has retraced back to around $95K zone.
If the zone continues to hold, we should expect BTC to continue to rally towards north.
Lets keep our eyes on $100K target if the support zone of $95 holds strong

The BTC/USD Short PlayNew high, new trend lines.
I saw a correction coming on the charts, using two trendline - 1 as my trend, the second as my safety, I set up a short for a lower level profit target.

BITCOIN made new ATH but still much time left before a Cycle topBitcoin (BTCUSD) is about to enter the final week of May, with the month mostly likely to close on a strong green candle, the 2nd straight. Though it made yesterday a new All Time High (ATH) above 109k and many are already talking about a bearish reversal, this chart shows that there is still plenty of time left before the current Bull Cycle tops.
If fact a simple measurement of the Bottom to Bottom and Bottom to Top ranges of the last 3 Cycles is enough to present all the evidence that are needed for this case.
As you can see, the previous 2 Bull Cycles lasted for 35 months (1065 days) from Bottom to Top. Similarly, the Bottom to Bottom (Bear Cycle to Bear Cycle) measurement has been 47 months (1430 days).
This amazing symmetry suggest that BTC is more likely than not to repeat this feat on the current Cycle as well. A 35 month range from Top to Top indicates that the Bull Cycle is expected to peak on October 2025, while a 47 month Bottom to Bottom range indicates that the next Bear Cycle should bottom in October 2026! As far as a potential price top is concerned, various of the previous analyses we've conducted show that $200k is a fair maximum, but the current study focuses on the timing of profit taking and not specific price levels.
So are you willing to book your profits by this October? Feel free to let us know in the comments section below!
-------------------------------------------------------------------------------
** Please LIKE 👍, FOLLOW ✅, SHARE 🙌 and COMMENT ✍ if you enjoy this idea! Also share your ideas and charts in the comments section below! This is best way to keep it relevant, support us, keep the content here free and allow the idea to reach as many people as possible. **
-------------------------------------------------------------------------------
💸💸💸💸💸💸
👇 👇 👇 👇 👇 👇


Hellena | BITCOIN (4H): LONG to resistance area of 110,000.Colleagues, I believe that the upward movement is not over yet, so I move wave “3” higher as prolonged.
I believe that the price will reach a strong resistance level of 110,000.
A small correction is possible, as usual.
Manage your capital correctly and competently! Only enter trades based on reliable patterns!


BTCUSD UPDATE - 22- 05- 2025This chart illustrates a potential rising wedge pattern in the Bitcoin/USDT (BTC/USDT) 45-minute timeframe on Binance. Here's a breakdown of the key elements:
Chart Analysis:
Rising Wedge Pattern (Bearish):
The price is moving within converging trend lines (marked in blue), forming a rising wedge — typically a bearish reversal pattern.
The projected breakdown (blue arrow) suggests a move downward out of the wedge.
Support Zone (Yellow Box):
A strong historical support zone is highlighted, around the $103,000–$104,500 range.
This is the likely target if the price breaks down from the wedge.
Bearish Target:
If the breakdown occurs, the price may fall to the yellow support zone.
Volume spikes on recent candles suggest increasing interest or volatility.
Stop Loss Zone (Red Area):
The red shaded area at the top of the wedge likely represents a stop-loss for a short trade setup.
Current Price: Around $110,708.20 at the time of the snapshot.
Summary:
The chart implies a potential short opportunity based on the rising wedge breakdown, targeting the yellow support zone. Confirmation would be needed from a strong bearish candle closing below the lower wedge boundary with increased volume.
Would you like help identifying entry/exit points or risk management strategies for this trade setup?

BTC - Can BTC push past $109k in this rising channel?Bitcoin has been trading within a clearly defined upward channel since the beginning of April. This rising channel is characterized by three touchpoints on both the upper and lower trendlines, indicating a consistent pattern of price movement within these boundaries.
Approaching key resistance
Currently, BTC is approaching a critical resistance level near the $109,000 mark, which coincides with its previous all-time high. This level represents a significant psychological and technical barrier, as it was the peak of the last major bull cycle. The price is now testing this resistance while still remaining within the rising channel. The confluence of the upper channel resistance and the historical all-time high makes this a decisive moment for Bitcoin's price action.
Bullish breakout
A rejection from this resistance zone could lead to a temporary pullback, potentially towards the lower boundary of the rising channel. This would not necessarily signal the end of the bullish trend, but rather a healthy consolidation within the established structure. However, a confirmed breakout above the $109,000 level, especially if supported by strong volume and bullish momentum, would likely signal a significant shift in market dynamics. Such a breakout would validate the strength of the current uptrend and could open the door for new all-time highs. In that scenario, the $109,000 level would likely flip from resistance to support, becoming a crucial area for bulls to defend on any future retests.
Bearish breakout
On the downside, traders should also be aware of the implications of a breakdown below the rising channel. The lower boundary of the channel, currently located around $104,000, is an important technical level to watch. A decisive break below this level could indicate a loss of short-term bullish momentum and may trigger a deeper retracement. In such a case, BTC would likely target the imbalance zone between $97,500 and $100,500, a region where price moved rapidly in the past without establishing strong support or resistance. This zone could serve as a critical area for buyers to step in and attempt to reestablish bullish control, potentially setting the stage for another rally toward the $109,000 resistance and a renewed attempt at a breakout.
Conclusion
In summary, Bitcoin is currently at a pivotal juncture. The upward channel that has guided price action since April remains intact, but BTC is now confronting a major resistance zone at its previous all-time high. Whether price breaks through to new highs or experiences a pullback will depend on the strength of market momentum and the behavior of buyers and sellers at these key levels. Traders and investors should remain vigilant and prepared for both scenarios, as the next move could set the tone for Bitcoin’s trajectory in the coming weeks.
Thanks for your support.
- Make sure to follow me so you don't miss out on the next analysis!
- Drop a like and leave a comment!


BTC/USD Facing Key Resistance – Watch for Daily Close ConfirmatiBitcoin is currently testing a critical resistance zone between 107,150 and 107,800, which has previously acted as a strong supply area. For the bullish trend to continue, we need to see a daily close above this resistance range.
Until a confirmed breakout occurs, the price is vulnerable to a pullback toward the rising trendline, which has been supporting the uptrend since April.
📌 Key Points:
Strong horizontal resistance at 107,150–107,800
Rising wedge structure could signal exhaustion
A daily candle close above 107,800 is required for further upside continuation
Failure to break this resistance increases the probability of a correction toward the ascending trendline support
This is a critical area to monitor for both breakout traders and those looking for potential short-term reversal setups.

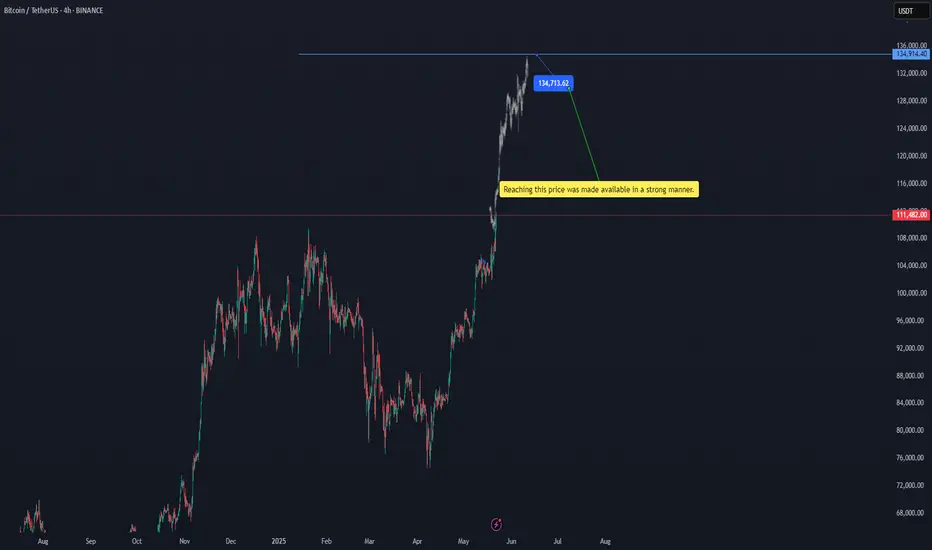
btcusdtReaching this price was made available in a strong manner. 134713.16$ BINANCE:BTCUSDT
Of course, there is a possibility of a temporary correction at the current price, but the target is $134,713.
#btc
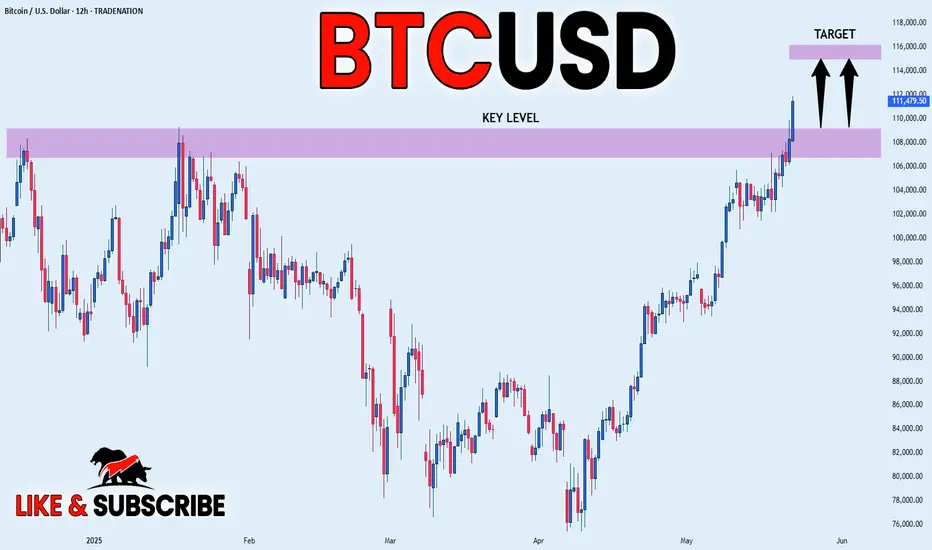
BITCOIN MASSIVE BREAKOUT|LONG|
✅BITCOIN is trading in an
Uptrend and the coin finally
Made a bullish breakout of
The previous ALL-TIME-HIGH
Of 109,200$ level which
Was a strong resistance
Level and the coin is now trading
Almost 3% above the previous ATH
Which reinforces our bullish bias
In a powerful way and after a
Potential pullback we are quite
Likely to see some further
Growth on Bitcoin
LONG🚀
✅Like and subscribe to never miss a new idea!✅
Disclosure: I am part of Trade Nation's Influencer program and receive a monthly fee for using their TradingView charts in my analysis.
BTC Creating THIS Pattern Right Now – 108K Next?#BTC is forming a powerful pattern right now! 📊
Are we about to witness the breakout that takes us to **108K**? ⏰
Watch closely – the market's heating up! 🔥
#Bitcoin #Crypto #BullRun #BTC108K

ADAUSDT WeeklyLet's see the chart on higher timeframes a bit also for once. Let us examine the bigger levels and bigger picture.

BITCOIN - Time to buy again!Currently, BTC is forming an ascending triangle, indicating a potential price increase. It is anticipated that the price could rise, aligning with the projected price movement (AB=CD).
However, it is crucial to wait for the triangle to break before taking any action.
Stay Awesome , CobraVanguard

BTC SHORT TP:106,000 21-05-2025🚨 SHORT setup activated
Entry between 109,500 and 110,500, targeting 105,600–106,200 on the 4H chart.
Estimated duration: 24 hours ⏳
This looks like a classic fake breakout, trapping late longs before flushing them out.
Price action is primed for a clean drop — get in smart and manage your stop.
If the move doesn’t happen within the projected time, the setup is invalid.
We don’t use indicators, we’re not out here drawing lines or cute little shapes — I just give you a clean trade.

BTCUSDT | Chasing in Euphoria? Here’s the Smarter MoveI’ve watched BTC explode during rallies like this, and trust me, finding low-timeframe entries in euphoria is a trap for most. The move looks unstoppable… until it isn't.
Right now, I’m only considering a 1R risk from the green box support . No more. No less. The risk is calculated, not emotional.
If you’re thinking of jumping in recklessly, don’t.
I’ll be watching the 1-minute timeframe closely for a clean upward break before doing anything. No confirmation, no trade.
Reminder:
“I will not insist on my short idea. If the levels suddenly break upwards and do not give a downward break in the low time frame, I will not evaluate it. If they break upwards with volume and give a retest, I will look long.”
Most people don’t know how to think like this. That’s why they lose.
You’re here to win, and I’m here to guide you.
📌I keep my charts clean and simple because I believe clarity leads to better decisions.
📌My approach is built on years of experience and a solid track record. I don’t claim to know it all but I’m confident in my ability to spot high-probability setups.
📌If you would like to learn how to use the heatmap, cumulative volume delta and volume footprint techniques that I use below to determine very accurate demand regions, you can send me a private message. I help anyone who wants it completely free of charge.
🔑I have a long list of my proven technique below:
🎯 ZENUSDT.P: Patience & Profitability | %230 Reaction from the Sniper Entry
🐶 DOGEUSDT.P: Next Move
🎨 RENDERUSDT.P: Opportunity of the Month
💎 ETHUSDT.P: Where to Retrace
🟢 BNBUSDT.P: Potential Surge
📊 BTC Dominance: Reaction Zone
🌊 WAVESUSDT.P: Demand Zone Potential
🟣 UNIUSDT.P: Long-Term Trade
🔵 XRPUSDT.P: Entry Zones
🔗 LINKUSDT.P: Follow The River
📈 BTCUSDT.P: Two Key Demand Zones
🟩 POLUSDT: Bullish Momentum
🌟 PENDLEUSDT.P: Where Opportunity Meets Precision
🔥 BTCUSDT.P: Liquidation of Highly Leveraged Longs
🌊 SOLUSDT.P: SOL's Dip - Your Opportunity
🐸 1000PEPEUSDT.P: Prime Bounce Zone Unlocked
🚀 ETHUSDT.P: Set to Explode - Don't Miss This Game Changer
🤖 IQUSDT: Smart Plan
⚡️ PONDUSDT: A Trade Not Taken Is Better Than a Losing One
💼 STMXUSDT: 2 Buying Areas
🐢 TURBOUSDT: Buy Zones and Buyer Presence
🌍 ICPUSDT.P: Massive Upside Potential | Check the Trade Update For Seeing Results
🟠 IDEXUSDT: Spot Buy Area | %26 Profit if You Trade with MSB
📌 USUALUSDT: Buyers Are Active + %70 Profit in Total
🌟 FORTHUSDT: Sniper Entry +%26 Reaction
🐳 QKCUSDT: Sniper Entry +%57 Reaction
📊 BTC.D: Retest of Key Area Highly Likely
📊 XNOUSDT %80 Reaction with a Simple Blue Box!
📊 BELUSDT Amazing %120 Reaction!
📊 Simple Red Box, Extraordinary Results
I stopped adding to the list because it's kinda tiring to add 5-10 charts in every move but you can check my profile and see that it goes on..

BTC the last bullLooking at the halving history index, I predict this year will be the last bull year after the 2024 halving. It is difficult to predict the final month of the bull run phase, but this year is amazing. The conditions may change, nothing is certain but history always gives clues.
NFA!DYOR!

TSLA PRICE ACTION 21st MAY 2025This is the updated price action of Tesla. I have clearly discussed the new buying levels & have also discussed why I sold it.
If you have any questions, feel free to leave a comment or DM me.
NOTE: AVOID OPTIONS IN TESLA

BTCUSD / BITCOIN | 4H | WAIT BREAKOUT Good morning, my friends
Bitcoin support level is $96,900.00, while the resistance level stands at $104,600.00.
Right now, I'm just waiting for an upward breakout. Once that happens, I'll provide a clear target.
Don't forget to hit the like button so you don't miss any updates on this analysis.
My dear friends, your likes are the biggest motivation for me to keep sharing my analyses. I truly appreciate everyone who supports my work with their likes—thank you so much!
With respect and love.

BTC/USD - Bull Market/Bear Market CycleApart from a few deviations, BTC/USD is still following its 731/730 day Bull Market/Bear Market Cycle.
After the next 6 Month Candle which starts July 2025, we may see an even crazier new ATH or we may start early into the inevitable 1 1/2 to 2 year downtrend before the next major BTC Bull-run, which according to this chart, should start around July 2027.
Be on the lookout for a new Descending Triangle Pattern on this one Month chart, this normally leads to a 48% breakdown drop from the bottom of the Descending Triangle Pattern as can be seen previously on this chart.
The 6 Month Chart:

BTC Hits New All-Time High: Is a $128K Blow-Off Top Next?Bitcoin's Meteoric Ascent: New All-Time Highs Fuel $128K "Blow-Off Top" Predictions Amidst Unprecedented Adoption
The digital gold rush of the 21st century is reaching a fever pitch. Bitcoin (BTC), the pioneering cryptocurrency, has not only shattered previous records but is now tantalizingly close to new, stratospheric all-time highs, with analysts eyeing a potential "blow-off top" as high as $128,000. This electrifying surge, which saw BTC climb to within 1.5% of new peaks as bullish sentiment decisively overcame final resistance, is underpinned by a confluence of factors: soaring institutional and retail adoption, particularly in the United States, booming ETF inflows, growing political and regulatory support, and a shifting macroeconomic landscape that increasingly favors non-traditional assets. As of May 21, 2025, Bitcoin has firmly established itself above the $109,000 mark, a testament to its resilience and burgeoning mainstream acceptance.
The recent price action has been nothing short of spectacular. Bitcoin bulls have been relentlessly "grilling sellers," pushing the price to historic milestones. On May 21, 2025, Bitcoin etched a new all-time high (ATH) above $109,000, a landmark achievement that notably placed 100% of BTC holders into profit. This surge saw Bitcoin's market capitalization briefly surpass that of e-commerce giant Amazon, a symbolic victory highlighting its growing financial clout. Specific figures around this period include a climb to a record $109,302, and another peak at a historic $109,500, demonstrating the intense buying pressure and bullish conviction in the market. Analysts are now recalibrating their upside targets, with many calling for $116,000 as the next significant milestone on the path to even loftier valuations.
This bullish momentum isn't occurring in a vacuum. It's the culmination of years of development, increasing understanding, and a series of pivotal events that have collectively propelled Bitcoin into the financial limelight.
The American Bitcoin Boom: Adoption Surpasses Gold, Institutions Dive In
One of the most compelling narratives driving Bitcoin's current rally is its explosive growth in the United States. A staggering 50 million Americans now own Bitcoin, a figure that notably surpasses the 37 million gold holders in the country. This demographic shift signifies a profound change in investment preferences, particularly among younger generations who are increasingly comfortable with digital assets. Bitcoin is no longer a niche interest for tech enthusiasts; it's becoming a recognized component of diversified investment portfolios across a broad swathe of the American population.
The institutional embrace within the US is equally, if not more, impactful. US firms now hold an astonishing 94.8% of the Bitcoin reserves held by publicly traded companies globally. This concentration underscores the confidence American corporations have in Bitcoin as a treasury reserve asset, a hedge against inflation, and a potential source of significant returns. Furthermore, the United States is solidifying its position as the global epicenter of the Bitcoin industry, with 40% of all Bitcoin companies headquartered domestically. This robust ecosystem of miners, exchanges, wallet providers, and ancillary service companies fosters innovation and provides a strong foundation for continued growth.
The advent and subsequent success of Bitcoin Exchange Traded Funds (ETFs) have been a game-changer. These regulated financial products have opened the floodgates for a new wave of capital, allowing retail and institutional investors to gain exposure to Bitcoin through traditional brokerage accounts without the complexities of direct ownership and custody. The "booming ETF inflows" are a direct contributor to the recent price surge, creating sustained buying pressure and signaling widespread market acceptance.
Macroeconomic Tailwinds and Regulatory Optimism
Beyond direct adoption, broader economic and political factors are playing a crucial role. The recent new all-time high of $109,000 was notably set just nine days after the US and China closed a 90-day trade agreement. This resolution eased economic uncertainty and market jitters that had previously weighed on global markets. In such an environment, assets perceived as hedges against traditional market volatility or fiat currency devaluation, like Bitcoin and gold, often thrive. Indeed, concurrent with Bitcoin's rise, concerns such as Japan's debt woes have contributed to gold surpassing the $3,300 mark, indicating a broader flight to alternative stores of value.
Furthermore, there's growing optimism around US regulations concerning cryptocurrencies. While the regulatory landscape is still evolving, recent pronouncements and actions suggest a move towards greater clarity and a more accommodative stance, rather than outright prohibition. This "growing political support" is crucial for long-term institutional commitment, as regulatory uncertainty has historically been a significant barrier to entry for larger, more conservative investors. The fact that Bitcoin climbed to a record of $109,302, breaching a previous high set around the time of a major political event like a presidential inauguration (specifically referenced as Trump's inauguration on Jan. 20 in a historical context for a previous ATH), often correlates with market sentiment interpreting political or regulatory shifts as favorable.
The "Bitcoin Strategic Reserve" (BSR): A Paradigm Shift for National Economies?
An intriguing, albeit more speculative, concept gaining traction is the idea of a "Bitcoin Strategic Reserve" (BSR). While not yet a formal policy in any major nation, the discussion itself highlights Bitcoin's evolving perception from a purely speculative asset to one with potential strategic geopolitical and economic importance.
A BSR would involve a nation-state, such as the United States, acquiring and holding Bitcoin as part of its national reserves, much like it currently holds gold or foreign currencies. The rationale behind such a move could be multifaceted:
1. Hedging Against Fiat Devaluation: As central banks globally continue to engage in monetary expansion, concerns about the long-term purchasing power of fiat currencies persist. Bitcoin, with its fixed supply, offers a potential hedge against this inflation.
2. Participating in a New Financial System: If Bitcoin continues its trajectory towards becoming a globally recognized store of value or even a medium of exchange for certain international transactions, holding it in reserve would position a nation to participate actively in this emerging financial infrastructure.
3. Technological Leadership: For a country like the US, which already leads in Bitcoin company headquarters and corporate holdings, establishing a BSR could further cement its leadership in the digital asset space, attracting talent and capital.
4. Economic Resilience: In a future where digital currencies play a more significant role, a BSR could offer a degree of economic resilience and autonomy, reducing reliance on traditional financial systems or the currencies of other nations.
The implications of a major economic power like the US even seriously considering, let alone implementing, a BSR would be monumental for Bitcoin's legitimacy and price. It would signal ultimate institutional acceptance and could trigger a wave of similar considerations by other nations, creating immense demand for a limited supply of BTC. While the "Bitcoin Strategic Reserve Explained and What BSR Means for the US Economy" remains a topic of forward-looking discussion, its emergence in financial discourse is a testament to how far Bitcoin has come.
The Path to $128K: Understanding the "Blow-Off Top"
With Bitcoin having decisively broken past $109,000 and upside targets of $116,000 now in common parlance, the ultimate bull-case scenario being discussed is a "blow-off top" potentially reaching $128,000 or even higher.
A "blow-off top" is a chart pattern that signifies a steep and rapid price increase in an asset, often on high volume, followed by an equally sharp reversal. It typically occurs at the end of a prolonged bull market or a parabolic advance. The psychology behind it involves:
1. Euphoria and FOMO (Fear Of Missing Out): As prices accelerate, media attention intensifies, and stories of quick riches abound. This draws in a flood of retail investors who don't want to miss out on the gains.
2. Exhaustion of Buyers: The parabolic rise eventually becomes unsustainable. The last wave of enthusiastic buyers enters at or near the peak.
3. Smart Money Distribution: Experienced traders and institutions, who may have accumulated positions much lower, begin to sell into this heightened demand, taking profits.
4. Sharp Reversal: Once buying pressure is exhausted and selling pressure mounts, the price can fall dramatically as latecomers panic-sell and stop-losses are triggered.
Predicting the exact peak of a blow-off top is notoriously difficult. However, analysts use a combination of technical analysis (chart patterns, momentum indicators, Fibonacci extensions), on-chain data (network activity, holder behavior), and market sentiment to identify potential price targets and warning signs. The $128,000 figure is likely derived from such analyses, representing a significant psychological level or a projection based on previous market cycle behavior.
Navigating the Bull Market: Indicators for Identifying a Cycle Top
While the current sentiment is overwhelmingly bullish, savvy Bitcoin traders and investors are always mindful of market cycles and the potential for corrections or trend reversals. The question, "Is Bitcoin price close to a cycle top?" is one that prudent market participants constantly evaluate. Several indicators can help traders gauge whether a market might be overheating:
1. Moving Average Convergence Divergence (MACD): This trend-following momentum indicator can show bearish divergences, where the price makes new highs, but the MACD fails to do so, signaling weakening momentum.
2. Relative Strength Index (RSI): An RSI reading above 70 is generally considered overbought, and readings above 80 or 90 in a strong bull market can signal extreme conditions, though Bitcoin can remain overbought for extended periods. Bearish divergences on the RSI are also key.
3. On-Chain Metrics (e.g., MVRV Z-Score, Puell Multiple, SOPR):
o MVRV Z-Score (Market Value to Realized Value): Compares Bitcoin's market cap to its realized cap (the price at which each coin last moved). High Z-scores indicate the market cap is significantly higher than the average cost basis, suggesting the asset is overvalued and potentially near a top.
o Puell Multiple: Looks at the supply side of Bitcoin's economy – miners and their revenue. It divides the daily issuance value of bitcoins (in USD) by the 365-day moving average of daily issuance value. High values suggest miner profitability is high compared to historical norms, which has sometimes coincided with market tops.
o Spent Output Profit Ratio (SOPR): This indicates if holders are, on average, selling in profit or loss. Values significantly above 1 suggest holders are realizing substantial profits, which can increase sell pressure. A sustained drop below 1 after a peak can signal a shift in trend.
4. Logarithmic Growth Curves: Bitcoin's long-term price action has often respected logarithmic growth channels. When the price reaches the upper band of these channels, it has historically indicated a market top.
5. Funding Rates and Open Interest in Derivatives Markets: Extremely high positive funding rates on perpetual swaps indicate that an overwhelming number of traders are long and paying a premium to maintain those positions. This can signal excessive bullishness and a crowded trade, making the market vulnerable to a long squeeze if prices reverse. High open interest can also exacerbate volatility.
While Bitcoin is currently refusing to give up on its quest to revisit $108,000 (a level now surpassed) and beyond, concerns over a trend change, though perhaps quieter amidst the euphoria, are always present in the minds of seasoned investors. These indicators provide a more objective lens through which to assess the sustainability of the current rally.
The Road Ahead: Uncharted Territory with Immense Potential
As Bitcoin forges new all-time highs, it enters uncharted territory. The confluence of unprecedented US adoption, robust institutional investment via ETFs, a more favorable regulatory outlook, and supportive macroeconomic conditions has created a potent cocktail for price appreciation. The surpassing of Amazon's market cap, even if temporary, and the fact that 100% of BTC holders are in profit, are powerful psychological milestones that can fuel further confidence.
The predictions of a $116,000 interim target and a potential $128,000 blow-off top are no longer fringe theories but are being seriously discussed by mainstream analysts. The narrative of Bitcoin as "digital gold" is gaining more traction than ever, especially as traditional safe havens like gold also see increased interest amidst global economic uncertainties like Japan's debt situation.
However, the path is unlikely to be linear. Bitcoin's inherent volatility means that sharp corrections can and will occur, even within a broader uptrend. The "concerns over a trend change" will likely grow louder as prices reach more extreme levels, and profit-taking becomes more tempting. Investors should remain vigilant, utilize the available indicators to assess market conditions, and practice sound risk management.
In conclusion, May 2025 has marked a historic period for Bitcoin. Its surge above $109,000, driven by a powerful combination of fundamental adoption and favorable market dynamics, has set the stage for potentially even more dramatic price action. Whether the ultimate peak of this cycle is $116,000, $128,000, or another figure entirely, one thing is clear: Bitcoin has firmly cemented its place in the global financial landscape, and its journey is far from over. The coming weeks and months will be closely watched by investors worldwide as the world's preeminent cryptocurrency continues to redefine the boundaries of financial assets.
________________________________________
Disclaimer: This article is for informational purposes only, based on the provided snippets, and should not be considered financial advice. Investing in Bitcoin and other cryptocurrencies is highly speculative and carries a significant risk of loss. Past performance is not indicative of future results. Always conduct your own thorough research and consult with a qualified financial advisor before making any investment decisions.
