1-BTCUSD

Bitcoin ATHBased on the chart for Bitcoin/Tether ( BINANCE:BTCUSDT ) on a 1-hour timeframe 📈, here are the complete support and resistance levels:
Support Levels: 🛡️
97,186.72
99,338.14
101,489.56
Resistance Levels: 🚧
108,062.26
109,852.81
110,193.94
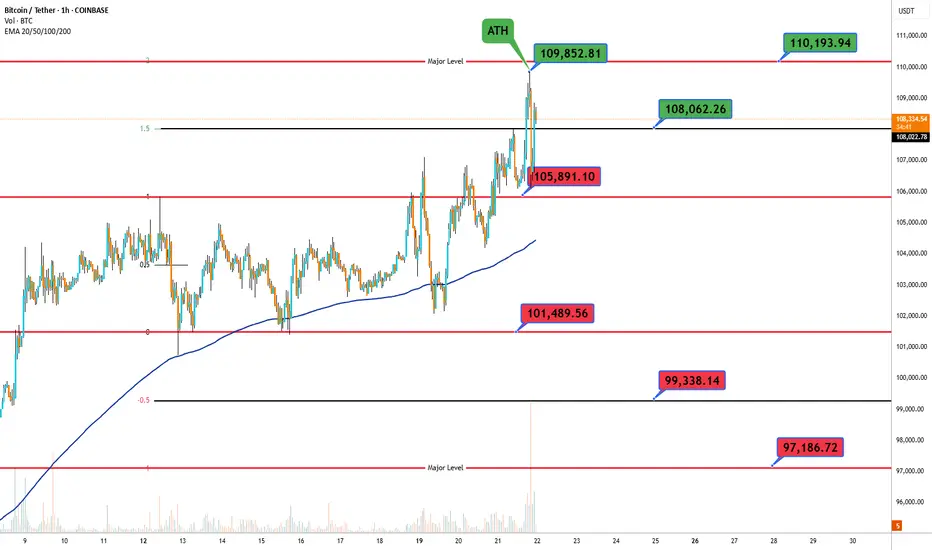
Will BTC endure and continue to reach further highs?As we can see, the BTC price has broken the previous ATH and established a new one at $ 109,886, but here we have to see that we had a slight breakout and the price immediately returned below the previous peak. At this point, we should observe whether it will positively break out from the previous peak and whether it will stay above it so that it can gather energy for a strong move towards strong resistance at $ 130,000.
However, if we see a correction, it may first go down to $ 101,500, then we can see support at $ 96,000, and then we may have a drop to around $ 87,000.
When we look at the Stoch RSI indicator, we will see that despite the current increases, the indicator remains around the middle of the range, which could potentially give room for another upward move.

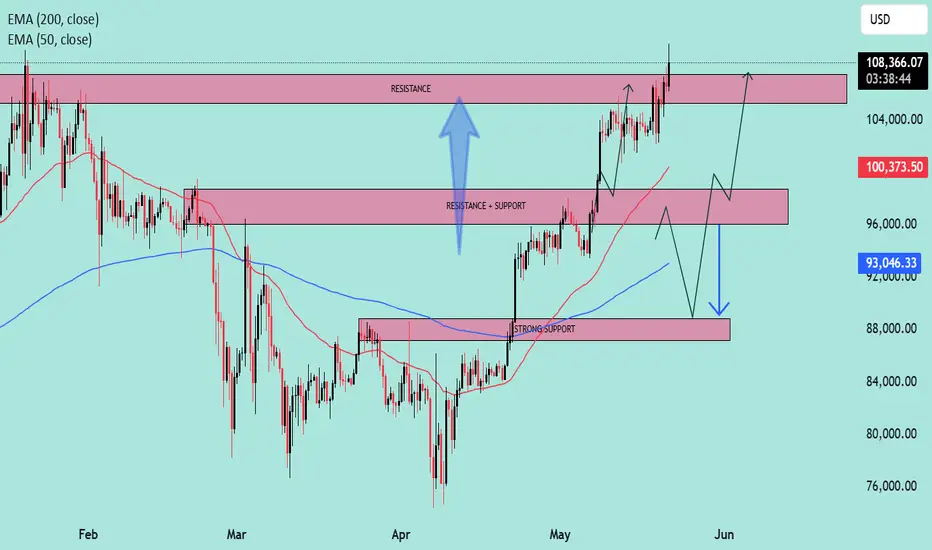
Technical Levels Respected – BTC Reaches $108K Target what next?📍 BTC Target Hit with Precision!
✅ As predicted in the previous analysis, Bitcoin has successfully tapped the $108K resistance zone — clean and technical execution!
📊 My chart spoke in advance... and the market listened.
🎯 Why miss out on these accurate forecasts?
📉 My strategies are not just random lines — they’re built on solid market structure, EMAs, and key price action zones.
📢 Let’s stay connected!
🧠 I’m committed to sharing educational content and professional trading insights to help you grow as a trader.
💡 Whether you're a beginner or seasoned trader, there’s always something new to learn with me.
📚 Join the journey — learn, trade, and win!
📩 DM or follow to get consistent updates and chart breakdowns.
🚀 Let’s trade smart, not hard!
Bitcoin (BTC/USD) Timeframe: 4-HourCurrent Price: ~$108,120
Key Chart Elements:
🔹 BOS (Break of Structure):
Multiple BOS markers indicate continuation of bullish structure from late April onward.
Recent BOS near $107,000 confirms bullish momentum is active again after a brief consolidation.
🔹 CHoCH (Change of Character):
Initial CHoCH around $104,000 signals a trend reversal from previous downtrend to bullish structure.
Later CHoCH further confirms buyers taking control.
🔹 FVG (Fair Value Gaps):
Multiple FVG zones are marked below price (between ~$93,000 to ~$106,000).
These represent areas where price moved impulsively, possibly returning to fill gaps.
The most recent FVG (between ~$107,244 and ~$105,518) acted as a support zone on the current retracement.
🔹 Fibonacci Retracement:
Price bounced off between the 0.5 and 0.618 fib levels (~$107,000–$106,387), a typical reversal zone in a strong trend.
Current Setup & Projection:
Price has broken above resistance near $108,000, suggesting a bullish continuation.
Target zone projected at $113,634, supported by structure and volume breakout.
Strong bullish momentum is visible after the BOS, and the price retest of FVG confirms smart money accumulation.
Volume Analysis:
Noticeable volume spike with the most recent bullish breakout, supporting the continuation case.
No large bearish volume indicating supply absorption—bulls remain in control.
Summary:
Bitcoin has completed a successful breakout from consolidation with bullish confirmation through BOS, FVG support, and volume spike. As long as price holds above $107,000–$106,200, the target zone around $113,634 remains highly probable.

CADCHF update!!Good day traders, I’m back with yet another update on CadChf and if I can remember well I mentioned the first time I posted this setup that this one is special because it offer us opportunities to learn and get to see if what ICT(Micheal.J) says about his concepts true or not, for me they work!!
The first setup I posted here and the second one will both be tagged in the description below just to support my ideology and how I came about this setup. On the first setup there was a large wick that i stated should be considered as a Gap and we saw price close above it to balance that gap. And you move one TF higher on your weekly there you’ll see that price has failed multiple times to balance that weekly VI, back on our daily TF we can see that price did not fully trade through that 1st.PFVG and we want to see it come back to fully trade through the gap.
Overall bias is BUYSIDE LIQUIDITY!!

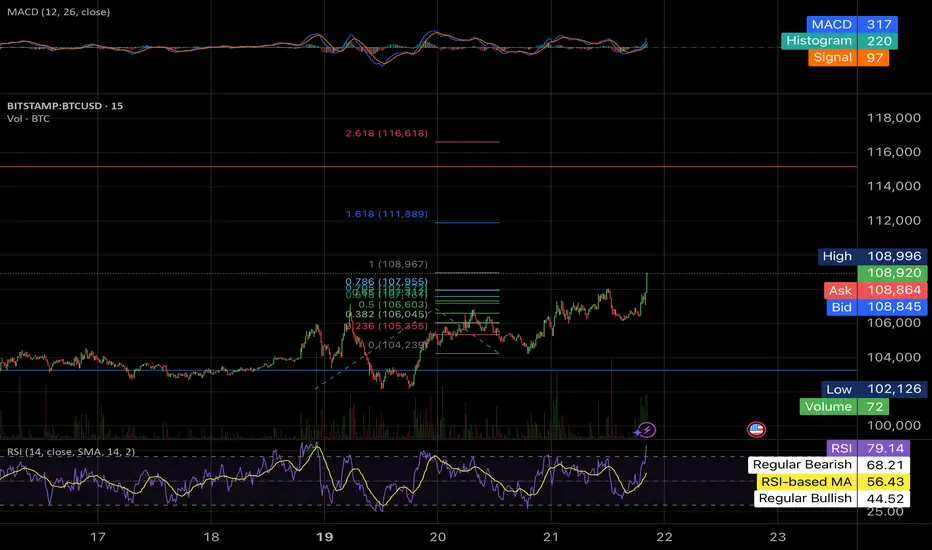
Bitcoin Reaches New All-Time HighOver the past three trading sessions, BTC has gained more than 5%, marking a new all-time high above the $109,000 zone. The current bullish bias can largely be explained by optimism surrounding cryptocurrency regulation, as the U.S. Senate debates new pro-crypto legislation. However, the strong upward momentum has started to ease gradually, and the price is beginning to consolidate near its record levels.
Steep Bullish Trend
Since April 9, BTC has maintained a strong upward trend, pushing the price back toward historical highs. So far, there has been no significant selling correction that could challenge the current bullish structure, making it the most important technical formation to monitor in the short term. However, it is worth noting that the trend has become increasingly steep, which could create room for short-term pullbacks.
RSI
The RSI line remains above the overbought zone at the 70 level, indicating that the recent buying impulse has been strong enough to unbalance market forces. This increases the likelihood of a short-term corrective move as the market seeks to reestablish equilibrium.
MACD
Despite the continued rise in price, the MACD histogram is hovering close to the zero line, which fails to confirm strong bullish momentum. This may signal that a period of neutral consolidation could continue around the current all-time highs.
Key Levels to Watch:
$106,000 per BTC: Current price barrier aligned with the historical high zone. This level could act as a resistance area, potentially triggering short-term selling corrections.
$115,000 per BTC: A psychological target and the next tentative resistance. Bullish moves approaching this level would reinforce the current upward trend.
$100,000 per BTC: A key support level, located at a previous consolidation area and a strong psychological threshold. A break below this level could put the current bullish structure at risk.
Written by Julian Pineda, CFA – Market Analyst

DUSKUSDTThis is a long-term analysis for the weekly time frame. Our guess is that the price will return from around 0.012 to 0.015 and even higher (completion of wave 4) and then complete its wave 5 at around 0.053 to 0.041.
If this happens, buying it spot is quite low-risk and we can even look at it for a long-term hold and an investment under one condition.
If this Elliott analysis is correct, the price could reclaim its new high within two years or more and even see numbers beyond it.
In terms of timing, late July and early August are a good time for the end of wave 4 and late 2025 and early 2026 are ideal times for the end of the hypothetical wave 5.

BTCUSD: Made new ATH on Genius Bill vote. 1D Golden Cross formedBitcoin just made new ATH today pas 109,500 as the U.S. Senate officially advanced the GENIUS BILL for consideration. This has turned the 1D technical outlook overbought (RSI = 75.442, MACD = 4135.600, ADX = 30.728) but as mentioned before, Bitcoin tends to thrive on such a state. On top of the very bullish fundamental news, the market just formed a 1D Golden Cross the first since the U.S. elections one (October 27th 2024). That signaled the extension of the bullish trend to +122.18%. If we apply that on the current bullish wave along with the Fibonacci retracement level, we can see that the price is insde the 0.382 - 0.5 Fib range, exactly where it was on the 2024 Golden Cross. If this plays out exactly this way, expect $165k by late July.
## If you like our free content follow our profile to get more daily ideas. ##
## Comments and likes are greatly appreciated. ##

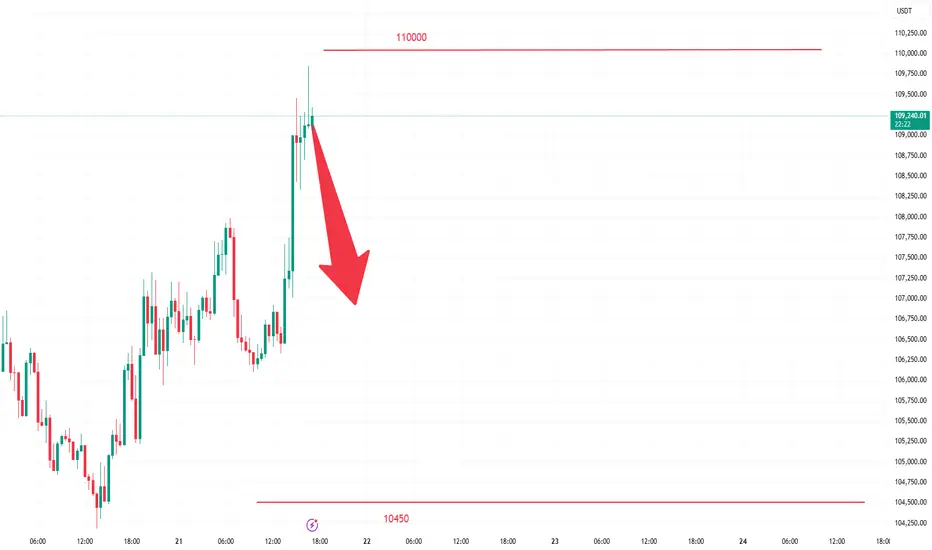
Bitcoin has put in a top and tail, the day has just begun!!!!Over the past 24 hours, Bitcoin has exhibited high volatility, with its price surging to an intraday high of $109,844.99 and dipping to a low of $105,090.90. The 24-hour trading volume reached $63.23 billion, underscoring the market's intense activity. Currently, Bitcoin's market capitalization stands at $2.16654 trillion, reinforcing its dominant position in the cryptocurrency market.
From the perspective of fund flows and market sentiment, the U.S. spot Bitcoin ETF has attracted $5.3 billion in capital inflows over the past three weeks, indicating increased institutional participation. The market's Greed Index remains at a elevated level of 76, reflecting widespread optimism among investors. However, this may also signal potential overheating risks in the market.
Technically, Bitcoin's weekly and daily charts show potential double-top patterns. If confirmed, these patterns could mark the end of the upward trend and trigger a significant correction.
In the market, there are no absolutes, and neither upward nor downward trends are set in stone. Therefore, the ability to judge the balance between market gains and losses is your key to success. Let money become our loyal servant.
Bitcoin - History Repeating, 110k Next target?Bitcoin has been ranging tightly on the 4H chart, and the recent price behavior is starting to look very familiar. When you compare the current structure with what happened in the first week of May, there are some striking similarities. Back then, BTC consolidated in a sideways channel, faked a breakout to the upside, returned into the range briefly, tapped a demand zone, and then exploded higher into a strong rally. That move laid the groundwork for a steep continuation and fresh highs.
Right now, we’re seeing a nearly identical flow: a prolonged consolidation followed by an upside breakout, a retrace into the prior range, and a precise reaction off a Fair Value Gap (FVG). These repeat structures often hint at algorithmic behavior or institutional footprints, where similar setups trigger similar outcomes.
Structural Context and Price Behavior
The May 6th move began with a candle close above the range, a retest of the lows and FVG within the previous structure, and then an impulsive breakout that never looked back. This breakout was clean, supported by high volume and conviction. Once the retest held, price surged with minimal drawdown.
Now, we’ve just completed a similar sequence. Price closed above the consolidation range, came back in, filled the imbalance (FVG), and instantly found support. It’s also worth noting that both patterns formed after multi-day compressions, which often result in aggressive expansion phases.
What strengthens this setup is that the recent FVG fill didn’t just find support, it caused an immediate reaction to the upside. That’s a key sign that demand is active in this area and institutions may have used this as a re-entry point. From a structure standpoint, as long as we’re holding above the green zone (prior range high and FVG area), the bias remains bullish.
Liquidity Dynamics and Key Zones
The green support area acts as a clear line in the sand. It represents the upper half of the previous range and the origin of the most recent displacement. As long as price stays above this level, the idea is simple: the market is still in expansion mode. The recent wick into the zone could also be viewed as a liquidity sweep, drawing in shorts or stop losses before the real move begins.
In these kinds of setups, institutions often look for “clean-up” wicks to engineer liquidity, and BTC may have just completed that phase. Now that the liquidity grab has taken place and the imbalance is mitigated, the path of least resistance is likely to be up.
Price Target and Expectations
If history repeats, BTC could be setting up for a continuation leg that pushes toward a new all-time high. The $110,000 level makes sense both technically and psychologically. It would not only be a round number magnet but also a logical target based on the range expansion from the current structure. Once the local high breaks, momentum could accelerate quickly, especially if the market gets squeezed and forced to reprice aggressively.
A clean move toward $110,000 would also align with the broader macro narrative, as BTC continues to show resilience and trend continuation despite periods of consolidation.
Conclusion
Bitcoin is potentially repeating its early-May price structure, where a breakout, retest into a key FVG, and strong bullish reaction led to new highs. We’ve just completed a similar retest and bounce, suggesting we may now be in the early stages of a fresh impulsive move. As long as price remains above the key demand zone, this setup favors continuation, with $110,000 as the next major objective. All eyes on whether the market can break above local highs and maintain bullish momentum into uncharted territory.
___________________________________
Thanks for your support!
If you found this idea helpful or learned something new, drop a like 👍 and leave a comment, I’d love to hear your thoughts! 🚀


Some Analysis For Distraction.Bitcoin is currently testing the upper boundary of an ascending channel. The key resistance level lies around 104,463, and a breakout above this level could signal further bullish continuation toward the channel top (green path).
However, if the price fails to break and hold above this resistance, a pullback scenario becomes likely (red path), potentially targeting the midline of the channel or even the lower trendline (WP area).
Let’s see how price reacts at this critical level.

SUSHI Token: A High-Potential Setup You Shouldn’t IgnoreHello everyone!
A huge opportunity has emerged on the BINANCE:SUSHIUSDT chart. I’ll break down the technical analysis for SUSHI using both the Daily and 4H timeframes , highlighting key levels and potential trade setups.
On 1D timeframe
- Price has swept the liquidity below the November 2024 low , forming an inverse Head and Shoulders pattern , which is a strong bullish reversal signal.
- Price recently broke did the May high after that retraced approximately 24% . This pullback aligned perfectly with a retest of the neckline from the inverse Head and Shoulders pattern, reinforcing its validity as a bullish setup.
On 4H timeframe
- If price breaks above $0.775 , it would serve as a confirmation of bullish momentum, suggesting a likely move toward the liquidity zone above $1.00 .
- In my opinion, if market conditions remain bullish and Bitcoin continues its upward trend, SUSHI is likely to break above the $1.00 level with ease and potentially reach the inverse Head and Shoulders target around $1.20+ .
In conclusion, SUSHI is currently showing strong bullish signals, and if the broader market gives altcoins room to run, this token has the potential to rally aggressively.
Note: SUSHI is a low-cap token with high volatility, so exercise proper risk management when trading or investing.

At ATH, blast continuation or tap and turn?If you find this information inspiring/helpful, please consider a boost and follow! Any questions or comments, please leave a comment!
🚀 Tap & Turn… or Blast?
Bitcoin is reacting well to mapped levels, maintaining structure and respecting key zones. Price action continues to print HLs and HH keeping the bulls confident, atm.
💥 Levels Still Respecting
Recent price action has shown solid reactions at prior resistance and support zones. Nothing overly aggressive, but clean enough to keep structure traders engaged.
🐂 Bulls Still in Control (for Now)
Higher lows remain intact, keeping the bullish structure alive. I did take a lower-degree short, but without a clean break of those HLs, there's no reason to call a shift yet. A break of that pattern would be the first real sign of momentum fading.
🚧 Key Watch Zone: 106K–104K
This is where things get more critical. A clean break below that zone could tilt the balance.
Trade safe, trade smart, trade clarity.

BTC USD UpdateWe’ve hit all of our targets on the BTC/USD pair, so it’s time to close today’s trades and let the markets work their magic. I hope you’ve found this trading plan helpful. With the summer trading season ahead, it will be interesting to see how both the dollar and crypto markets perform. I’ll keep you posted!

Key Levels Updated and Targets Ahead 🚀📈 BTC Bulls vs Bears – Key Levels Updated and Targets Ahead 🐂🐻
Hi everyone! The battle between bulls and bears is heating up! 🔥 After the breakout, BTC is holding strong above critical levels, and the bulls are making a convincing case for a continuation higher.
Let’s break down the key levels and probabilities based on the latest market action:
📌 Current Decision Zone:
⚔️ 102,777 – Bulls vs Bears (Critical Support/Resistance)
📊 Bullish Targets (Probability: 65%)
🎯 103,400
🎯 104,197
🎯 105,032
🎯 105,962 – Major Resistance Ahead
🏁 106,341 – Final Target Before the Big Move
🚀 Ultimate Target: 113,000
📉 Bearish Scenario (Probability: 35%)
If BTC fails to hold above 102,777, expect a drop towards:
📌 101,052
📌 99,985
🧩 Market Observations:
Multiple divergences are still present across the MACD, RSI, MOM, MFI, and Histogram, signaling potential exhaustion.
Watch for another retest of 102,777 to confirm direction before jumping in aggressively.
The probabilities favor a continued bullish run, but stay cautious – the divergences suggest volatility is far from over! Step by step, we’ll navigate this journey together. 📅
One Love,
The FXPROFESSOR 💙
Video:

BTC- crash is coming? Most likely no)In its best traditions, bitcoin in one impulse reached the monthly target 95000, which I wrote about
The probability of a correction to set a higher low in the equilibrium area of the range is increasing.
Probably in May the crypto market will have to pass the last stability test, in case of success we will get excellent opportunities for spot and speculative positions before the next cyclical growth spiral.
For now have to wait for weekly open but there are 2 options:
pump till PWH and then move on correction
slow bleeding till 0.5 or mb till 83k in worst case and then pump to ATH

At this point market successfully taped into the!Gold Market Analysis – Bullish Momentum Building
Gold has recently broken through a significant call option (CE) resistance level, signaling heightened bullish aggression among market participants. This breakout suggests that buyers are currently in control, pushing prices decisively above the CE threshold.
At this point, the market has successfully tapped into the previous swing low liquidity and appears to be forming buy-side liquidity above the current price action. With this structure, we anticipate a potential move toward the Fair Value Gap (FVG) zone marked on the chart. A clean breakout above this FVG, followed by a retest and successful hold of that level, would serve as a strong confirmation of continued bullish intent.
Should this scenario play out, our next upside targets lie in the 3320–3330 range. Traders are advised to monitor price action closely and wait for confirmation signals before making entries. Strategic decision-making is key—avoid emotional trading and prioritize high-probability setups.
Disclaimer: This analysis is for educational and informational purposes only and does not constitute financial advice. Always conduct your own research (DYOR) before making any investment decisions.

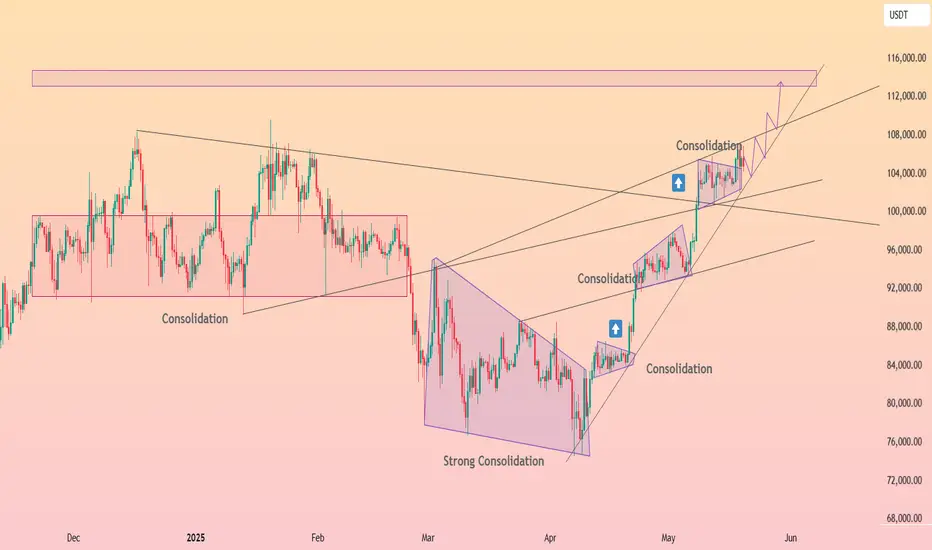
HolderStat┆BTCUSD came out from the triangleCRYPTOCAP:BTC price has advanced in neat stair-steps from March’s strong consolidation wedge, hugging an internal up-trend. The latest flag is coiling on the mid-channel near 103 k; defend it and the route toward the 113-115 k supply box stays active. A daily close below the inner rail would merely usher a glide to the outer channel near 97 k—momentum remains north-bound while that area is respected.
SPY/QQQ Plan Your Trade For 5-21 : Inside-BreakawayI've been very clear over the past few weeks that I believe the markets are poised for a rollover/topping pattern and I believe BTCUSD is showing us exactly how/when that rollover top is going to play out (June 1-June 9).
In the meantime, I believe the SPY/QQQ are entering a more volatile "early topping" formation while still in an uptrend (Bullish).
I urge traders to start watching various sectors for weakness and keeping your eyes open for any signs the market could be moving into a sideways price rotation.
I think the rollover top will be aligned with some financial event (trade/tariff/other) that will result in a broad disruption of the US/Global markets. And I believe BTCUSD will lead the move by about 4-7+ days.
Gold and Silver are starting to move higher again. That is a sure sign that traders are now more actively seeking to hedge global risks (again).
I believe this move higher in metals may continue through this week and into next week (looking for that top in the SPY/QQQ).
Follow my detailed BTCUSD video to learn why BTCUSD may continue to try to push a bit higher before topping and moving into a broad price decline.
Get some..
#trading #research #investing #tradingalgos #tradingsignals #cycles #fibonacci #elliotwave #modelingsystems #stocks #bitcoin #btcusd #cryptos #spy #gold #nq #investing #trading #spytrading #spymarket #tradingmarket #stockmarket #silver

DeGRAM | BTCUSD holding $104K📊 Technical Analysis
● BTC again defended the 104 k-104.3 k flip-zone and long-term purple trend-line, printing a fourth higher-low inside the 7-month rising channel.
● Price is coiling in a tight bullish pennant beneath April’s high; a breakout aligns with the channel ceiling and projects toward the 112.5 k supply band.
💡 Fundamental Analysis
● CME BTC-futures open-interest hit a record this week, while Glassnode shows exchange reserves at a 6-year low—evidence of both leveraged and spot accumulation supporting upside continuation.
✨ Summary
Higher-low + record OI favour longs: accumulate 104-105 k, objectives 108 k ➜ 112.5 k, risk controlled on a close below 100.6 k.
-------------------
Share your opinion in the comments and support the idea with a like. Thanks for your support!
