BTCUSD 'H4 BULLISH TREND MAKE ZONEWeak Breakout Above Resistance
The current move above the "SUPPORT ZONE" (previous resistance) appears shallow and indecisive.
Lack of strong bullish momentum or volume may indicate a false breakout, which could reverse quickly.
2. Rejection Wicks Near Key Levels
Multiple upper wicks (longer top shadows) in recent candles suggest seller presence near 106,500–107,000.
This is often an early signal of a potential price rejection.
3. Low Volume Rally
The recent price push is not supported by increasing volume, which weakens the credibility of the breakout.
A bull trap scenario could be forming, drawing longs in before price dumps below the support zone.
4. Support Zone Re-Test Could Fail
The support zone is thin and may not hold under renewed pressure.
A clean break below 105,000 would invalidate the bullish thesis and shift control to bears.
5. MACRO & SENTIMENTAL RISK
If market sentiment shifts (e.g., rate hike fears, equity market correction), Bitcoin may follow broader risk-off trends and fall toward 100,000 or even the high 90K levels.
📉 Bearish Scenario Projection:
Break below 105,000 = confirms weakness.
Next downside targets:
102,000 (bearish zone)
98,000 (prior range low)
Possibly lower toward 94,000–96,000 demand block
1-BTCUSD

Bitcoin Analysis – Can Buyers Push the Price Up to $116,000?OANDA:BTCUSD is trading within a clearly defined ascending channel, with price action consistently respecting both the upper and lower boundaries. The recent bullish momentum indicates that buyers are in control, suggesting a potential continuation.
Price has recently broken through a key resistance zone and may return to retest it. If this level holds as support, it will reinforce the bullish structure and increase the likelihood of a move toward the 116,000 target, aligning with the upper boundary of the channel.
As long as price remains above this support zone, the bullish outlook remains intact. However, a break below this level could invalidate the setup and increase the likelihood of a deeper pullback.
Remember, always confirm your setup and trade with solid risk management.
Good luck!

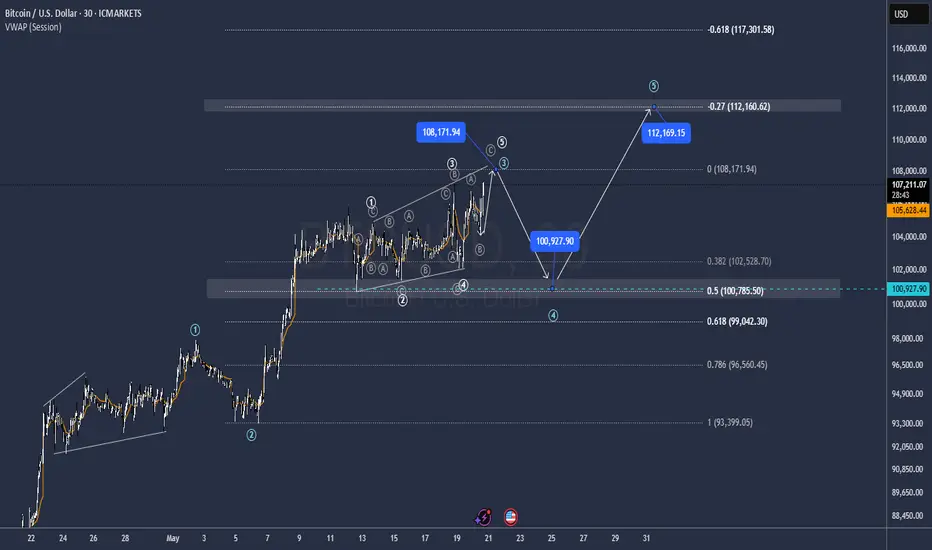
BTCUSD: 61.8% Fib + OB = Precision Long PlaySmart money traders love one thing more than anything — confluence. This BTCUSD setup hits all the marks:
📈 Structure Breakdown:
Market breaks structure to the upside ✅
Impulsive bullish leg breaks prior high ✅
Pullback into 61.8% golden zone + OB ✅
Rejection wick = perfect entry confirmation ✅
This is a high-probability continuation setup after BTC made a clear bullish BOS (Break of Structure) on the M30 timeframe.
🟦 Order Block Zone:
OB Range:
Top: ~106,989
Bottom: ~106,759
This OB was the last down candle before the big bullish impulse that broke structure. Price returned to mitigate here, then instantly rejected = Smart Money entry confirmed 🔒
🧮 Fibonacci Levels:
61.8%: Sliced right into it
70.5% – 79%: Deeper liquidity zone just below
The entry wick taps right into the sweet OB/Fib confluence zone and launches 🚀. It’s giving sniper precision with a low drawdown entry.
🎯 Trade Parameters:
Entry: ~106,759
SL: Below the OB zone
TP: 108,022 (previous high)
That’s an RRR of around 3.5–4.0x — a clean asymmetric play, just the way smart money wants it.
🔍 Confirmation Factors:
Bullish BOS on M30
Price returns to OB zone + golden ratio
Clean rejection candle with demand absorption
No internal structure break = bullish narrative still valid
🧠 Key Lesson:
“When OB meets Fibonacci, don’t ask why. Load up — the market just told you why.”
Let setups like this come to you. No chasing, no emotions. Let the algo-driven footprints guide you to the money.
📈 Missed this one? Save it for your playbook — this is how high-probability trades are built.
Drop a 💰 if you caught the same move!

BITCOIN Ultimate Cycle Zones breakdown! See when to sell!Bitcoin (BTCUSD) is extending its amazing rebound on its 1W MA50 (blue trend-line), having recovered all of the losses sustained following the U.S. - Chine Trade War. Based on this Cycle's pattern, this 1W MA50 rebound is technically the new Bullish Leg, essentially its 4th of this Cycle.
Among all this, we managed to identify another cyclical pattern, separating the Cycle in terms of Activity Zones:
Naturally its very bottom is what we call the 'Best Buy Zone' (green), where BTC's earliest and most optimal buy opportunities existed. That ranges within the 0.0 and 1.0 Fibonacci levels.
Above that it's the 'Final Buy Zone' (yellow) where in relative efficieny terms, the last long-term buy opportunities existed. That Zone consists of the 1.0 and 2.0 Fibonacci levels.
Third in line is the 'First TP Zone' (orange) where long-term investors who seek lower risk, can start taking profit on their positions. The range on that is the 2.0 - 3.0 Fibonacci levels.
Lastly it's the 'Fina TP Zone' (red) where obviously it is the last opportunity (and with the greatest return but also elevated risk) to take profits before the Cycle prices its Top. This consists of the 3.0 - 4.0 Fibonacci range.
As you may have noticed, each Zone has a .618 interval (highlighted in blue). Zone 1 has the 0.618 Fib, Zone 2 the 1.618 Fib, Zone 3 the 2.618 Fib and one 4 the 3.618 Fib. This is where (so far) the price has made a first consolidation - correction after the start of the new Bullish Leg and before it gets completed at the top Fib. The last such consolidation was from mid December 2024 to late January 2025 and as you see those tend to be significant marks.
This model shows that the current Bullish Leg should prepare us for the Final TP Zone and its first stop is the 3.0 Fib at $135k. This is the bottom of the Final TP Zone and the first region that long-term investors should consider taking profits. The key 3.618 Fib extension is at $210k and in our opinion is the absolute max level we should look to sell all positions as chronologically Cycle wise the trend falls there towards the end of the year, which is where all Cycles topped. A 4.0 Fib test is highly unlikely to take place within this Cycle, unless macroeconomic fundamentals (extreme adoption and/or monetary intervention) kick in and that sits at $280k.
But what do you think? Do you agree with this Zones break-down and if yes are you considering taking profits at 135000? Feel free to let us know in the comments section below!
-------------------------------------------------------------------------------
** Please LIKE 👍, FOLLOW ✅, SHARE 🙌 and COMMENT ✍ if you enjoy this idea! Also share your ideas and charts in the comments section below! This is best way to keep it relevant, support us, keep the content here free and allow the idea to reach as many people as possible. **
-------------------------------------------------------------------------------
💸💸💸💸💸💸
👇 👇 👇 👇 👇 👇


Bitcoin H1 | Falling toward a swing-low supportBitcoin (BTC/USD) could fall towards a swing-low support and potentially bounce off this level to climb higher.
Buy entry is at 104,426.50 which is a swing-low support that aligns with the 23.6% Fibonacci retracement.
Stop loss is at 101,900.00 which is a level that lies underneath a multi-swing-low support and the 38.2% Fibonacci retracement.
Take profit is at 107,783.00 which is a swing-high resistance.
High Risk Investment Warning
Trading Forex/CFDs on margin carries a high level of risk and may not be suitable for all investors. Leverage can work against you.
Stratos Markets Limited (tradu.com/uk):
CFDs are complex instruments and come with a high risk of losing money rapidly due to leverage. 63% of retail investor accounts lose money when trading CFDs with this provider. You should consider whether you understand how CFDs work and whether you can afford to take the high risk of losing your money.
Stratos Europe Ltd (tradu.com/eu):
CFDs are complex instruments and come with a high risk of losing money rapidly due to leverage. 63% of retail investor accounts lose money when trading CFDs with this provider. You should consider whether you understand how CFDs work and whether you can afford to take the high risk of losing your money.
Stratos Global LLC (tradu.com/en):
Losses can exceed deposits.
Please be advised that the information presented on TradingView is provided to Tradu (‘Company’, ‘we’) by a third-party provider (‘TFA Global Pte Ltd’). Please be reminded that you are solely responsible for the trading decisions on your account. There is a very high degree of risk involved in trading. Any information and/or content is intended entirely for research, educational and informational purposes only and does not constitute investment or consultation advice or investment strategy. The information is not tailored to the investment needs of any specific person and therefore does not involve a consideration of any of the investment objectives, financial situation or needs of any viewer that may receive it. Kindly also note that past performance is not a reliable indicator of future results. Actual results may differ materially from those anticipated in forward-looking or past performance statements. We assume no liability as to the accuracy or completeness of any of the information and/or content provided herein and the Company cannot be held responsible for any omission, mistake nor for any loss or damage including without limitation to any loss of profit which may arise from reliance on any information supplied by TFA Global Pte Ltd.
The speaker(s) is neither an employee, agent nor representative of Tradu and is therefore acting independently. The opinions given are their own, constitute general market commentary, and do not constitute the opinion or advice of Tradu or any form of personal or investment advice. Tradu neither endorses nor guarantees offerings of third-party speakers, nor is Tradu responsible for the content, veracity or opinions of third-party speakers, presenters or participants.

Bearish Reversal Confirmed – BTC Rising Wedge TrapBitcoin (BTCUSD) on the 1H timeframe is displaying a bearish reversal structure after failing to sustain a breakout above key resistance. The recent price action has formed a Rising Wedge Pattern, which typically precedes a downside correction, especially when formed near a key supply zone. Let’s break down the setup:
🔍 Technical Analysis Overview:
🔹 1. Rising Wedge Pattern (Bearish)
A rising wedge is visible near the top of the recent bullish impulse. This wedge is characterized by converging trendlines with higher highs and higher lows, but with diminishing momentum. It typically signals a weakening uptrend and a potential trend reversal or correction once price breaks below the lower wedge boundary.
The breakout to the downside has already begun, confirming bearish intent.
🔹 2. SR Interchange Zone
The blue zone marked in the chart represents a Support-Resistance Interchange (SR Flip). This was previously an area of consolidation and breakout, acting as a key decision zone. Price is expected to retest this zone after the wedge breakdown before continuing further down.
This creates a perfect "Break → Retest → Drop" scenario, often favored by institutional and swing traders.
🔹 3. Consolidation Structure
Before the wedge formation, Bitcoin was stuck in a prolonged consolidation phase. This type of ranging price action often accumulates orders before a breakout. Once broken, these zones serve as magnets for pullbacks or liquidity grabs, and are frequently retested.
🔹 4. Target Zone
The measured move from the rising wedge pattern points to a target near $101,617, which aligns with a previous structural low and a potential demand zone. This area could serve as the next major support level.
🎯 Trade Strategy & Setup:
Entry: After confirmation of breakdown and a clean retest of the SR zone.
Stop Loss (SL): Just above the wedge high and structural resistance (~$108,020).
Target (TP): $101,617 (downside projection based on wedge height and price structure).
📌 Risk-Reward Setup: 1:3+ possible if retest confirms.
🧠 Trader’s Insight:
This setup reflects a common smart-money behavior where price forms a bullish-looking structure (rising wedge), entices buyers, and then traps them with a swift breakdown. The SR retest provides a low-risk shorting opportunity. Patience is key — let price come to your level before entering.
🚨 Risk Note:
If BTC reclaims and holds above the $108,020 level, the bearish thesis may be invalidated. Always wait for confirmation before execution.

Bitcoin BULLFLAG on daily ( 21MAY2025 )It looks like Bitcoin has bull-flag on daily time frame and the yellow resistance line already has broken.
Now the target of this bull-flag is about $118k so far.

Bitcoin BTC Bullish Setup: Here’s What I’m Watching Next!Bitcoin (BTC) is looking incredibly strong right now on the higher timeframes 🔥. We’re seeing a clear bullish trend with consistent higher highs and higher lows, which keeps my bias firmly to the upside 🚀...
In this video, I take you through my full multi-timeframe analysis, breaking down:
- The macro bullish structure unfolding on the daily chart 🗓️
- My key levels of interest for a potential pullback entry 🎯
- What I’m watching for on the 4H and 1H charts to confirm continuation setups ⏱️
- My target zones, including recent swing highs and areas of liquidity 📍
If Bitcoin gives us a healthy retrace, I’ll be watching closely for a bullish break of structure to confirm a high-probability buy opportunity 🟢.
⚠️ Reminder: This is not financial advice — always do your own research and manage your risk appropriately. 🛡️💼

THETAUSDT: Strong Fundamentals, Bullish Technicals: What’s Next?Hello Everyone!
In this idea, I’ll break down BINANCE:THETAUSDT from both a fundamental and technical perspective. The goal is to uncover whether THETA presents a real opportunity or if it’s just another altcoin market noise.
1. Fundamental Analysis
I’m bullish on THETA not only for its technical setup but also for its strong fundamentals:
- AI Integration Advantage: THETA is carving out a niche in the AI and decentralized video infrastructure space which is a sector currently enjoying massive global attention and investment. This AI focus gives THETA a competitive edge in a rapidly evolving industry.
- Tokenomics: THETA has a maximum and circulating supply of 1 billion tokens , which is relatively no inflationary token.
- Upcoming Catalyst : EdgeCloud Beta Launch : A major catalyst is scheduled for June 25 , with the beta launch of THETA’s EdgeCloud platform. This development could generate renewed investor interest and media attention.
- Active Transparent Team : THETA’s team is known for being highly active and continuously forming strategic partnerships, which reinforces long-term credibility and ecosystem growth.
2. Technical Analysis
On Weekly timeframe
- THETA has recently made an upward move from a strong demand zone , showing clear signs of buyer interest. Notably, it didn't break below its 2023 bottom , which reinforces a bullish structure and suggests that the long-term support is holding firm.
- Additionally, the MACD is on the verge of a bullish crossover, signaling a potential shift in momentum. If confirmed.
On 4D timeframe
- THETA also bounced off a PD Array, specifically a Fair Value Gap (FVG) , which often acts as a high-probability reaction zone in ICT . Adding to the bullish confluence, it closed a previous 4-day candle with strength , confirming bullish intent and showing institutional interest may be stepping in at this level.
- THETA is currently targeting the next PD Array — a swing point around $1.08 . If price sweeps this level with strength, the next potential target lies around $1.311 , aligning with the next major liquidity zone .
On 4H timeframe
- For bullish momentum to truly build, THETA must break above the key resistance zone at $0.93 . This level has acted as a supply barrier, and a clean breakout could trigger increased buying pressure.
- On the Cumulative Volume Delta (CVD) , there's a bullish divergence forming — a strong indication that buying interest.
In conclusion, THETA/USDT is showing promising signs both technically and fundamentally. The bounce from a key demand zone, bullish divergence on CVD, and a potential MACD crossover suggest momentum may be shifting in favor of bulls. If price breaks above the $0.93 resistance , we could see a move toward $1.311 .
On the fundamental side, THETA’s involvement in the booming AI sector, capped supply, upcoming EdgeCloud beta launch (June 25), and an active development team provide strong long-term potential.
As always, manage risk wisely and monitor key levels for confirmation.

$BTC 4H Outlook – Holding the Trendline or Losing Momentum?Bitcoin just saw a strong rejection from the upper resistance zone (highlighted in red), forming a sharp wick after a quick pump.
✅ Key support has held for now, aligning with both the ascending trendline and moving average — historically zones of strong buyer interest (green circles).
⚠️ What’s next?
A 4H candle close above the resistance zone is crucial for bullish continuation.
Failure to close above = potential fakeout and downside pressure.
Eyes on the next reaction — will we see the same buying volume kick in again from support?
📌 Watch closely – confirmation will shape the next move.

EurAud update.Good day traders, I’m back with yet another update on EurAud. In the description I will tag my previous setup on EurAud to show you where we are in price and I left the drawings as they were to help you understand price more.
On Monday price opened with that same bullish flow and pushed till the low of the volume imbalance as expected but as we can see that FVG was able to hold price above. From the original setup what price did yesterday was expected Thursday or Friday the latest, so since price did not go for that 1st.PFVG on Monday and Tuesday, we can now expect price to go for that level.
If we take a closer look at that leg higher from that FVG, we have a balanced price range that we can expect price not to respect.

Btcusd possible sell analysis.This analysis is expected to play out when price break and closes below the 83,659 price on the 4H TF. For entry, wait for a second sell candle close on the 15min TF.
Kindly note that this is for educational/learning purpose only.

BITCOIN Free Signal! Sell!
Hello,Traders!
BITCOIN keep growing in a
Strong uptrend but the price
Will soon hit an an all-time-high
Price around 109,400$ which
Is also a resistance from where
We can go short with the
Take Profit of 103,900$
And the Stop Loss of 109,739$
Sell!
Comment and subscribe to help us grow!
Check out other forecasts below too!
Disclosure: I am part of Trade Nation's Influencer program and receive a monthly fee for using their TradingView charts in my analysis.

#BTC/USDT Highest Daily Close! What it Means? $117k on cards?Bitcoin Daily Update – Bulls Take the Lead
Bitcoin just recorded its highest daily close in history at $106,849.99 (Binance), surpassing the previous record of $106,143.82 set on January 21st. While the difference is minor in percentage terms, it's still a meaningful win for the bulls.
The next key level to watch is $113k to $117k, based on the Fibonacci extension target.
For confirmation, we need another solid daily candle close above the current range. The $106K resistance has already been broken, and BTC is holding above it, indicating strong bullish momentum.
To avoid getting trapped in a fakeout, consider adding the 14 EMA to your chart. As long as BTC holds above this EMA, the uptrend is likely to continue.
Once BTC's show is over, Altcoins will likely follow suit.
INVALIDATION OF THIS CHART: A close below $102k in confluence with 14EMA in Daily.
I hope this update gives you actionable insight. If it did, feel free to follow and like. Let me know your thoughts or questions in the comments, I read every one.
Thank you
#PEACE

BTC clear path to 120kSell in may and go away? My contrarian view is to long BTC through summer and go away in september. Maybe sentiment conditions would change. Lets see.
Fibo at 126k
BTC has been following this path since 2021.

Botcoin Deep Pullback and RebuyNice and Clear entries on the end of this Diagonal
After completion We should get a deep Pullback and then another Push Up
Levels in the Chart
GG
BTC/USD Eyes Breakout Analysis On Weekly Time Frame.Bitcoin (BTC/USD) Weekly Chart Analysis
After facing a long term resistance at 70,000$ which was significant barrier for Bitcoin in the past, breakout occurred recently, indicating a strong bullish signal and a shift in market structure.
BTC is currently trading around $103,025, facing a new resistance zone.
as the fundamental shows that it may break the resistance again after scalping and we may see the bitcoin at the 120,000$.
But the technical analysis indicates that we may see a retest her to validating the zone now as support.
After the breakout, BTC faced selling pressure around the $105,000–$110,000 range, creating a new resistance zone.
If the resistance is not breached, there is the possibility of a rejection occurring which may result in a retracement down to $79,902, which would be a 28.72% drop.
And i think From there if the resistance isn’t broken out of, then it’s most likely a rejection comes and we can expect a fall back to $79,902 which is a 28.72% retracement.
A breakout above the current resistance could trigger a 46% rally towards the $120,409 target.
This would continue the bullish trend post-breakout, supported by momentum and volume.
we will stay focused here and wait for the breakout of the resistance.

Btc short analysis successfully target reached. Trust on my analysis target 🎯 reached successfully
1000+pips profit booked
Enrty at 83800
Tp at 82300

GOLD is showing the $300k way to BITCOINBitcoin / BTCUSD is currently on a strong rebound on its 1week MA50.
It's 1week chart looks identical to Gold's 1month chart. Both are Cup and Handle patterns and Bitcoin lags behind.
Gold has already made its final parabolic rally and nearly touched its 2.0 Fibonacci extension.
This shows that BTC's potential is extremely big, eyeing (if symmetry plays out to the end) $300000.
Follow us, like the idea and leave a comment below!!

BTCUSD: Going for the decisive breakout that opens path to 155,0Bitcoin is almost overbought on its 1D technical outlook (RSI = 69.391, MACD = 3884.400, ADX = 20.801), which during rallies is the starting condition that fuels bullish breakouts and continuations. Such a breakout is about to take place right now as the price is on the LH trendline coming from the ATH. As this chart shows, once Bitcoin breaks over a LH trendline on this Cycle, it has always delivered (much) more upside. Assuming we are currently on the 0.5 Fibonacci level of that breakout, the pattern gives a TP = 155,000.
## If you like our free content follow our profile to get more daily ideas. ##
## Comments and likes are greatly appreciated. ##

Bitcoin - All time highs will come next!Bitcoin - CRYPTO:BTCUSD - prepares a significant move:
(click chart above to see the in depth analysis👆🏻)
Over the past couple of months, we basically only saw sideways price action on Bitcoin. However, this does not mean, that Bitcoin is now slowing down; actually the opposite is true and Bitcoin is setting up for a major move higher. New all time highs will come very soon.
Levels to watch: $100.000
Keep your long term vision!
Philip (BasicTrading)

BTC Volatility Range Shifts Upward: Focus on Shorting The volatility range is moving upward, rising from 101,500–105,000 to 104,000–107,000 📈. It’s advisable to focus on shorting at higher levels ⏬. Currently, BTC is still in a range-bound fluctuation—just control your trade position sizes properly, and there won’t be any major issues essentially 😊!
⚡⚡⚡ BTCUSD ⚡⚡⚡
🚀 Sell@107000 - 106000
🚀 TP 104500 - 103500
👇Accurate signals are updated every day 📈 If you encounter any problems during trading, these signals can serve as your reliable guide 🧭 Feel free to refer to them! I sincerely hope they'll be of great help to you 👇
