BTC - Short term playsAnalysis of today's BTC trend:
• Daily timeframe: Closed with a small bearish candle yesterday, showing a single bearish-bullish pattern. The price is consolidating at high levels, failing to sustain the breakout after news-driven highs, indicating a short-term range-bound oscillation.
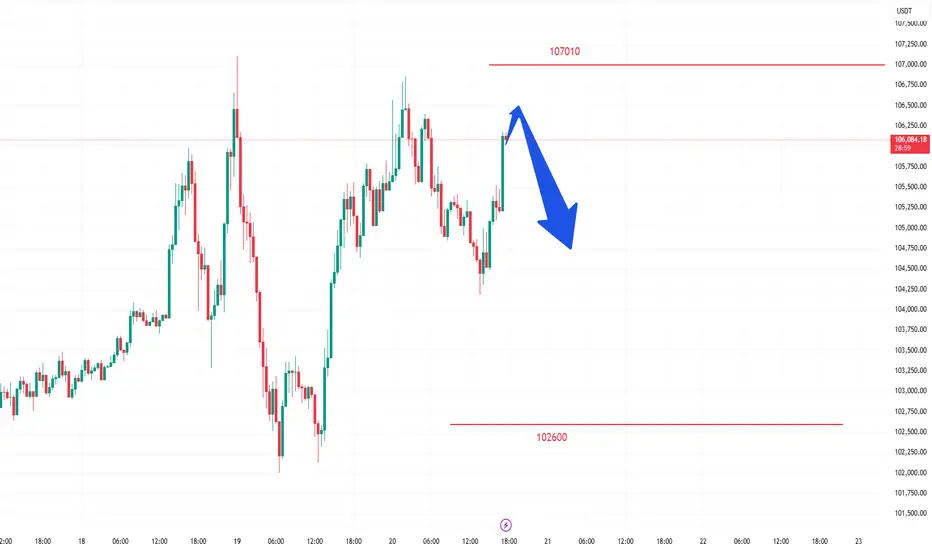
• Hourly chart: The resistance at the high of 107,000 area (double top resistance), and the support at the low of 102,000 area (double bottom support), with an obvious range-bound pattern.
Short-term contract trading strategy:
1. Short position: Short at 105,800, stop loss at 106,300, target at 104,500.
2. Long position: Long at 104,500, stop loss at 104,000, target at 106,000.
In the market, there are no absolutes, and neither upward nor downward trends are set in stone. Therefore, the ability to judge the balance between market gains and losses is your key to success. Let money become our loyal servant.
1-BTCUSD
Golden Cross? You are late! Here’s How to Get In Early.📉 “Golden Cross? No Thanks. Here’s How to Get In Early.”
By FXProfessor
Video here:
Everyone’s hyped about the Golden Cross again...
📰 “Bullish Signal!”
📈 “50 SMA crossed the 200!”
🎉 “Party time!”
Let me stop you right there.
If you’re waiting for that cross to go long —
You’re not late.
You’re definitely late.
The Golden Cross is a lagging indication.
It’s the afterparty. The smart money already had the drinks and left.
🔍 Here's the deal:
✅ Golden Cross forms after the move
✅ Price is usually already up double digits
✅ Sometimes it triggers right before a top
✅ Even EMAs (which I prefer) are still confirmation tools
✅ The real edge? Structure. Trendlines. Pressure zones.
📊 What I use instead:
-Custom EMAs that react faster
-My signature parallelogram method for early pressure
-Focus on trendlines and structure
-Above all — logic, not hype
- Fundamentals first!
For example, while the Golden Cross just printed, I was already watching $74,394 and $79,000.
Why? Because pressure builds before indicators react.
That's where the best entries live.
So next time someone posts
“Golden Cross confirmed!” 😏 Just smile and remember:
By the time the cross lights up, I’m already halfway to the next target.
Use EMAs if you like. But structure comes first.
That’s where the party starts.
One Love,
The FXProfessor 🧠📈
Disclosure: I am happy to be part of the Trade Nation's Influencer program and receive a monthly fee for using their TradingView charts in my analysis.

#BTC/USDT#BTC
The price is moving within a descending channel on the 1-hour frame, adhering well to it, and is on its way to breaking it strongly upwards and retesting it.
We are seeing a rebound from the lower boundary of the descending channel, which is support at 104090.
We have a downtrend on the RSI indicator that is about to break and retest, supporting the upward trend.
We are looking for stability above the 100 moving average.
Entry price: 104619
First target: 105128
Second target: 106128
Third target: 107091

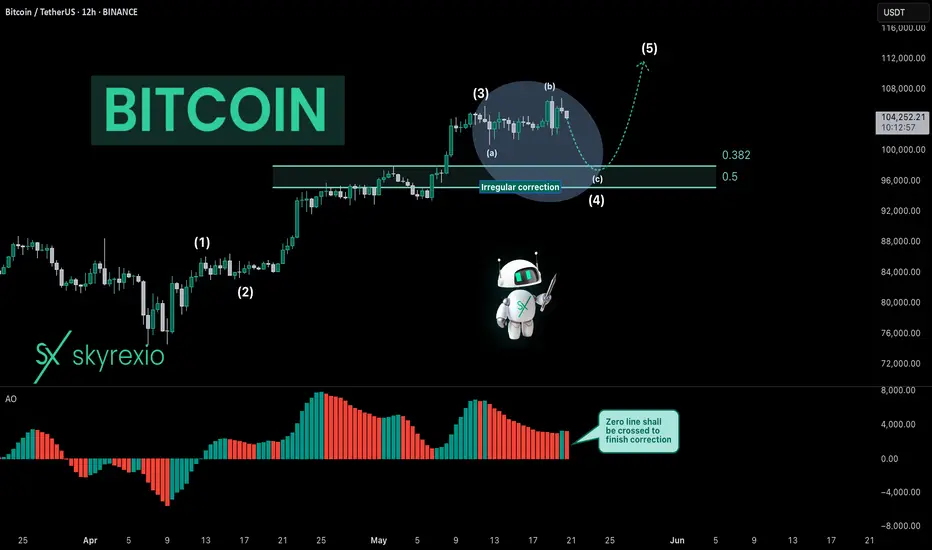
Bitcoin Is Printing Irregular CorrectionHello, Skyrexians!
Despite the negative comments that BINANCE:BTCUSDT will pump instead of my bearish prediction and Saylor's Bitcoin purchases I am going to follow my scenario - nothing has changed. Based on my experience price now is printing the most difficult shape of correction - irregular ABC.
In recent analysis I explained why we shall use now 12 hours time frame. On this time frame Awesome Oscillator shall cross zero line to finish correction. Target for irregular correction usually at 0.38 Fibonacci at $97.5k, but also can touch $95k with the wick.
Best regards,
Ivan Skyrexio
___________________________________________________________
Please, boost this article and subscribe our page if you like analysis!
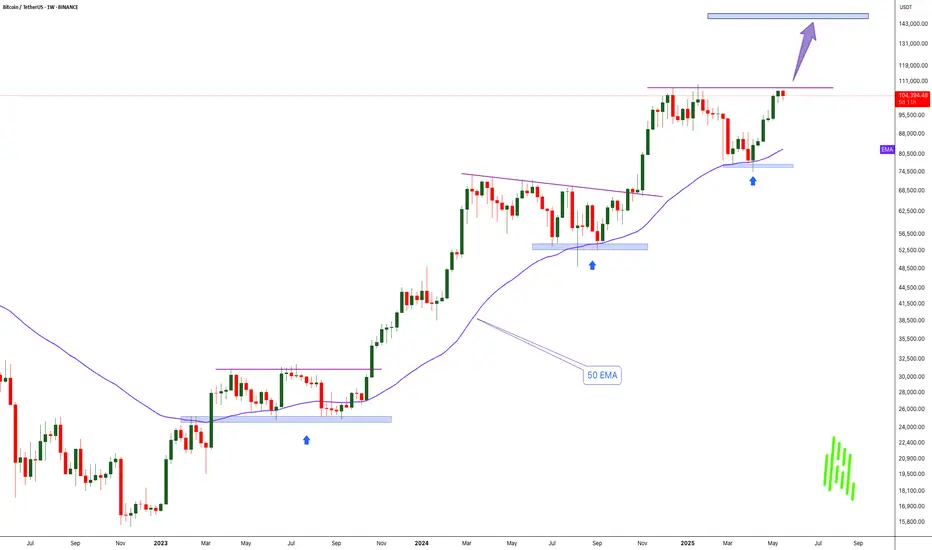
History Repeats: Bitcoin Bounces from Weekly 50 EMA-$150K Next!!MARKETSCOM:BITCOIN continues to show exceptional strength and bullish momentum. If we look back at the charts from 2023 and 2024, a clear pattern emerges — every time BINANCE:BTCUSDT touched the 50 EMA on the weekly chart, it led to a significant rally and eventually new all-time highs. That same setup seems to be unfolding again right now.
Recently, COINBASE:BTCUSD tested the 50 EMA around the $75,000 level and has since bounced strongly. The price has reclaimed the $100,000 mark and is now challenging previous all-time high resistance. Historically, after a successful bounce from this key moving average, Bitcoin hasn’t just recovered — it’s exploded to new highs.
Based on this repeating pattern, our current cycle target is set at $150,000. A clean breakout above the current resistance zone could be the catalyst that propels BYBIT:BTCUSDT Bitcoin into uncharted territory once again. The structure remains bullish, momentum is building, and the trend clearly favors the upside.
This is a classic “Buy and HODL” moment. The technicals are aligning, the market psychology is shifting, and all signs point toward a continued bull run. Buckle up — it looks like we’re in for another legendary Bitcoin rally.
Bitcoin Rally Stalls Below Resistance as Uptrend Faces Key TestBitcoin (BTC/USD) remains in an aggressive uptrend but is showing early signs of hesitation near a major resistance level:
Trendline Intact (for now): Price is still riding an ascending trendline, but today's bearish candle hints at momentum cooling.
Resistance at 108,500: This level has capped multiple rallies; rejection here could signal a short-term top.
MACD Losing Momentum: Though still above zero, MACD histogram is flattening, hinting at a possible fade in bullish momentum.
RSI Near Overbought: RSI is hovering just under 70, not yet divergent but worth monitoring for reversal signals.
Watch for Break or Bounce: A close below the rising trendline (~103,500) could trigger a deeper pullback toward the 50-day SMA near 90,000. Conversely, a breakout above 108,500 could unlock fresh upside toward prior highs.
Price action in the next 2–3 days will be crucial to determine whether bulls maintain control or profit-taking accelerates.
-MW

SPY/QQQ Plan Your Trade For 5-20 : Harami-InsideToday's pattern suggests the SPY/QQQ will stay somewhat FLAT in trading.
In this video, I go over the SPY/QQQ, Gold/Silver, and BTCUSD.
What I find interesting in today's video is the setup in BTCUSD - being very similar to the peak in late 2021 before the double-top in Bitcoin.
If my analysis is correct, we are moving into a type of final speculative phase (bullish) that will quickly transition into a type of breakdown move in the US/Global markets.
Gold should do very well once this move sets up and begins to drive the Risk/Hedge trade.
In the meantime, sit back and wait for this speculative move to phase out (top).
Get some.
#trading #research #investing #tradingalgos #tradingsignals #cycles #fibonacci #elliotwave #modelingsystems #stocks #bitcoin #btcusd #cryptos #spy #gold #nq #investing #trading #spytrading #spymarket #tradingmarket #stockmarket #silver

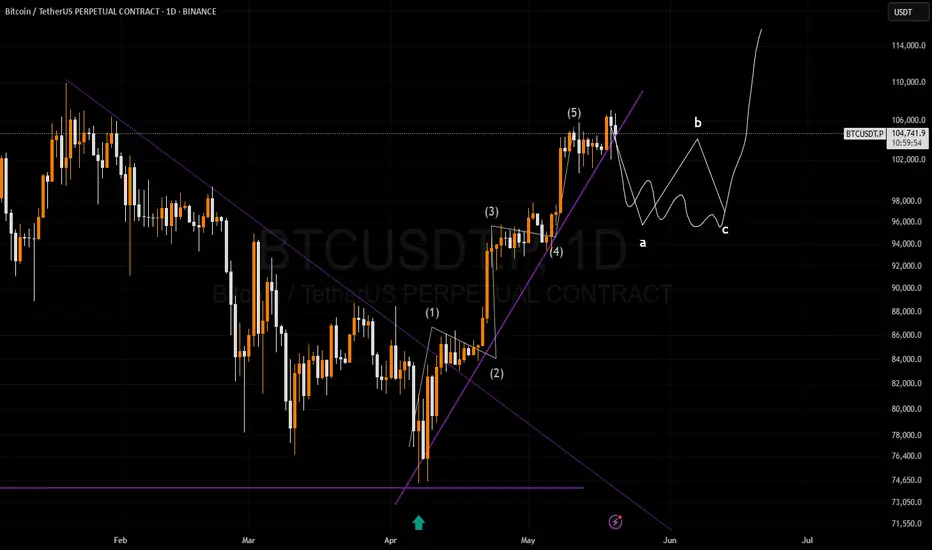
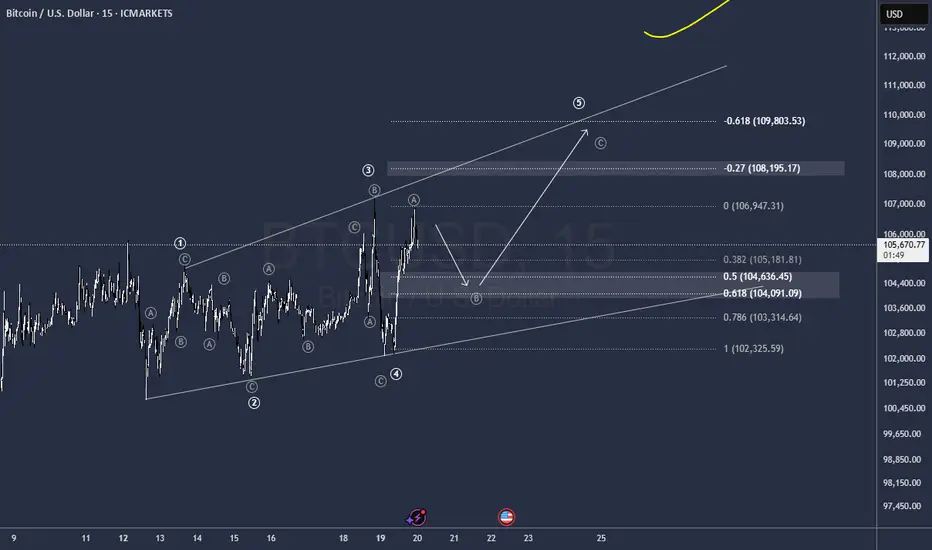
BTC new elliot ideaIf the trendline breaks, according to Elliott Wave theory, we might see an ABC correction form, and after completing wave 1, the market could rise again.
waiting for ATH BTC, the inevitable will come💎 Update Plan BTC (May 20)
Notable news about BTC:
After briefly surging to 107k, Bitcoin (BTC) has retreated into consolidation, hovering within the familiar 102k–105k range that has defined the past 10 days. Market focus remains fixated on the 109.5k level and the potential for fresh all-time highs.
Mounting concerns over U.S. fiscal stability have bolstered BTC’s recovery to 105k, following Moody’s decision to downgrade the U.S. sovereign credit rating—making it the third major agency to do so. The downgrade, which cut the rating from Aaa to Aa1, highlights growing risks associated with U.S. government debt, now exceeding $36 trillion, and casts doubt on the long-held perception of U.S. Treasuries as the ultimate safe-haven asset.
Adding to fiscal worries, former President Trump’s proposed “big and beautiful” tax legislation—if passed—could further inflate the national debt. The bill, recently advanced by a congressional committee, has sparked fears of significantly widening the federal deficit, with estimates projecting trillions in additional debt over the coming decade. While the White House maintains that the bill will spur growth without increasing the deficit, rising long-term borrowing costs suggest markets remain unconvinced.
Technical analysis angle
The question that investors most interested now is when BTC will have 120k?
Looking at TF H4 will see the repetition of the trend (accumulating => increase)
In the coming time, pay attention to 107k and 110k obstacles, these will be two milestones before the price reaches 120k
Canh Long around the 103k price in the near future
🔥BTC 4H is currently in the adjustment phase, this time will cause a lot of traders, Future - Margin to lose money, this beat will last until 21-22/5
==> Comments for trend reference. Wishing investors successfully trading

Bitcoin Short Setup –Supply Zone Rejection Trade Plan (1H Chart)(BTC/USD – Technical Setup)
🔵 Trend Setup:
⬆️ Resistance Line – Price is struggling to break above this level.
⬇️ Support Line – Price bounced several times here before breaking down.
🟢 EMA 70 – Currently around 104,435.9, acting as dynamic support/resistance.
📍 Key Levels:
🔴 Stop Loss Zone:
107,488.4 to 107,402.4
(🚨 Strong resistance, limit losses!)
🟡 Entry Point:
106,026.8
(🟨 Inside the Supply Zone – Ideal for Sell)
🟦 Supply Zone:
106,026.8 to 107,402.4
(⚠️ High selling pressure expected here!)
🔵 Break of Structure (BOS):
Price broke below the rising support line
(📉 Bearish confirmation!)
🎯 Target Point:
99,000.0
(💰 Take Profit Target!)
🔻 Trade Idea:
SELL at 106,026.8
🛑 Stop Loss: 107,488.4
✅ Target: 99,000.0
Risk-Reward looks solid.
This is a short setup expecting a drop after a retest of the supply zone.

XAU/USD...1H CHART PATTERN. GOLD (XAU/USD) long position:
🟡 Trade Setup
Buy Entry: 3234
Target: 3350
Stop Loss: (Not provided – see notes below)
🎯 Trade Summary
Metric Value
Entry Price 3234
Target Price 3350
Profit Target +116 points
Stop Loss ❓ (TBD)
Risk/Reward ❓ (depends on SL)
📊 Scenario Analysis (Assuming Some Example Stop Losses):
Stop Loss Risk (Points) R:R Ratio (vs 116pt target)
3184 50 pts ~2.3:1
3150 84 pts ~1.38:1
3100 134 pts ~0.87:1
Let me know your preferred stop loss, and I’ll finalize the table for you.
✅ Key Technical Notes:
Target 3350 is a logical round number and likely a psychological resistance. Confirm if there’s confluence (e.g., fib level, prior high, moving average).
If this is a swing trade, ideal to set SL below a recent swing low or strong support level.
Consider partial profit-taking or trailing stop if momentum is strong before 3350.

BTCUSDT - Smart InvestorPrudent investors observing BTCUSDT will note the blue box I have highlighted on the chart. It represents a particular juncture where, should market action decisively penetrate this upper boundary, we might witness a rather substantial appreciation in price.
Retracement will be lower but I think risk reward is very good.
Now, the intelligent investor does not engage in speculation based merely on lines drawn on a chart. However, such zones can serve as important indicators of potential shifts in market sentiment and buying pressure. A breakout above this defined area, accompanied by what one might term 'significant volume' a confirmation of genuine interest and not mere fleeting enthusiasm would suggest a possible continuation of an upward trend.
It is crucial, of course, to await confirmation. A breach of this resistance level that is not sustained, a 'false breakout' as some call it, can be a trap for the unwary. Therefore, diligent observation of subsequent price action, particularly on shorter timeframes, is warranted. A successful retest of the broken resistance as a new level of support would lend further credence to the bullish thesis.
One should also consider the underlying fundamentals, to the extent that such a nascent asset class allows. However, in the realm of technical analysis, these zones of potential breakout offer a visual representation of where supply may be overcome by demand.
Therefore, should BTCUSDT indeed break through this blue box with conviction, it would suggest a potential for a robust upward movement. But remember, the intelligent approach is one of caution and confirmation, not impulsive action. We observe, we analyze, and we act only when the evidence supports a calculated move.

May 19 Bitcoin Bybit chart analysisHello
It's a Bitcoinguide.
If you have a "follower"
You can receive comment notifications on real-time travel routes and major sections.
If my analysis is helpful,
Please would like one booster button at the bottom.
This is the Nasdaq 30-minute chart.
There is no separate indicator announcement today.
The 12-hour chart MACD dead cross is in progress.
The blue finger is short->long or if it goes down right away,
the purple finger is a long waiting strategy.
Since the morning, the blind decline has been in progress,
and the short-term pattern is broken.
The bottom section is about 6+12 sections,
and it is today's major support line.
I applied it to Bitcoin as it is.
This is the Bitcoin 30-minute chart.
It is being adjusted strongly as it is coupled with Nasdaq.
Based on Tether dominance,
If the current low is broken,
It is a position where it can be pushed strongly.
* When the red finger moves,
It is a one-way long position strategy.
1. 102,192.1 USD long position entry section / stop loss price when the green support line is broken
2. 104,866.1 USD long position 1st target -> Top 2nd target
The 1st section of the purple finger at the top
Is the best short position entry section of the day.
If it does not touch, it will fall vertically,
So if it goes down right away without touching the 1st section
It can be pushed to the bottom -> 2.
The danger signal has passed, but the problem is when it couples with Nasdaq.
The 2nd section at the very bottom is the 12+ daily support section,
and will be today's major support line.
Last week, many people pressed the booster,
so I'm leaving it as a public post today as well.
Up to this point, I ask that you use my analysis for reference and use only,
and I hope that you operate safely with principle trading and loss cuts.
Thank you.

BTC/USD Bearish Setup – Trendline Retest Before the Fall?🔍 Technical Breakdown – BTC/USD 3H Timeframe
Bitcoin is displaying a textbook Double Top pattern formation on the 3-hour chart, signaling a potential bearish reversal after a strong bullish run. This classic pattern suggests buyer exhaustion and sets the stage for a downward move. Let's break down the analysis:
🧠 Pattern Insight: Double Top Reversal
A Double Top is one of the most reliable trend reversal patterns, especially when it forms after a sustained uptrend — just like we're seeing here.
Top 1 and Top 2 both formed inside a strong Resistance Zone between $106,500 and $107,000, showing repeated rejection from buyers to push price higher.
The formation of lower highs and long wicks near Top 2 further reinforce the weakening bullish momentum.
💥 Neckline Breakdown & Bearish Trigger
The Neckline, aligned with a horizontal Support Zone (~$103,300–$103,800), was decisively broken, confirming the pattern.
This breakdown acts as the trigger for bearish entries, and we are now in the "Retest Phase", where price often pulls back to the neckline or a nearby trendline before continuing lower.
📐 Trendline Confluence – Retest Opportunity
A short-term descending trendline drawn from Top 2 intersects near the neckline zone.
Price is now approaching this confluence area, offering a potential high-probability short entry if bearish price action confirms (e.g., a rejection candle like a bearish engulfing or pin bar).
🎯 Price Targets & Trade Setup
Parameter Value
📍 Entry On bearish confirmation near neckline/trendline retest (~$105,300)
❌ Stop Loss (SL) Above recent swing high / Top 2 (~$107,100)
🎯 Target ~$97,126 (based on measured move from top to neckline projection)
⚖️ Risk:Reward Approx. 1:3 or better (depending on entry timing)
Measured Target Calculation:
Height from neckline to peak (~$107,000 - $103,500 = $3,500)
Target = Neckline break - height = ~$103,500 - $3,500 = $97,000–$97,100
🔥 Market Context & Psychological Edge
This chart structure reflects a shift in market sentiment. What was once strong bullish momentum is now hesitating — with buyers failing to make higher highs and sellers stepping in aggressively. The double top is not just a pattern, it's a narrative of exhaustion and reversal.
“Let price confirm your bias. Don't just predict; react to structure and behavior.”
Being patient and letting the retest play out is crucial. Don’t rush in early — let the market give you a clean signal. This is where technical discipline pays off.
⚠️ Risk Management Notes
Crypto markets are highly volatile — avoid oversized positions.
A failed double top can lead to a bullish continuation, so SL discipline is key.
Wait for confirmation — candlestick patterns, momentum shifts, or bearish volume spikes can add confidence.
📌 Summary
✅ Pattern: Double Top
✅ Confirmation: Neckline Break
🔄 Current Phase: Retesting Neckline/Trendline
📉 Bias: Bearish
🎯 Target: ~$97,100
❗ SL: Above Top 2
💬 What do you think? Are we headed to GETTEX:97K or is this just a fakeout? Drop your thoughts below and don’t forget to like and follow for more trade setups!

BITCOIN This Cycle's peak zone is $150k - $200k.Bitcoin (BTCUSD) is extending its gains week after week since the April 07 bottom on the 1W MA50, which as we've analyzed extensively its a new Higher Low launchpad for the new (current) Bullish Leg, the way it's been consistently doing on the Higher Lows trend-line since the start of this Bull Cycle.
It's in fact the very same Higher Lows trend-line it had during both previous Cycles, which ended up peaking on the Logarithmic Growth Curve's (LGC) top 2 zones (red), breaking also above the 2 SD above band (orange) of the Mayer Multiple Bands (MMB).
This time the price has 'only' broken above the 1 SD MMB (grey), while having breached into just the lower pink LGC zone. This highlights the theory of Diminishing Returns but at the same time also shows the strong upside potential of the market while subject to these conditions.
So assuming it won't hit by the end of this Cycle the 2 SD MMB nor the top 2 zones of the LGC, the bad case scenario seems to be topping the lower pink LGC zone and the good case scenario topping the upper pink LGC zone. Those two give a profit taking range of 150 - 200k respectively and based on the Sine Waves, we should peak around October 2025.
Is that your profit taking zone as well for this Cycle? Feel free to let us know in the comments section below!
-------------------------------------------------------------------------------
** Please LIKE 👍, FOLLOW ✅, SHARE 🙌 and COMMENT ✍ if you enjoy this idea! Also share your ideas and charts in the comments section below! This is best way to keep it relevant, support us, keep the content here free and allow the idea to reach as many people as possible. **
-------------------------------------------------------------------------------
💸💸💸💸💸💸
👇 👇 👇 👇 👇 👇

BTC SCALP Tradeas long as BTC doesn't closes below the mentioned area on 1hr tf, it will bounce and hit the fresh sellers SL. Once we have a closing below the area it can take correction upto 98-97K area.

$BTC.D : Have we seen the top or a local top in the $BTC.D ? CRYPTOCAP:BTC has been a recent bull run and trying to reclaim the ATH of 107K USD. Currently firmly above 100K the Crypto currency looks very bullish in the near to medium term. But what we have seen is an the CRYPTOCAP:BTC.D chart is having an initial hiccup in this later part of the cycle. For the first time in the last few quarters there has been a back to back 2 weeks where CRYPTOCAP:BTC.D has 2 red candles. CRYPTOCAP:BTC.D reached it local peak of 65.3% which we have closely predicated in this blog space many weeks ago. We said the target for CRYPTOCAP:BTC.D for this cycle is 66%. We came close to 66% and since then we are seeing weakness in the CRYPTOCAP:BTC.D chart.
Now the question comes was that the top in CRYPTOCAP:BTC.D chart ? My take is that this is a local top. We might see some weakness in CRYPTOCAP:BTC.D in the upcoming weeks. Then we will again bounce back to break above the 66% decisively before this cycle comes to an end.
Verdict : CRYPTOCAP:BTC.D achieved a local top. Cycle top taget remains above 66%. Long term bullish on $BTCUSD.

Bitcoin Hourly Analysis (2H)Given Bitcoin's rapid movement near previous highs, along with quick pump-and-dump action and liquidity grabs, it's expected that the liquidity pool below the price will be swept, collecting orders from the green zone, and then price may reverse back to the upside.
A 4-Hour candle closing below the invalidation level will invalidate this analysis.
For risk management, please don't forget stop loss and capital management
Comment if you have any questions
Thank You

That's where the $BTC 2017 vibes are felt!As we mentioned before, the current cycle that Bitcoin is in is exact

Well pk, Ending Diagonal, still the move is upUnpredictable Ending Diagonal But it is still up
Buy levels 104.600 / 104.100
Take Profits Levels 108.100 / 109.800
Can BTC touch 110k today?Well if it closes 107.1k then stances change, as of now, 102.5k is what it looks delicious as per chart drawn ~~ Thank you!!

Go go BOME!!📢Price action is quite good. now standing on the yellow support line. potential to go to the white line resistance target, supported by divergence and small double bottom. I think this is a good time to take a long position📈.
⚠️Be careful if the price breakdowns the yellow line support because the market will reverse 📉and selling pressure is high.

Trade Idea: BTCUSD (SELL STOP)BTCUSD Trade Setup Analysis
FUSIONMARKETS:BTCUSD
1. Trend Analysis
- Price Action: BTC is in a strong uptrend, with recent highs near **105,819.00**.
- RSI (14): 72.88** (approaching overbought, but no divergence yet).
- MACD: Bullish but showing potential slowing momentum (histogram decreasing).
- **Key Levels:**
- Support: 82,447.57 (previous resistance turned support).
- Resistance: 105,819.00 (current high).
2. Entry Precision
- Price Action: Recent rejection from **108,104.70** (lower high) with a drop to **104,834.80**.
- RSI (14): 58.39 (neutral, slight bearish bias).
- MACD: Bearish crossover (249.955 → 241.911).
- **Key Levels:**
- Resistance:108,104.70 (recent high).
- Support: 104,834.80 (immediate level).
3. Confluence
- Price Action: Downtrend in shorter timeframe, with price below **106,237.30**.
- RSI (14): 50.6 (neutral, leaning bearish).
- MACD: Positive but weakening (41.156).
- **Key Levels**:
- Resistance: 106,237.30 (recent high).
- Support: 102,928.15 (next key level).
---
**Trade Idea: Short-Term Bearish Pullback**
Entry:
- Short near 105,820.00 (daily resistance confluence with 15M rejection).
Stop Loss (SL):
- 106,300.00 (above recent 3M high)
Take Profit (TP):
- TP1: 104,834.80 (15M support, 1:2 RRR).
- TP2: 102,928.15 (3M support, 1:4 RRR). (IDEAL)
