$108K BTC ATH in Sight Despite ETF & Moody's HeadwindsBitcoin's Turbulent Ascent: Charting a Course Through Volatility, Institutional Embrace, and the $108,000 Horizon Amid Shifting Economic Sands
The world of cryptocurrency is once again fixated on its undisputed leader, Bitcoin (BTC). The digital behemoth is currently navigating a period of intense market activity, marked by dramatic price swings, a nuanced evolution in institutional engagement, and a striking resilience in the face of macroeconomic tremors. As Bitcoin flirts with the $102,900 threshold and repeatedly tests the crucial $104,000 psychological barrier, the air is thick with anticipation. Market analysts and enthusiasts alike are closely watching for a potential surge that could propel Bitcoin beyond its previous all-time high (ATH) to an ambitious $108,000 within the current month. This intricate dance unfolds against a complex global backdrop: a recent downgrade of US debt by Moody's, significant and strategic Bitcoin accumulation by institutional players like Japan's Metaplanet, and observable shifts in the open interest of Bitcoin Exchange Traded Funds (ETFs).
The narrative for Bitcoin in May 2025 is one of inherent strength and heightened expectation. While a recent, sharp pullback from the $107,000 mark was widely attributed to investors capitalizing on recent gains—a classic profit-taking maneuver—rather than a panicked reaction to Moody's revised outlook on US debt, the digital asset staged a swift and impressive recovery, climbing back towards the $105,000 level. This rapid rebound underscores a complex interplay of market forces, investor sentiment, and perhaps a growing perception of Bitcoin as an asset with unique characteristics. This resilience, buttressed by robust underlying network fundamentals and an increasingly confident institutional presence, paints a compelling and multifaceted picture of Bitcoin's current trajectory and its potential future.
Navigating Price Swings: Profit-Taking, Market Maturity, and a Dismissal of Moody's Downgrade
Bitcoin's recent price journey has been nothing short of a rollercoaster, a testament to its well-documented volatility. However, these fluctuations also hint at a market that is gradually maturing in its response to external economic shocks. The digital currency experienced a notable dip, with some initial commentary linking it to a broader "risk-off" sentiment ostensibly triggered by Moody's downgrade of US sovereign debt. Indeed, Moody's Investors Service adjusted the U.S. government's long-term issuer and senior unsecured ratings from the pristine AAA to Aa1. The agency cited mounting concerns over the nation's escalating debt burden and the sustainability of its interest payments, a move that traditionally sends ripples of caution through global financial markets, often prompting investors to reduce exposure to assets perceived as higher risk.
However, the narrative surrounding Bitcoin's reaction quickly evolved. The sharp sell-off from its recent high near $107,000 was predominantly identified by market observers as a consequence of profit-taking. Investors who had benefited from the preceding upward trend chose to realize their gains, a standard market dynamic in any asset class. This distinction is critically important. It suggests that the selling pressure was primarily an internal market mechanism within the cryptocurrency space itself, rather than a direct, sustained erosion of confidence directly attributable to the US debt downgrade.
In a remarkable display of this independent strength, Bitcoin demonstrated a robust recovery, rallying back towards the $105,000 mark. This price action was widely interpreted as Bitcoin effectively "ignoring" or "shrugging off" the downgrade's potential long-term implications for its own valuation. Some market analysts posit that this behavior lends further credence to Bitcoin's burgeoning role as a potential hedge against instability in traditional financial systems and a perceived decline in the long-term purchasing power of fiat currencies. While Bitcoin's price did exhibit a corrective phase around the time of the downgrade announcement, its capacity to swiftly regain lost ground suggests that the market may have either already factored in such macroeconomic developments or, more significantly, views Bitcoin's fundamental, long-term value proposition as increasingly detached from traditional economic indicators. The market's reaction, characterized by an initial dip followed by a spirited recovery, highlights Bitcoin's complex and evolving relationship with macroeconomic news. It behaves at times like a risk asset, sensitive to global liquidity and investor sentiment, and at other times, it exhibits characteristics of a safe-haven asset, sought after during periods of uncertainty.
The Alluring Prospect of a New Zenith: Is $108,000 Bitcoin's Next Landmark?
Amidst this characteristic volatility, a palpable undercurrent of optimism pervades the Bitcoin market. Strong suggestions and analytical forecasts point towards the possibility that Bitcoin could not only retest but decisively surpass its previous all-time high, potentially charting a course towards $108,000, and perhaps even higher, within the current month. Technical analyses, which scrutinize historical price patterns and market statistics to predict future movements, lend support to this bullish outlook. Some chartists and forecasters have identified take-profit targets for bullish positions clustering around the $109,158.98 region.
Currently, Bitcoin's price appears to be in a consolidation phase, hovering around the $102,957 mark after a retreat from a local peak of $107,115. Market participants are intensely focused on key resistance levels. The zone between $105,000 and $108,700 is viewed as a particularly critical hurdle. A decisive daily trading session closing above the $108,700 level could act as a powerful catalyst, potentially triggering a fresh wave of buying interest and propelling Bitcoin towards the $110,000 milestone. Should this momentum be sustained, a further ascent to $115,000 by the end of May is considered a plausible scenario by optimistic analysts.
This bullish sentiment is further amplified by what some market commentators describe as Bitcoin's "volatile liquidity run." This phenomenon, characterized by rapid shifts in market liquidity and price, is believed by some analysts to be capable of paving the way for new record highs. The market has recently observed unusual trading patterns, such as CME (Chicago Mercantile Exchange) Bitcoin futures contracts leading volatile price action, even during weekend trading sessions when traditional markets are closed. This indicates a dynamic and continually evolving market structure, increasingly influenced by institutional-grade trading venues.
Historically, Bitcoin's price has demonstrated a notable correlation with global liquidity conditions, particularly metrics like the M2 money supply. Expansions in M2, representing a broader measure of money in circulation, have often coincided with upward trends in Bitcoin's price. While current expansions in M2 could theoretically provide a tailwind for Bitcoin, the future trajectory of global liquidity is somewhat clouded by persistent inflation concerns and mixed signals from various economic sectors. Nevertheless, the potent combination of strong technical chart patterns, the potential for favorable liquidity conditions, and a resilient underlying market sentiment keeps the prospect of a new all-time high firmly within the realm of possibility. Analysts are keenly eyeing the $108,000 mark as a significant psychological and technical target. A convincing breakout above this level could potentially unleash further euphoric momentum, drawing in more retail and institutional capital.
The Institutional Equation: ETF Open Interest Moderates, While Metaplanet Intensifies Accumulation
The role and behavior of institutional investors continue to be a pivotal factor shaping Bitcoin's market dynamics and its journey towards mainstream acceptance. Recently, a noteworthy development was observed in the Bitcoin ETF space: open interest saw a 5% dip, settling at approximately $29.47 billion. This occurred even as Bitcoin itself maintained its price position near the $102,900 level. This decline in open interest, which represents the total number of outstanding derivative contracts that have not been settled, coupled with a discernible slowdown in weekly inflows into Bitcoin ETFs (which were reported as the lowest in a month, at $603.74 million for the period of May 12-16), suggests a degree of caution or perhaps a phase of consolidation among ETF investors. This follows a period of particularly heightened activity and significant inflows earlier in the year, often associated with the launch and growing popularity of spot Bitcoin ETFs in major markets. The relatively rangebound trading of Bitcoin, oscillating primarily between $102,711 and $104,971 during this period, likely contributed to this softer, more measured demand for ETF exposure.
However, it would be premature to interpret this dip in ETF open interest as a signal of a broader or sustained institutional retreat from Bitcoin. Activity in the derivatives markets, for instance, paints a more nuanced, and in some aspects, more bullish picture. Strong demand for call options, which give buyers the right but not the obligation to buy Bitcoin at a specific price in the future, indicates that a segment of sophisticated traders is actively positioning for an upward price movement, with some targeting levels around $110,000. In futures markets, when open interest rises in tandem with price, it typically signals that new capital is entering the market, reinforcing the strength and conviction behind the prevailing trend.
Contrasting sharply with the moderation observed in ETF flows is the aggressive and strategic accumulation of Bitcoin by corporate entities, most notably exemplified by Metaplanet. The Japanese investment firm recently captured headlines with its announcement of an additional purchase of 1,004 Bitcoin. This transaction marked its second-largest single acquisition of the cryptocurrency to date. This significant purchase, valued at approximately $104.3 million at the time of execution, increased Metaplanet's total Bitcoin holdings to an impressive 7,800 BTC. This substantial stash is currently worth over $800 million, fluctuating slightly with market prices but generally estimated between $806 million and $807 million. The company disclosed that its average acquisition price for this latest tranche of Bitcoin was around 15.13 million Japanese yen per BTC. Crucially, its overall average cost per BTC for its entire holdings now stands at approximately $91,340.
Metaplanet's Bitcoin strategy is notably ambitious and long-term in its orientation. The company has publicly stated its goals of accumulating 10,000 BTC by the end of 2025 and has even hinted at a more audacious long-term vision of potentially holding up to 1% of the total global Bitcoin supply. This proactive accumulation positions Metaplanet as a significant corporate holder of Bitcoin, particularly prominent within the Asian financial landscape. Its approach has drawn frequent comparisons to that of Strategy (formerly MicroStrategy), the US-based software intelligence firm renowned for its pioneering and substantial investments in Bitcoin as a primary treasury reserve asset.
Such large-scale corporate buying, as demonstrated by Metaplanet and Strategy, can exert considerable upward pressure on Bitcoin's price. By acquiring and holding substantial amounts of BTC, these corporations effectively reduce the freely circulating supply available on exchanges, a phenomenon sometimes referred to as exerting deflationary pressure, especially when corporate and even governmental buying activity is rapid and sustained. Metaplanet's actions, alongside those of other forward-thinking firms, underscore a growing and significant trend: the diversification of corporate treasuries into digital assets. These companies increasingly view Bitcoin not just as a speculative investment, but as a strategic reserve asset, a potential hedge against inflation, and a safeguard against the perceived long-term devaluation of fiat currencies. This movement has seen a notable surge in Bitcoin holdings by businesses globally, particularly since early 2024, signaling a paradigm shift in how corporations manage their financial reserves.
The Bedrock of Bitcoin: Network Health, Hashrate Resilience, and Expanding Mining Margins
Beneath the often-turbulent surface of price charts and the ebb and flow of institutional capital, the fundamental health and security of the Bitcoin network itself remain remarkably robust. Investment banking giant JPMorgan recently reported that the Bitcoin Network Hashrate experienced a slight but discernible rise in the first two weeks of May. The average hashrate during this period was noted at 88.5 Exahashes per second (EH/s), representing a 2% increase. Other data sources from the blockchain analytics community corroborate this trend, showing the daily hashrate reaching even higher levels, such as 831 EH/s as of May 1, 2025, and even peaking at an impressive 921 EH/s earlier in the month. This represents a significant increase from the lows observed in 2024. As of May 15, 2025, the Bitcoin Network Hash Rate was recorded at approximately 864.51 million Terahashes per second (TH/s), which translates to 864.51 EH/s. This continued upward trajectory in computational power dedicated to the network, even in the aftermath of events like the Bitcoin halving (which reduces the block rewards issued to miners), underscores the sustained confidence of miners and contributes directly to the network's formidable security.
Adding to this positive picture, mining gross margins have reportedly expanded sequentially throughout this month. JPMorgan's analysis highlighted that as Bitcoin prices appreciated, miners' gross profit margins also saw a month-on-month expansion, leading to improved economic conditions for those securing the network. The "hash price," a key metric representing daily mining profitability per unit of hash power, increased by a notable 13% when compared to April's figures. In the initial two weeks of May, Bitcoin miners earned approximately $50,100 per EH/s in daily block rewards (which includes both newly minted bitcoins and transaction fees). This figure is up 13% from the previous month and shows a 3% year-on-year increase.
This financial viability is crucial. It enables miners to continue investing in their operations, which includes covering significant energy costs and upgrading their specialized hardware (ASICs – Application-Specific Integrated Circuits) to maintain competitiveness and efficiency. Leading manufacturers like Bitmain and MicroBT continuously release more powerful and energy-efficient mining rigs. The fact that the market price of Bitcoin remains significantly higher than the average cost of mining (estimated by some analyses to be around $36,800 per BTC) indicates a healthy profit margin for the mining industry. These margins are comparable to those observed at the beginning of previous bull market cycles, further fueling optimism. Some publicly traded mining companies, such as LM Funding, have reported improved mining margins in the first quarter of 2025, successfully navigating the headwinds from the halving event through operational improvements, strategic power agreements, and in some cases, diversifying revenue streams like power sales.
The Untamed Frontier: Meme Coins and the Curious Case of BTC Bull Token
While Bitcoin, with its established infrastructure and growing institutional adoption, commands the lion's share of attention, the broader cryptocurrency ecosystem continues to be a fertile ground for innovation, experimentation, and, undeniably, speculation. One of the most prominent and often controversial manifestations of this is the meme coin phenomenon. The question frequently arises in online forums and social media: "Best Meme Coins like BTC Bull Token Next to Surge?" This highlights the persistent allure of these unique digital assets. Meme coins are a distinct category of cryptocurrency, typically inspired by internet memes, viral social media trends, or popular culture. Their value is often driven less by intrinsic utility or underlying technological fundamentals and more by community-generated hype, speculative fervor, and the quest for rapid, exponential gains. They are infamous for their extreme volatility, capable of producing meteoric price surges in short periods, but also equally susceptible to precipitous crashes.
BTC Bull Token ($BTCBULL) has emerged as a specific example within this highly speculative niche. It has positioned itself with taglines such as "the official Bitcoin meme coin" or a "Bitcoin-themed meme coin," attempting to leverage the brand recognition and market sentiment surrounding Bitcoin itself. Its core proposition appears to be a system of rewarding its token holders with airdrops of actual Bitcoin when BTC achieves certain predetermined price milestones (for example, when Bitcoin's price reaches $150,000, $200,000, or $250,000). Additionally, the $BTCBULL project outlines plans for token burn events. These events, designed to reduce the total supply of $BTCBULL tokens and theoretically increase their scarcity, are scheduled to occur when Bitcoin's price increases by specific increments (e.g., for every $25,000 increase in Bitcoin's price, starting from a baseline of $125,000). Currently reported to be in its presale phase, projects like BTC Bull Token aim to capitalize on the excitement and upward momentum of Bitcoin bull runs. They offer a highly leveraged, and therefore highly risky, way for speculators to potentially profit from Bitcoin's upside.
It is absolutely paramount for anyone considering an allocation to meme coins, including those linked thematically to Bitcoin, to thoroughly understand their inherent high-risk, high-reward nature. These assets are, by definition, intensely speculative. They are highly susceptible to "pump-and-dump" schemes, where coordinated buying inflates the price before early holders sell off en masse, leaving later entrants with significant losses. Many meme coins lack long-term viability, tangible real-world applications, or robust development teams. While the allure of quick, life-changing profits can be undeniably strong, the potential for substantial, and often total, financial loss is equally, if not more, significant. Prudent investors should approach such tokens with extreme caution, treating them more as a form of high-stakes gambling or digital entertainment rather than a serious, fundamentally-driven investment. Due diligence, a clear understanding of the risks involved, and an investment amount one can afford to lose are critical prerequisites.
Weaving the Narrative: A Complex Market of Resilience, Adoption, and Speculation
The current Bitcoin landscape presents a fascinating and intricate tapestry, woven from a diverse array of threads. We observe robust price action that seems increasingly capable of defying or quickly recovering from macroeconomic pressures. There is the steady, albeit sometimes fluctuating, march of institutional adoption, most visibly through products like ETFs, but also through direct corporate treasury allocations. The unwavering commitment of long-term corporate accumulators, exemplified by firms like Metaplanet, adds another layer of demand. Underpinning all of this is the fundamental strength and security of the Bitcoin network itself, evidenced by a healthy and growing hashrate. And, at the periphery, the ever-present speculative fervor of the broader crypto market, including the volatile world of meme coins, adds a unique dynamism.
Bitcoin's demonstrated ability to absorb the potential shock of Moody's US debt downgrade and subsequently rally, largely on the back of what was identified as profit-taking, indicates a growing maturity within its market. It also suggests a potential decoupling, at least to some extent, from the reflexive reactions often seen in traditional financial markets. The widespread anticipation of a new all-time high, with many eyes fixed on the $108,000 level, is not without foundation. It is supported by various technical indicators, ongoing positive sentiment, and a persistent bullish undercurrent in many segments of the market. However, the recent dip in ETF open interest serves as a salient reminder that institutional sentiment can be subject to caution and re-evaluation, and that the path to higher valuations is rarely a straight, uninterrupted line. Corrections and consolidations are natural parts of any market cycle.
Metaplanet's aggressive Bitcoin acquisition strategy highlights a different, perhaps more profound, facet of institutional interest. This is not just about short-term trading or exposure to a new asset class; it's about a long-term conviction in Bitcoin's potential role as a strategic treasury reserve asset. Such a trend, if it continues to grow, could have a more sustained and significant impact on Bitcoin's supply and demand dynamics over time. Meanwhile, the healthy hashrate figures and reports of improving miner profitability provide a solid and reassuring foundation for the network's continued secure operation and the confidence of its participants.
The emergence and popularity of meme coins like BTC Bull Token, while arguably peripheral to Bitcoin's core value proposition and its aspirations as a global financial asset, reflect the undeniable speculative energy that often accompanies bull markets in the cryptocurrency space. It serves as a reminder of the diverse and sometimes bewildering ecosystem that Bitcoin anchors – an ecosystem that now ranges from highly sophisticated institutional financial products and regulated investment vehicles to community-driven, high-risk, and often ephemeral digital tokens.
Gazing Forward: A Market Poised for Potentially Defining Movements
As May 2025 continues to unfold, the Bitcoin market stands at a fascinating and potentially pivotal juncture. The confluence of technical factors, institutional behavior, network fundamentals, and macroeconomic influences creates an environment ripe for significant moves. Several key elements will be crucial to watch in the coming weeks and months:
• Price Action Around Critical Levels: Bitcoin's ability to decisively breach and, more importantly, hold above the formidable resistance zone generally identified between $105,000 and $108,700 will be a critical determinant of whether a new all-time high is imminent. A strong breakout could ignite further momentum. Conversely, key support levels, likely around the $100,000 to $102,000 range, must hold firm to maintain the prevailing bullish market structure. A break below these supports could signal a deeper correction.
• Institutional Capital Flows: Continued monitoring of inflows and outflows from Bitcoin ETFs, as well as changes in their open interest, will provide valuable insights into shorter-term institutional sentiment and positioning. Simultaneously, tracking further corporate accumulation by entities like Metaplanet and Strategy will offer signals regarding long-term conviction and the adoption of Bitcoin as a treasury asset.
• Network Fundamentals and Security: Sustained growth in the Bitcoin network hashrate and the maintenance of healthy mining economics will continue to be vital indicators of the network's underlying security, resilience, and the confidence of its core infrastructure providers. Any significant disruptions or negative trends in these areas could impact broader market sentiment.
• Overarching Macroeconomic Influences: While Bitcoin has demonstrated a degree of resilience, the broader global economic climate will undoubtedly continue to exert an influence. Key factors to watch include inflation data from major economies, monetary policy decisions from central banks (particularly regarding interest rates and quantitative easing/tightening), and any further significant developments related to sovereign debt or geopolitical stability.
• Prevailing Market Sentiment: The overall sentiment within the cryptocurrency market, as reflected in metrics like the Fear & Greed Index, activity in derivatives markets (funding rates, options skew), and the tenor of discussions within online communities and social media, will play a significant role in driving short-term price movements. This is particularly true for the more speculative assets within the ecosystem.
Bitcoin's journey is one of perpetual evolution, marked by innovation, debate, and dramatic market cycles. The current phase, characterized by ambitious price targets, strategic institutional chess moves, and robust underlying network strength, suggests that the coming weeks and months could be particularly pivotal in shaping its longer-term narrative. While the prospect of Bitcoin surpassing the $108,000 mark and venturing into new price discovery territory excites many participants, the asset's inherent volatility, coupled with the speculative elements that froth at the market's fringes, necessitates a balanced and informed perspective. Acknowledging both the transformative potential of Bitcoin and the considerable risks that continue to define its unique position in the global financial landscape remains essential for anyone navigating this dynamic space.
1-BTCUSD

BTCUSD buy opportunity next target The zone near 105,998 has been marked as a key resistance. BTC has previously failed to hold above this level, leading to sharp rejections.
Without strong volume confirmation, a breakout above this level may result in another bull trap.

BTC at a Critical Crossroad – Red Channel is the Last Standhello guys! let's review what happened in btc and what could happen!
📉 1. Blue Ascending Channel Broken:
Bitcoin has decisively broken below the blue ascending channel, signaling a shift in momentum from bullish to neutral/bearish.
🟥 2. Red Channel Holding as Support (For Now):
Despite the drop, the red ascending channel is still intact and currently acting as support. Price is consolidating right at its lower boundary.
⚠️ 3. If Red Channel Breaks – Expect Strong Downward Move:
A confirmed breakdown below the red channel would likely trigger a significant bearish move, potentially pushing BTC towards the GETTEX:97K - $96K support zone and possibly lower.
🧭 Conclusion:
We’re at a decision point. If bulls fail to hold the red channel, it could open the door to deeper correction.

BTCUSDT New Analysisthis area, and based on its reaction to this zone, we can look for a buy setup. On the 15-minute timeframe, the price has a bearish order block, which could push it down toward the 4-hour support level. All the key levels and price movements are marked in the chart—you can check them.

DeGRAM | BTCUSD formed the triangle📊 Technical Analysis
● Pullback has tagged the purple mirroring-support / channel median (≈101 K) and printed a hammer inside the green “optimal-buy” box, preserving the sequence of higher lows since 25 Apr.
● Price is coiling in a bull-flag beneath the inner resistance band 104 K; a 1 h close above it activates a measured move to the red 106.9-109 K supply at the channel roof.
💡 Fundamental Analysis
● BlackRock’s IBIT added a net ≈2 900 BTC in two sessions while exchange balances hit a 3-year low (CryptoQuant), signalling renewed spot absorption.
● US 2-yr yield slipped back under 4.70 % after softer Philly-Fed survey, tempering the dollar bid and easing funding costs for crypto leverage.
✨ Summary
Buy dips 101-102 K; confirmation > 104 K targets 106.9 K → 109 K. Invalidate on a sustained break below 97.5 K.
-------------------
Share your opinion in the comments and support the idea with a like. Thanks for your support!

get in loser, we're going to 1M.gm,
before i share my in-depth analysis, i just wanted to share a piece of my mind on how i approach this market:
there are many valid trajectories constantly at play. most people only ever see one; and they get emotionally attached to it. it’s usually the one that validates their own internal bias. they follow people who align with their belief system, and they end up in an echo chamber of regurgitated information, all in the name of pride and ego.
there’s nothing wrong with that, but you won’t find any of that on my page.
when i create a projection, i’m not just drawing it out. i spend a thousand hours tuning into the vibe... i become it. temporarily, i am the trajectory, which allows me to speak from its perspective on a deep, intuitive level. i’m not here to convince you that my idea is playing out. i’m just showing you that it’s one of many valid trajectories in this market.
this one here just happens to be my primary.
it has been for years, and it will remain my primary until we, at the very least, reach 752k.
now, that might sound mind-boggling to a lot of people, especially those still tuned into outdated belief systems or the mainstream media, which is incredibly gloomy right now.
----
what i have before you is a bullish nest that took 3 years to form;
a structure built with precision and patience,
and it's about to rip faces once the third wave explosively and unexpectedly begins.
i’ve color-coded all the waves for your convenience,
and i come to you this morning with a simple heads-up:
a monumental breakout is about to unfold.
and the harsh truth is,
you’re probably not going to be a part of it
because you got shaken out right before it began.
---
🌙
---

I expect the growth rate of bitcoin #BTCMy assumptions are based on technical analysis and other factors.
This text does not contain recommendations on financial transactions or investments.

BTC Reversal Starts Here – Smart Money Filled Up the OB! 🔄 Market Context:
Clear uptrend structure, forming higher highs
Pullback starts ➝ Lower timeframe shows bearish BOS
BTC wicks deep into bullish OB between 103,277 and 102,646
Liquidity sweep below the strong low @ 102,646 triggered ✅
Price now printing rejection from the OB zone 🚨
🧱 Key Order Block Zone:
Marked between 103,277 – 102,646 USD
Aligned with the golden zone (61.8%–70.5%)
Thick purple OB shows Smart Money’s interest 🎯
💸 Liquidity Zones:
Sell-side swept via wick under strong low
Next liquidity magnet: Buy-side Liquidity @ 107,141.59
Weak High @ 105,141.76 ➝ probable first stop 🛑
🚀 Trade Plan:
Entry: Tap and bullish rejection from OB
Stop Loss: Below strong low (102,646)
Take Profit: Partial @ 105,000 → Full @ 107,141 ✅
RRR: Estimated at 1:5+
📉 Why This Setup Rocks:
OB sits perfectly at fib retracement level
Strong low protected → Likely shift in structure next
Liquidity engineered before reversal ➝ Classic SMC recipe
📢 Pro Tip for Ninja Traders:
BTC loves to grab lows before sending price through the roof. If this 30M OB holds, higher TF (4H or 1D) could shift bullish again. This is not random—it’s engineered 📐
⚔️ Mindset Reminder:
"Patience is profit." You waited for the sweep, got OB confirmation, and now you're riding with the institutions 🧠💰

SPY/QQQ Plan Your Trade For 5-19 : Gap Breakaway In Trend ModeToday's pattern suggests the SPY/QQQ will start with an opening price GAP (downward in this case) and could continue to move into a Breakaway pattern.
Given the recent news of a US Credit Downgrade, I'm suggesting all traders prepare for what may become a period of sideways price volatility over the next 3-5+ days.
I've highlighted a potential breakdown range on the SPY/QQQ on my charts that I believe acts as a solid confirmation level related to any potential reversal/breakdown in trend.
Currently, the trend is still BULLISH. If price falls below my breakdown range (the angled rectangle on my charts) - then I believe price will have broken this upward FLAGGING trend channel and will begin to move downward - targeting lower support levels.
This is a critical time for the markets. If we fail to move higher at these levels, we have a long way to go (downward) before we attempt to find any support.
Gold and Silver appear to be attempting to break the FLAG HIGH of an Inverted Excess Phase Peak pattern. This could prompt a strong rally phase back above $3300/$33 for Gold/Silver over the next few days. Time will tell how things play out.
BTCUSD appears to be REJECTING the recent highs within a consolidation range. If this rejection continues, I see BTCUSD moving downward - trying to reach the $95k (or lower) looking for support.
Remember, we are still generally BULLISH and moving upward within the FLAGGING channel. If we do get a breakdown in price over the next few days, it will become clearly evident on the charts and we'll have to begin to change our expectations.
Right now - HEDGE.
Get Some...
#trading #research #investing #tradingalgos #tradingsignals #cycles #fibonacci #elliotwave #modelingsystems #stocks #bitcoin #btcusd #cryptos #spy #gold #nq #investing #trading #spytrading #spymarket #tradingmarket #stockmarket #silver

BTCUSD 19.05.2025 Bitcoin Navigator: BTC Update (May 2025)So the offline tournament is over, I took third place, and I just got back into work mode
In my previous publication ( link ), I outlined possible scenarios for Bitcoin’s price action, leaning towards a correction from around the $98-101k zone down to approximately $88k.
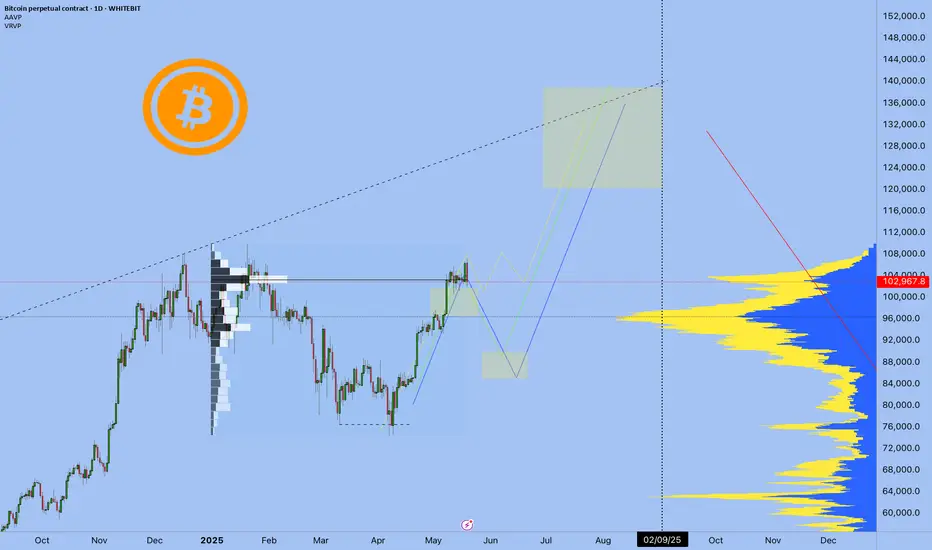
However, the current market situation demonstrates the most optimistic scenario (highlighted in yellow on the chart). At the moment, we're seeing Bitcoin consolidating within a clear range, likely preparing for an upward breakout without a significant correction. This scenario is certainly the most bullish one, yet my inherent skepticism doesn't exclude the possibility of a correction before we reach a new all-time high (ATH).
📌 Key points in the current market situation:
The main question now is not whether we'll achieve a new ATH (as this seems almost inevitable) but rather how we'll get there.
Two scenarios are on the table: a smooth upward trajectory without substantial corrections, or an initial correction followed by a strong breakout.
🔖 Profit Maximization Strategy:
Many traders are shifting their attention towards altcoins, tempted by potentially greater returns. However, it's crucial to remember that higher upside potential also means significantly higher risks (low liquidity, increased manipulation, higher volatility).
I have already chosen the tokens that I am interested in for long time
Also now a new narrative has appeared, Internet Capital Markets (ICM) tokens. If you are interested, write in the comments "interesting ICM"
Best regards EXCAVO
BTCUSDT - fractal from ATH I think this is a classic pattern now, and we are repeating the situation in the same price range that we had half a year ago when the ATX was forming. That is, we will not update the high or will do it a little bit, and after that we will go to the zone of 93 thousand plus minus and from there will be a significant reversal to 102 thousand, after that it is difficult to predict what will happen next. Either strongly down or strongly up, until then we can safely work on the fractal and after that I will give an update of the idea.

19/05/25 Weekly OutlookLast weeks high: $105,46
Last weeks low: $100,751.75
Midpoint: $103,372.10
In my weekly outlook post from last week I mentioned how there was a clear pattern of consolidation with a tight range for a week with a week of expansion that followed, and that if the pattern were to continue we would see BTC consolidate around the weekly high. The theory was proven correct on this occasion with a tight range between weekly high and the 0.75 line, as theorized with only momentary dips below the 0.75 line. Now if the pattern were to continue this week would be expansion week, but for me this time it's slightly different as BTC approaches ATH there is a massive level of resistance just above this weeks weekly high. We've seen an initial early attempt to breakout above weekly high and that attempt has so far failed quite aggressively, which leads me to believe there will be volatility this week as both bulls and bears contest this very important area of the chart.
For the bulls maintaining momentum and breaking into price discovery with acceptance above $109,000 would be incredibly, the headlines will read new ATH, FOMO kicks in and retail follows etc, we know the drill. For the bears the objective is to hold the line and reject weekly high ($106,000) at all costs and print a strong SFP and unfortunately this does seem viable with $97,000 being the target area IMO. RSI on the daily is around the overbought level, combined with key resistance level a pullback would make sense.
For me this week I want to see how ETH and other major alts react to any pullback, do they get bought up with purpose? Is the structure strong to maintain this move or is this a HTF lower high? An interesting week coming up I'm sure.
Good luck this week!

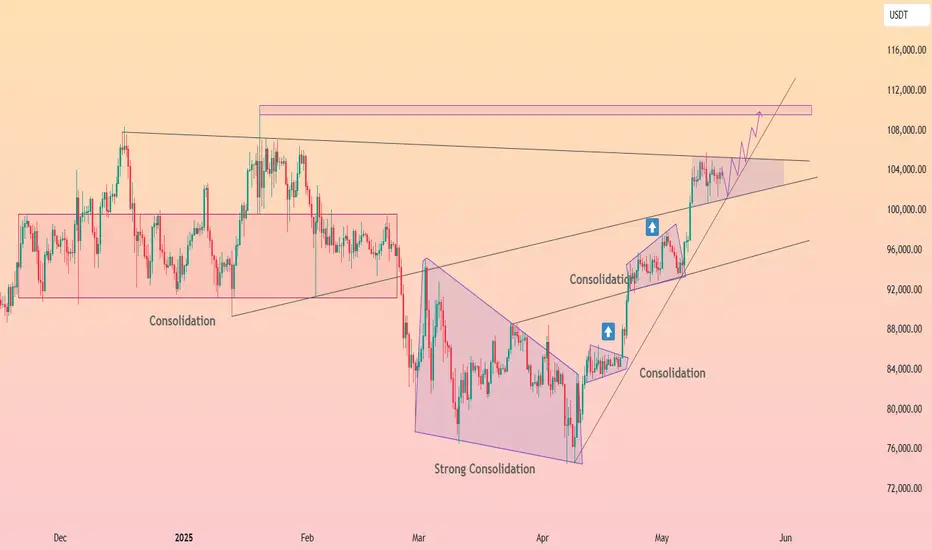
HolderStat┆BTCUSD channel grind toward 110 kCRYPTOCAP:BTC price has stair-stepped out of March’s strong consolidation triangle and is now travelling inside a neat rising channel. Each mini flag has resolved higher, with the latest squeeze holding the mid-line near 102 k. As long as that trend-line underbelly and the diagonal support from April lows remain intact, bulls retain control and can probe the 108-110 k supply zone highlighted on the chart. Only a daily close back inside the lower rail would threaten the current bullish momentum.
#BTC/USDT#BTC
The price is moving within a descending channel on the 1-hour frame, adhering well to it, and is heading for a strong breakout and retest.
We are experiencing a rebound from the lower boundary of the descending channel, which is support at 103200.
We are experiencing a downtrend on the RSI indicator, which is about to break and retest, supporting the upward trend.
We are looking for stability above the 100 moving average.
Entry price: 103708
First target: 104152
Second target: 104900
Third target: 105900

BTCUSDTHello Traders! 👋
What are your thoughts on BITCOIN?
As expected, Bitcoin entered a corrective phase after reaching a key resistance zone. This move was accompanied by a bearish divergence, indicating weakening bullish momentum.
We expect the correction to extend toward the identified support zones, where price may find demand.
If Bitcoin holds at one of these key support levels, a bullish reversal could follow, potentially leading to a new upward leg and fresh all-time highs.
Is this correction setting the stage for the next big move? Share your thoughts below!
Don’t forget to like and share your thoughts in the comments! ❤️

BTC/USDT Breakout Signals Bullish Continuationhello guys!
BTC/USDT broke out of a symmetrical triangle on the 1H chart, signaling a bullish continuation. Price is currently around $105,471, with a projected move toward the $106,500 resistance zone. A retest of the breakout area ($104,500–$104,800) is possible before further upside.

BITCOIN forming 1st 1D Golden Cross in 7 months! New ATH ahead??Bitcoin (BTCUSD) is about to form its first Golden Cross on the 1D time-frame in 7 months (since October 27 2024). This comes with the price very close to its $109k All Time High (ATH), following a relentless rebound and recovery from the Trade War correction.
Within the Bull Cycle's 2.5-year Channel Up, all 1D Golden Crosses have delivered higher prices instantly and the minimum % rise one has given before a new 1D MA50 (blue trend-line) pull-back, has been +33.11%.
This gives us an immediate Target of $135000 and is very much in line with a number of previous projections that the date show within this Target Region. Notice also how on all 3 last 1D Golden Crosses, a 1W MACD Bullish Cross precedes it. Basically that is the double confirmation of the medium-term bullish extension.
So do you think this 1D Golden Cross is such a strong buy signal and if yes, is $135k the bare minimum Target short-term? Feel free to let us know in the comments section below!
-------------------------------------------------------------------------------
** Please LIKE 👍, FOLLOW ✅, SHARE 🙌 and COMMENT ✍ if you enjoy this idea! Also share your ideas and charts in the comments section below! This is best way to keep it relevant, support us, keep the content here free and allow the idea to reach as many people as possible. **
-------------------------------------------------------------------------------
💸💸💸💸💸💸
👇 👇 👇 👇 👇 👇

Bitcoin - Bitcoin is Fighting Its Previous High!Bitcoin is above the EMA50 and EMA200 on the four-hour timeframe and is in its medium-term ascending channel. A break of the drawn trend line will lead to a decline in Bitcoin. If Bitcoin moves downwards towards the specified demand zone, we can look for its next buying opportunities. If Bitcoin is above the resistance range, it will lead to it reaching Bitcoin's previous ATH.
It should be noted that there is a possibility of heavy fluctuations and shadows due to the movement of whales in the market and observing capital management in the cryptocurrency market will be more important. If the downward trend continues, we can buy within the demand range.
According to data from Bitwise, corporate purchases of Bitcoin in 2025 have exceeded newly mined Bitcoin by a factor of 3.3. This significant gap between supply and demand signals a rising interest from institutional players in acquiring Bitcoin.
After reclaiming its $2 trillion market cap, Bitcoin surpassed Amazon and reentered the top five global financial assets. Just a week ago, Bitcoin was ranked seventh and only a month prior, it had barely managed to edge past Meta to secure a spot on the list.
The surge in Bitcoin’s price during late 2024 coincided with a sharp increase in the number of new meme coins being launched. There appears to be a clear correlation between Bitcoin’s price action and the number of tokens launched via meme coin launchpads on the Solana network.
Interestingly, this uptick in meme coin activity began in late March—well before Bitcoin’s price began its upward movement in mid-April. This early momentum is largely attributed to the rising popularity of newer launchpads such as Believe, LetsBonk, and Boop, which are now emerging as serious competitors to the well-known Pumpfun platform.

BITCOIN ROADMAP IS VERY CLEAR.I think Bitcoin will make its new ath soon. The long-term 5th uptrend wave indicates this rise.
We have 2 possibilities later on.
A correction or NEW ERA.
There is no need for very complicated analysis, I think all the waves here are quite regular.
Bitcoin has followed its own roadmap very regular.
* The purpose of my graphic drawings is purely educational.
* What i write here is not an investment advice. Please do your own research before investing in any asset.
* Never take my personal opinions as investment advice, you may lose your money.

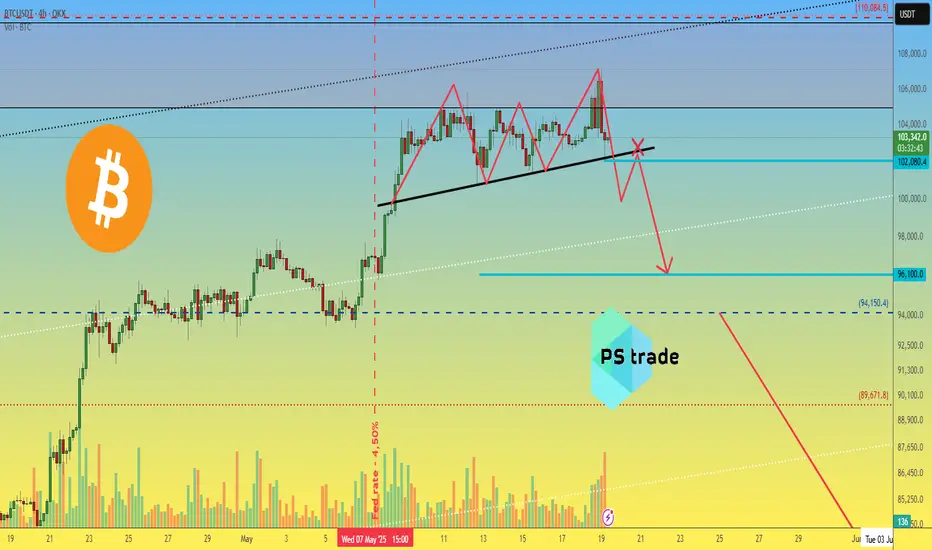
Bitcoin BTC price analysis - be careful📉 The cryptocurrency market is forming an "order" for "Red Monday".
On the OKX:BTCUSDT chart, the "Triple Top" pattern is probably nearing completion - its recognizable feature is the more lower central top and the right “powerful shake out” (for more details, if you are interested, you can read Encyclopedia of chart patterns/Thomas Bulkowski)
🆗 So, the minimum target for this pattern is $96100 per CRYPTOCAP:BTC
❗️ Confirmation of the "Triple Top" pattern development - after the base breakout and the inability to consolidate higher on the retest.
💰 Globally, we wrote our thoughts on the possible price of #Bitcoin in May/June a week earlier 👇
Also, to make trading decisions and determine which direction to trade, you need to analyze the situation on the charts:
1️⃣ BTC.D 👇
and
2️⃣ USDT.D 👇
_____________________
Did you like our analysis? Leave a comment, like, and follow to get more
May 16 Bitcoin Bybit chart analysisHello
It's a Bitcoinguide.
If you have a "follower"
You can receive comment notifications on real-time travel routes and major sections.
If my analysis is helpful,
Please would like one booster button at the bottom.
This is the Nasdaq 30-minute chart.
There is no separate indicator announcement.
We proceeded with trend following.
After entering the 1st long position at the top,
If it does not break away from the purple support line, it goes up vertically.
*We proceeded along the red finger movement path in the next wave.
We expected the movement to be a strong rise.
From the bottom breakaway, it is open up to the 2nd section,
and we will omit the detailed explanation.
This is the Bitcoin 30-minute chart.
At the bottom left, with a purple finger,
I connected the long position entry section of 101,785.1 dollars that I had on the 15th.
The current position is the 30 + 1 section,
but since the 4 and 6-hour central lines were also touched at the same time,
the mid-term pattern is broken,
and the daily chart MACD dead cross is in progress.
The strategy is one-way, one-way,
I am explaining it only on one page of the 30-minute chart,
so it is limited, but I organized it as simply as possible.
*When the blue finger moves
Two-way neutral
Short->Long or long waiting strategy
1. 104,791.3 dollars short position entry section / stop loss price when orange resistance line is broken
2. 103,241.8 dollars long position switching / stop loss price when green support line is broken
After that, long position target price in the order of Good -> Great
-> Refer to pink finger simulation.
If it touches the top once or comes down right away from the current position,
it is the final long waiting strategy at the bottom section 2.
From the bottom section breakout,
it is open from 3 -> 99345.9 dollars.
Please use my analysis article so far only for reference and use
I hope you operate safely with principle trading and stop loss price.
Thank you for your hard work this week.

Bitcoin Not Looking Good At AllSome degree of 5 waves completed yesterday and reversal signs are there. Now, this 5 waves up could be just 1st leg of larger 5th or the 5th itself since this leg was 2.6 times of leg 1. Either way, we are heading towards 90K and if this was larger 5th that got complete then it's time for "serious worry", specially if you are a HODLer.

Bitcoin H4 | Pullback support at 23.6% Fibonacci retracementBitcoin (BTC/USD) could fall towards a pullback support and potentially bounce off this level to climb higher.
Buy entry is at 99,502.40 which is a pullback support that aligns with the 23.6% Fibonacci retracement.
Stop loss is at 92,800.00 which is a level that lies underneath a multi-swing-low support and the 38.2% Fibonacci retracement.
Take profit is at 106,765.40 which is a multi-swing-high resistance.
High Risk Investment Warning
Trading Forex/CFDs on margin carries a high level of risk and may not be suitable for all investors. Leverage can work against you.
Stratos Markets Limited (tradu.com/uk):
CFDs are complex instruments and come with a high risk of losing money rapidly due to leverage. 63% of retail investor accounts lose money when trading CFDs with this provider. You should consider whether you understand how CFDs work and whether you can afford to take the high risk of losing your money.
Stratos Europe Ltd (tradu.com/eu):
CFDs are complex instruments and come with a high risk of losing money rapidly due to leverage. 63% of retail investor accounts lose money when trading CFDs with this provider. You should consider whether you understand how CFDs work and whether you can afford to take the high risk of losing your money.
Stratos Global LLC (tradu.com/en):
Losses can exceed deposits.
Please be advised that the information presented on TradingView is provided to Tradu (‘Company’, ‘we’) by a third-party provider (‘TFA Global Pte Ltd’). Please be reminded that you are solely responsible for the trading decisions on your account. There is a very high degree of risk involved in trading. Any information and/or content is intended entirely for research, educational and informational purposes only and does not constitute investment or consultation advice or investment strategy. The information is not tailored to the investment needs of any specific person and therefore does not involve a consideration of any of the investment objectives, financial situation or needs of any viewer that may receive it. Kindly also note that past performance is not a reliable indicator of future results. Actual results may differ materially from those anticipated in forward-looking or past performance statements. We assume no liability as to the accuracy or completeness of any of the information and/or content provided herein and the Company cannot be held responsible for any omission, mistake nor for any loss or damage including without limitation to any loss of profit which may arise from reliance on any information supplied by TFA Global Pte Ltd.
The speaker(s) is neither an employee, agent nor representative of Tradu and is therefore acting independently. The opinions given are their own, constitute general market commentary, and do not constitute the opinion or advice of Tradu or any form of personal or investment advice. Tradu neither endorses nor guarantees offerings of third-party speakers, nor is Tradu responsible for the content, veracity or opinions of third-party speakers, presenters or participants.
