Bitcoin (BTC/USDT) - Support Trendline & Zone Price Test - DailyBitcoin (BTC/USDT) price recently rejected down from $107000 on May 19th, 2025.
The yellow Support Trendline below is currently being tested ($103000 price level).
Several candle body closes below the Support Trendline could signal weakness in the daily price trend (potential rising wedge pattern).
The April inverse head-and-shoulders price pattern and targets have been completed (+12% and +24%).
note: Breaking news, government law changes, corporate announcements, and crypto crime could affect the Bitcoin price and charts.
1-BTCUSD

2025.05.19 bitcoin analysis
Here is the current Bitcoin chart.
The daily ascending trendline previously mentioned has now been broken.
However, I still believe there is a chance for a rebound because the support zone around 102,500 (highlighted with the purple circle since May 16th) is still holding.
From my perspective, a minor rebound is underway, but I expect Bitcoin to drop down to the red box zone, which was the previous consolidation area after the uptrend.
Whether this red box zone holds or not will be crucial.
If it breaks down, as mentioned yesterday, there’s a high chance of further correction toward 100,678 → 98,800 → 94,450.
Conclusion:
The daily uptrend line is broken. (As this is a very critical zone, I personally recommend closing positions if in profit.)
A bounce occurred from the support zone, but if it comes down again, it may break the previous low and head toward 100,678.
A break below 100,678 would likely signal a full trend reversal.

BITCOIN CORRECTION AHEAD|SHORT|
✅BITCOIN keeps growing in a
Strong uptrend in a narrowing
Bearish wedge pattern and the
Coin has reached a horizontal
Resistance level of 108000$
So IF we see a breakout from
The wedge a local bearish
Correction is to be expected
SHORT🔥
✅Like and subscribe to never miss a new idea!✅
Disclosure: I am part of Trade Nation's Influencer program and receive a monthly fee for using their TradingView charts in my analysis.

Bitcoin Retests Ascending Trendline After BreakoutBTCUSD daily chart shows price action respecting a rising trendline, following a successful breakout from previous pattern. This ascending trendline now acts as a key dynamic support and serves as a central guide for the medium-term bullish structure.
Currently, price is consolidating just below the $107,000 resistance area. There are two primary scenarios to consider:
Bullish Scenario:
A confirmed breakout and daily close above the $107,000 resistance could trigger another bullish leg, targeting the next level near $120,000.
Mild Bearish / Pullback Scenario:
If the price gets rejected again, it may retrace towards the ascending trendline around $95,000, which aligns with previous horizontal support and could serve as a solid buy-the-dip zone.
Trade Plan:
Buy Entry Option 1: On a breakout above $107,000 → Target: $120,000
Buy Entry Option 2: On a bounce from the trendline near $95,000

Heading into pullback resistance?Bitcoin (BTC/USD) is rising towards the pivot which has been identified as a pullback resistance and could reverse to the 1st support which. is also a pullback support.
Pivot: 108,391.05
1st Support: 98,383.98
1st Resistance: 119,108.79
Risk Warning:
Trading Forex and CFDs carries a high level of risk to your capital and you should only trade with money you can afford to lose. Trading Forex and CFDs may not be suitable for all investors, so please ensure that you fully understand the risks involved and seek independent advice if necessary.
Disclaimer:
The above opinions given constitute general market commentary, and do not constitute the opinion or advice of IC Markets or any form of personal or investment advice.
Any opinions, news, research, analyses, prices, other information, or links to third-party sites contained on this website are provided on an "as-is" basis, are intended only to be informative, is not an advice nor a recommendation, nor research, or a record of our trading prices, or an offer of, or solicitation for a transaction in any financial instrument and thus should not be treated as such. The information provided does not involve any specific investment objectives, financial situation and needs of any specific person who may receive it. Please be aware, that past performance is not a reliable indicator of future performance and/or results. Past Performance or Forward-looking scenarios based upon the reasonable beliefs of the third-party provider are not a guarantee of future performance. Actual results may differ materially from those anticipated in forward-looking or past performance statements. IC Markets makes no representation or warranty and assumes no liability as to the accuracy or completeness of the information provided, nor any loss arising from any investment based on a recommendation, forecast or any information supplied by any third-party.

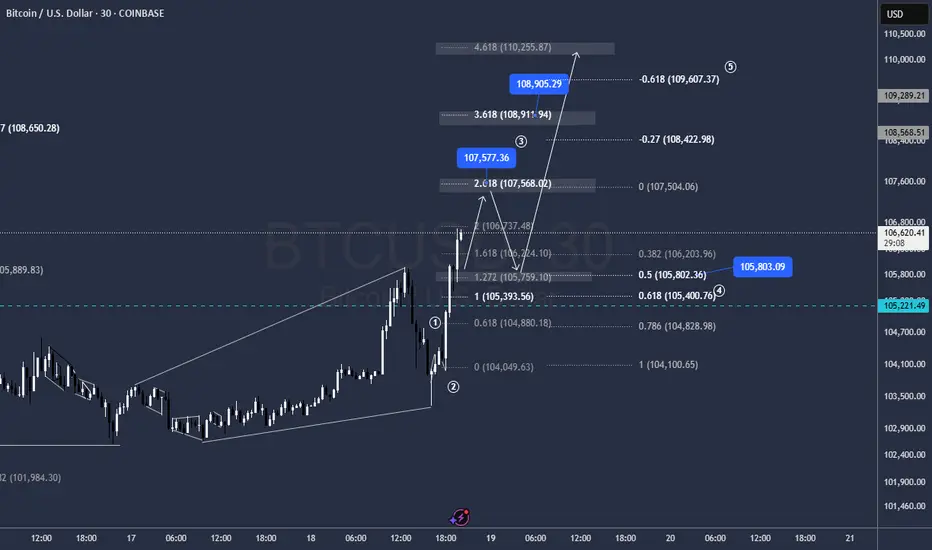
Bitcoin Analysis: Bullish Bias, But Waiting for a Smart Entry!🚀 BTCUSDT Outlook: Bullish Momentum, But Waiting for Value 📉💰
Bitcoin (BTCUSDT) continues to push higher, showing strong bullish momentum across the daily and 4H timeframes. That said, current price action appears to be overstretched—in my view, it’s trading well into premium territory 📈⚠️.
💡 Although I maintain a bullish outlook, I’m now eyeing a pullback toward a more balanced zone—ideally between the 50% to 61.8% Fibonacci retracement levels. This would bring BTC closer to equilibrium and offer a more strategic opportunity to engage with the trend.
🔎 In this video, we break down:
- The dominant trend and current structure
- How to identify potential market structure shifts
- My buy scenario, which depends on a retracement forming a bearish short-term move (e.g. on the 30-min chart), followed by a bullish break of structure 📊✅
🕒 Timing is everything. Let price unfold—we’re not predicting, we’re preparing. Entries should only be considered when price action confirms the scenario laid out in this video.
⚠️ Disclaimer:
This content is intended for educational purposes only and reflects my personal analysis and opinion. It is not financial advice. Always conduct your own research and use proper risk management.


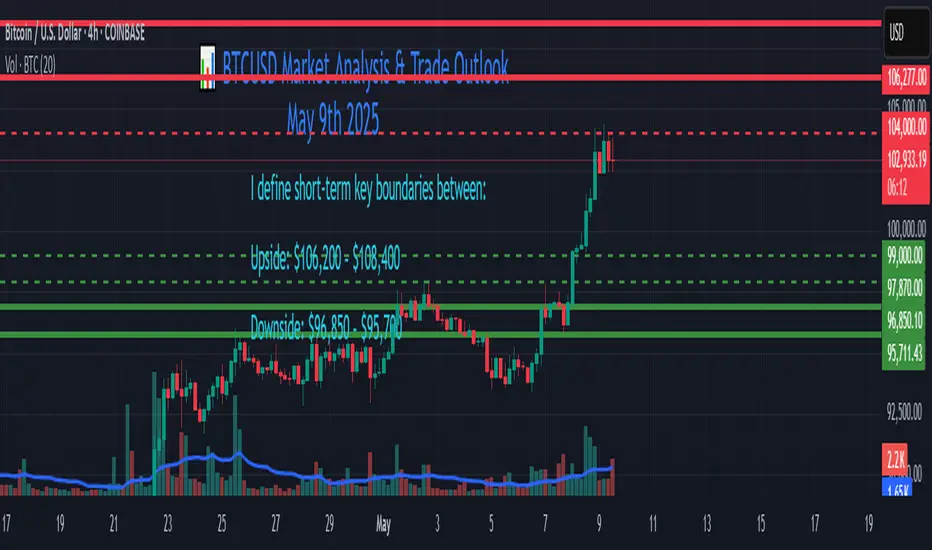
BTCUSD Market Analysis & Trade Outlook (May 9th 2025) 📊 BTCUSD Market Analysis & Trade Outlook (Post $103,500 Target)
Instrument: BTCUSD
Strategy Type: Probabilistic Breakout with Elliott & Gann Confluence
Current Price: $102,600
Trade Horizon: 2–5 Days
Timeframes Observed: 4H / Daily
🔍 Market Overview
BTCUSD has successfully completed the prior trend continuation target of $103,500, respecting the bullish structure on 4H and Daily timeframes.
As of now, price is consolidating just below key resistance, printing a high of $103,800 and retracing slightly to $102,600. This signals a potential decision zone where BTC may either continue its advance or initiate a deeper pullback.
I define short-term key boundaries between:
Upside: $106,200 – $108,400
Downside: $96,850 – $95,700
📐 Technical Structure & Key Zones
Support Zone: $ 97870 , $96,850–$95,700 (Previous consolidation + high volume node)
Resistance Zone: $106,200–$108,400 (Measured move & fib cluster area)
Structure Bias: Bullish above $99,000; bearish pressure increases below $96,850
🔄 Elliott Wave Count (Short-Term, 4H)
BTC appears to be in a Wave (3) of a higher-degree Wave 3, following a Wave (2) retracement toward $94,500.
Current price movement is within a sub-wave 3 of (3), with the recent high at $103,800 potentially marking a sub-wave 3 top.
A brief corrective Wave 4 could develop toward $100,500–$99,000, before a final Wave 5 drives price into the $106,200–$108,400 zone.
If price fails to hold above $96,850, the structure may morph into a larger corrective Wave (4), targeting the lower boundary.
📊 Gann Analysis
The Gann 1/1 angle from the March swing low is currently intersecting near $102,500–$103,000, offering resistance.
Next key Gann levels:
Above: $106,200 (120°) and $108,400 (135°) resistance arcs
Below: $96,850 and $95,700 align with 45° and 60° support angles
Timewise, entering a minor Gann cycle window on May 10–11, often associated with inflection points. Watch for breakout or reversal signals near this period.
🎯 Trade Scenario Outlook
🟢 Bullish Scenario (Breakout)
Trigger: 4H close above $104,000
Target Zones:
TP1: $106,200
TP2: $108,400
Invalidation: 4H close below $99,000 (consider tightening SL)
🔴 Bearish Scenario (Pullback)
Trigger: Break below $99,000, especially on strong volume
Target Zones:
TP1: $97870 or $96,850
TP2: $95,700
Invalidation: Close above $104,000 invalidates pullback thesis
⚙️ Strategic Trade Notes
Scalping & Swinging Options:
Consider range scalps within $102,000–$99,000, but prepare for trend breakout.
Swing traders may build positions on retracement (Wave 4) with invalidation below $97870, $96,850.
Risk Management:
Use volatility-adjusted stop losses under key Gann levels or 50EMA on 4H.
Consider tightening stops or taking partials near $106,200 to protect gains if price extends.
📌 Conclusion
BTCUSD remains in a bullish macro structure but approaches a key inflection zone. A break and hold above $104,000 could launch the next impulsive leg toward $108,400. Conversely, failure to hold above $99,000 opens the door for a deeper retracement to $ 97870, $96,850–$95,700. Traders should remain flexible, aligning with the prevailing momentum while respecting structural boundaries.
BTC new Cycle has began so you can still catch it pretty much confirmed move
Wate for pullback to 105.800 and reentry
levels and meassures in the chart
Happy Trading Week
BTC SHORT TP:101,500 16-10-2024🚨 SHORT setup active
Looking to enter between 104,000 and 104,500, targeting 100,800–101,300 based on the 2H–4H charts.
Estimated duration: 20 to 30 hours ⏳
We’re seeing signs of a manipulated pump followed by bearish formation in higher timeframes.
This setup has potential — just remember to manage your stop according to your strategy and stay alert for updates.
If the move doesn’t happen within the expected window, the setup is invalid.
We don’t use indicators, we’re not out here drawing lines or cute little shapes — I just give you a clean trade.
#BTC #PriceAction #Reydragon21

The point to watch is whether it can rise above 106133.74
Hello, traders.
If you "Follow", you can always get new information quickly.
Have a nice day today.
-------------------------------------
In order to distinguish which time frame chart the line was drawn on, it is divided into 3 types of lines.
You can create a trading strategy by responding to the support and resistance points or sections drawn on the chart depending on whether there is support or not.
-
The left is an example of when the support and resistance points were first created, and the right is an example of what it looked like after that.
To draw support and resistance points, you need to understand the arrangement of candles.
By checking how the candles are arranged, you can draw support and resistance points or sections like the example chart.
To draw support and resistance points or sections on a time frame chart like this, you need to check the arrangement of candles while minimizing the chart as much as possible.
-
Indicators are used to draw this work using more objective information.
That is, lines are drawn at the DOM(60), DOM(-60), HA-High, and HA-Low indicator points.
In this way, you will be able to reduce your subjective thoughts as much as possible.
Reducing your subjective thoughts will ensure the reliability of the drawn support and resistance points or sections.
-
Going back and drawing support and resistance points or sections with the arrangement of candles means that there must have been movement of candles in the past.
Therefore, if the candle moves to a point where there is no trace of the past, you can no longer draw support and resistance points or sections.
In terms of compensating for this shortcoming, it may be more useful to use indicators to display support and resistance points or sections.
-
The DOM indicator is an indicator that comprehensively evaluates the DMI + OBV + MOMENTUM indicators.
If the DOM indicator is 60 or higher, it means that all indicators have risen above their highest value.
If the DOM indicator is -60 or lower, it means that all indicators have fallen below their lowest value.
The fact that the DOM(60) indicator was created means that it is likely to enter the high point range.
The fact that the DOM(-60) indicator was created means that it is likely to enter the low point range.
Therefore, the DOM(60) indicator is likely to correspond to the resistance point, and the DOM(-60) indicator is likely to correspond to the support point.
Since the DOM indicator is displayed on the Close value, it has the disadvantage of being difficult to respond immediately when the actual DOM indicator is created.
However, once it is created, it will faithfully perform the role of support and resistance.
-
The HA-Low and HA-High indicators are indicators created to determine the trading point from the Heikin-Ashi candle.
Accordingly, the plotted point corresponds to the average value.
Therefore, the HA-Low and HA-High indicator points have the disadvantage of being expressed differently from the candle's value.
As you can see from the formulas of the HA-Low and HA-High indicators, the RSI value is included in the conditions of the formula.
The fact that the HA-Low indicator was created means that the price rose from the low point range.
Therefore, the HA-Low indicator corresponds to the support point.
The fact that the HA-High indicator was created means that the price fell from the high point range.
Therefore, the HA-High indicator corresponds to the resistance point.
Therefore, we basically have a trading strategy of buying when the HA-Low indicator is created and selling when the HA-High indicator is created.
-
It is not clear whether the actual support and resistance points or sections are supported or resisted.
However, as time passes, we can see whether it is supported or resisted.
To help determine whether it is supported or resisted, we use the StochRSI indicator and OBV indicator as auxiliary indicators.
-----------------------------------------
(BTCUSDT 1D chart)
It is showing an upward trend above the DOM (60) indicator displayed at the current candle position.
And, if StochRSI rises above 80 and maintains the price, the possibility of an upward trend will increase.
If the auxiliary indicator StochRSI indicator rises in the oversold zone and OBV rises above the High Line, the upward trend will be guaranteed.
The previous DOM (60) indicator is formed near the Fibonacci ratio 2 (106178.85).
Therefore, the point of observation is whether it can rise above that.
If it rises and maintains the price, it is expected to renew the ATH.
If not, and it falls below the HA-High indicator or the M-Signal indicator on the 1D chart,
1st: 97226.92
2nd: M-Signal on the 1W chart
You should check for support near the 1st and 2nd above.
-
This volatility period is expected to continue until May 20.
However, volatility may also occur around May 23 (May 22-24) and around May 27 (May 26-28), so you should be careful of volatility until May 28.
-
Thank you for reading to the end.
I hope you have a successful trade.
--------------------------------------------------
- This is an explanation of the big picture.
I used TradingView's INDEX chart to check the entire range of BTC.
I rewrote the previous chart to update it by touching the Fibonacci ratio range of 1.902 (101875.70) ~ 2 (106275.10).
(Previous BTCUSD 12M chart)
Looking at the big picture, it seems to have been following a pattern since 2015 and has been rising.
In other words, it is a pattern that maintains a 3-year uptrend and faces a 1-year downtrend.
Accordingly, the uptrend is expected to continue until 2025.
-
(Current BTCUSD 12M chart)
Based on the currently written Fibonacci ratio, it shows up to 3.618 (178910.15).
Fibonacci ratio 0.618 (44234.54) is not expected to fall again.
(BTCUSDT 12M chart)
I think it is around 42283.58 when looking at the BTCUSDT chart.
-
I will explain it again with the BTCUSD chart.
The Fibonacci ratio ranges marked in the light green boxes, 1.902 (101875.70) ~ 2 (106275.10) and 3 (151166.97) ~ 3.14 (157451.83), are expected to be important support and resistance ranges.
In other words, it seems likely to act as a volume profile range.
Therefore, in order to break through this section upward, I think the point to watch is whether it can rise with support near the Fibonacci ratios of 1.618 (89126.41) and 2.618 (134018.28).
Therefore, the maximum rising section in 2025 is expected to be the 3 (151166.97) ~ 3.14 (157451.83) section.
To do that, we need to look at whether it can rise with support near 2.618 (134018.28).
If it falls after the bull market in 2025, we don't know how far it will fall, but considering the previous decline, we expect it to fall by about -60% to -70%.
So, if the decline starts near the Fibonacci ratio 3.14 (157451.83), it seems likely that it will fall to around Fibonacci 0.618 (44234.54).
I will explain more details when the downtrend starts.
------------------------------------------------------

BTC/USD 4H Chart targets and stoplossHello everyone, let's look at the 4H BTC to USD chart, in this situation we can see how the price has come out of the downtrend channel on top, and the upward movement after leaving the channel is close to the height of the downtrend channel.
Let's start by defining the targets for the near future that the price has to face:
However, at the beginning we can see how the price is struggling with a strong resistance zone from $103882 to $108349. Next, we have potential targets:
T1 = 112,740 USD
T2 = 116,525 USD
Т3 = 120,000 USD
Now let's move on to stop-loss in case the market continues to fall:
SL1 = 100,551 USD
SL2 = 97,446 USD
SL3 = 92,525 USD
SL4 = 88,286 USD
The RSI indicator shows that in the 4H interval, the movement is at the upper limit of the range, which clearly affects the sideways movement on the chart.

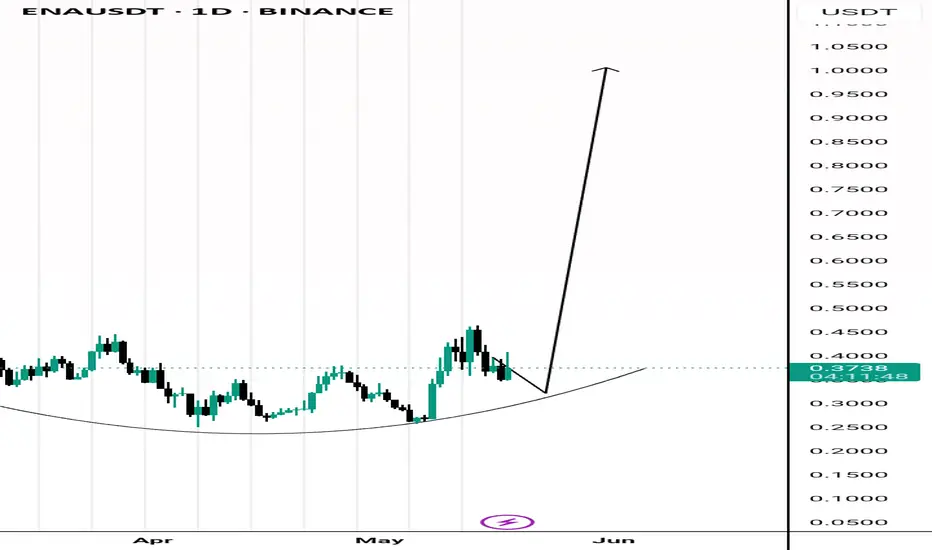
Buy Idea Rounding tops and bottoms can be reversal patterns.
Looking at this daily chart, there's rounding bottom.
Third touch of the boundaries with a bullish candlestick will mean buy for me.
NOTCOIN AGAIN ...Hello friends
Due to the change in the bearish structure and the weakness of the sellers, you can see that the buyers entered and were able to create new ceilings.
Now, according to the trend, we can buy in steps at the specified support points and move with it to the specified targets.
*Trade safely with us*

XRP : LONG FOR THIS WEEK !Hello friends
Considering the good growth we had, you can see that the price has formed a double top pattern and corrected after reaching its ceiling.
Now, with the price correction, there is a good opportunity to buy in stages and with capital management and move with it to the specified goals.
*Trade safely with us*

SOLANA BUYLIMITHello friends
Considering the good growth we had, you can see that the price has made a small correction after reaching its ceiling and has entered a range.
Now, with the price correction, there is a good opportunity to buy in stages and with capital management and move towards the specified goals.
*Trade safely with us*

SPY WEEKLY 19TH-23RD MAY 2025Welcome to Spy weekly. I have tried to explain the price action & all-important levels in the best possible way but still if you have doubts then feel free to leave a comment below.
NOTE: WE ARE IN BULL RUN

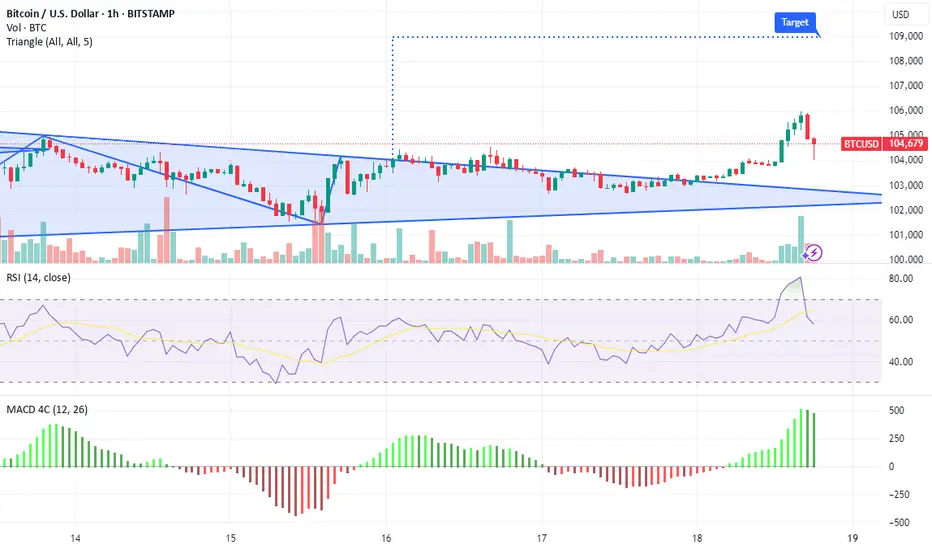
Bitcoin: currently side tradedAs BTC reached its new, highest levels, after the first round of the US-China trade tariffs negotiations were settled, it has been side traded. There have been both attempts for a move toward the higher grounds, and an equal attempt for a move toward the lower grounds, however, neither side prevailed. The weekend news regarding the US sovereign downgrade by Moody's rating agency also did not manage to make any significant impact on the price of BTC. In a sense of a technical analysis, the BTC is currently collecting the energy for the final move toward the one side in the coming period.
The RSI continues to move in the overbought territory for the second week in a row. This is an indication that the reversal might be expected in the coming period. On the opposite side, MA50 is modestly converging toward the MA200, indicating that the cross might come in the next few weeks, as an indication of the potential trend change.
The charts are currently showing the potential for the price break in the coming period, possible also during the week ahead. As BTC was side traded for the last two weeks, there is a formation on charts called triangle, marking highs from 12th May and lows also from this date. The triangle came to an end, which is an indication that the potential break is to be expected. In case that the final break occurs to the upside, the BTC will test again the $105K level reached on 12th May, and a potential for higher grounds. However, if the triangle is broken toward the downside, the first stop will be the level of $102K on a road toward the $100K level.

Bitcoin Stalls, But Chart Watchers Eye $300,000 Peak: Here's Whe
Bitcoin, the world's leading cryptocurrency, has experienced a period of consolidation, leaving investors and analysts alike pondering its next move. While the price has stalled below the $105,000 mark, a confluence of factors, including popular predictive models and bullish sentiment from prominent crypto analysts, suggests that a significant surge could be on the horizon. The potential for Bitcoin to reach new all-time highs, possibly soaring to between $275,000 and $300,000 by October of this year, is fueling excitement and speculation within the crypto community.
This article delves into the factors driving the bullish outlook for Bitcoin, examining the predictive models, analyst forecasts, and underlying fundamentals that support the possibility of a substantial price increase. We will explore the potential catalysts that could propel Bitcoin to new heights and analyze the technical indicators that chart watchers are monitoring closely.
Predictive Models Point to a Massive Surge
One of the primary drivers of the bullish sentiment surrounding Bitcoin is the existence of popular predictive models that suggest a massive price surge in the coming months. These models, often based on historical data, supply and demand dynamics, and other relevant factors, attempt to forecast the future price of Bitcoin with varying degrees of accuracy.
One such model, which has gained considerable attention in the crypto community, points to a potential surge to between $275,000 and $300,000 by October of this year. While the specifics of this model are not explicitly detailed in the prompt, it is likely based on factors such as Bitcoin's scarcity, its increasing adoption as a store of value, and the potential for institutional investment to drive demand.
It is important to note that predictive models are not foolproof and should not be taken as definitive guarantees of future price movements. However, they can provide valuable insights into potential scenarios and help investors make informed decisions.
Analyst Forecasts: $159,000 This Cycle
In addition to predictive models, bullish forecasts from prominent crypto analysts are also contributing to the optimistic outlook for Bitcoin. One analyst, in particular, has predicted that Bitcoin's price could reach $159,000 this cycle.
While the specific methodology used by this analyst is not detailed in the prompt, it is likely based on a combination of technical analysis, fundamental analysis, and market sentiment. Technical analysis involves studying price charts and other technical indicators to identify potential trends and patterns. Fundamental analysis involves evaluating the underlying value of Bitcoin based on factors such as its adoption rate, network security, and regulatory environment. Market sentiment involves gauging the overall mood and expectations of investors in the crypto market.
The analyst's forecast of $159,000 this cycle suggests a belief that Bitcoin is currently undervalued and that its price will eventually catch up to its intrinsic value.
Bitcoin IS The Opt Out
The phrase "Bitcoin IS The Opt Out" encapsulates a growing sentiment within the crypto community that Bitcoin represents a viable alternative to traditional financial systems. This sentiment is based on the belief that Bitcoin offers several advantages over traditional currencies and financial institutions:
• Decentralization: Bitcoin is not controlled by any single entity, such as a government or central bank. This decentralization makes it resistant to censorship and manipulation.
• Scarcity: Bitcoin has a limited supply of 21 million coins, which makes it a scarce asset. This scarcity is expected to drive its price higher over time as demand increases.
• Transparency: All Bitcoin transactions are recorded on a public ledger called the blockchain. This transparency makes it difficult to engage in illicit activities using Bitcoin.
• Security: The Bitcoin network is secured by cryptography, making it difficult to hack or tamper with.
The belief that Bitcoin offers a viable "opt out" from traditional financial systems is driving increased adoption and investment in the cryptocurrency.
BTC Price to $116K Next? 'Early Week' All-Time High
The prospect of Bitcoin reaching $116,000 in the near future, potentially even achieving an all-time high early in the week, is further fueling bullish sentiment. This forecast, attributed to a Bitcoin trader, suggests that the cryptocurrency is poised to break out of its current consolidation phase and enter a new period of price discovery.
The trader's forecast is likely based on technical analysis, identifying potential breakout patterns and momentum indicators that suggest an imminent surge in price. The expectation of an "early week" all-time high suggests a belief that the market is primed for a rapid and decisive move to the upside.
Leaving the Tight Range Behind
The statement that "Bitcoin is in line to leave its tight range behind in the coming days" suggests that the period of consolidation is nearing its end. A tight trading range typically indicates a period of indecision in the market, where buyers and sellers are evenly matched. However, such periods often precede significant price movements, as pent-up energy is released in one direction or another.
The expectation that Bitcoin will leave its tight range behind suggests a belief that the balance of power is shifting in favor of buyers, setting the stage for a potential breakout to the upside.
Retaking All-Time Highs and Pushing into Price Discovery
The ultimate goal for Bitcoin bulls is to see the cryptocurrency retake its all-time highs and push into price discovery. Price discovery refers to the process of establishing a new price level for an asset when it breaks out of its previous range.
When Bitcoin reaches a new all-time high, it enters a period of price discovery, where there are no historical resistance levels to impede its upward movement. This can lead to rapid and substantial price increases, as buyers are willing to pay higher and higher prices to acquire the asset.
Potential Catalysts for a Bitcoin Surge
Several potential catalysts could propel Bitcoin to new all-time highs and trigger a period of price discovery:
• Increased Institutional Investment: As more and more institutional investors, such as hedge funds, pension funds, and corporations, allocate capital to Bitcoin, demand for the cryptocurrency is likely to increase, driving its price higher.
• Regulatory Clarity: Greater regulatory clarity surrounding Bitcoin and other cryptocurrencies could remove a major source of uncertainty and encourage more investors to enter the market.
• Mainstream Adoption: As Bitcoin becomes more widely accepted as a form of payment and a store of value, its adoption rate is likely to increase, driving demand and price appreciation.
• Macroeconomic Factors: Macroeconomic factors, such as inflation, currency devaluation, and geopolitical instability, could drive investors to seek refuge in Bitcoin as a safe haven asset.
Technical Indicators to Watch
Chart watchers are closely monitoring several technical indicators to gauge the potential for a Bitcoin surge:
• Breakout Patterns: Identifying potential breakout patterns, such as ascending triangles, cup and handle formations, and flag patterns, can provide clues about when Bitcoin is likely to break out of its current range.
• Volume: Monitoring trading volume can help to confirm the validity of a breakout. A breakout accompanied by high volume is generally considered more reliable than a breakout accompanied by low volume.
• Momentum Indicators: Momentum indicators, such as the Relative Strength Index (RSI) and the Moving Average Convergence Divergence (MACD), can help to gauge the strength of a trend and identify potential overbought or oversold conditions.
• Support and Resistance Levels: Identifying key support and resistance levels can help to anticipate potential price movements and set appropriate entry and exit points.
Conclusion: Awaiting the Next Chapter in Bitcoin's Story
Bitcoin's recent period of consolidation has left investors and analysts eager to see what the future holds. While the price has stalled below $105,000, a confluence of factors, including predictive models, analyst forecasts, and bullish market sentiment, suggests that a significant surge could be on the horizon.
The potential for Bitcoin to reach new all-time highs, possibly soaring to between $275,000 and $300,000 by October of this year, is fueling excitement and speculation within the crypto community. Whether Bitcoin achieves these lofty targets remains to be seen, but the stage is set for what could be another exciting chapter in the cryptocurrency's story. As always, investors should conduct their own research, assess their risk tolerance, and make informed decisions before investing in Bitcoin or any other cryptocurrency. The journey ahead promises to be volatile, but the potential rewards could be substantial for those who are willing to navigate the risks.
Where Is The Correction For Bitcoin?Hello, Skyrexians!
Recently we told about potential correction on BINANCE:BTCUSDT and current pump did not change anything except targets for this correction.
My mistake was that I counted wave 5 inside 3 as the wave 5, but warned you that I often have this mistake. Now looking at the awesome oscillator it's obviously that wave 4 has not been even started. Anyway wave 3 has been already pumped above the 1.61 Fibonacci it means that wave 5 will be not extended. Very soon corrective wave 4 will be started. The target now is between 0.38 and 0.5 Fibonacci retracement levels, approximately at $95k. Anyway, taking short against trend is bad idea. The only one way you can use this info is to define the zone where you can take long trade, but I will not take. I told in one of my analysis when Bitcoin was $76k two months ago that growth above $140k has been started, I don't like to anticipate small moves.
This was my global forecast
Best regards,
Ivan Skyrexio
___________________________________________________________
Please, boost this article and subscribe our page if you like analysis!

BTC repeating of patternsI see repeating of patterns and it was and will help BTC to continue the up trend.

USDT.D Head & Shoulder Pattern: Target 4.00%UDST.D is showing signs that we're about to head into a major upswing in crypto and ignite ETH as well as alt-season.
The H&S target is 4.00% on the dot. Further downside from there likely if we hit our target which I'm guessing will happen in next 1-2 weeks.

BTCUSD: Will Go Down! Short!
My dear friends,
Today we will analyse BTCUSD together☺️
The recent price action suggests a shift in mid-term momentum. A break below the current local range around 105,444.37 will confirm the new direction downwards with the target being the next key level of 104,692.82 and a reconvened placement of a stop-loss beyond the range.
❤️Sending you lots of Love and Hugs❤️
