BITCOIN BULLISH TO $116,000 (UPDATE)Bitcoin still has more upside to come towards our $116,000 - $120,000 target. Roughly another 13% gain from CMP. We're still holding within the Crypto Fund for my investors!
1-BTCUSD

Bitcoin Trajectory for Q1 and Q2 2025Hey everyone, it’s been a while! 👋
Let’s dive straight into the Bitcoin outlook and my vision for the months ahead. 🚀
Key Observations 📊
Patterns : Rounding Top & Bottom.
Rebound Levels:
Alt. 1: $101,000
Alt. 2: $82,000
Moving Averages : EMA50 & EMA188.
Target Area : $135,000+ 🔥
Pro Tip 💡
I'm setting an alert for the EMA188 cross on BTCUSDT to stay ahead of the game.
Stay tuned for more updates and insights! 💬

Avax Buy IdeaTo a Classical Chart trader this has flash a buy signal.
I add candlestick to my trading plan, so, today candle closing will finish the whole story for me.

BTCUSD - Support/Resistance LineAs seen on chart price has recovered this line previously seen as resistance and is now using it as support
This is extremely bullish for price as the resistance has essentially flipped to support
Great time to buy crypto as new ATHs for Bitcoin are about to come
Daily timeframe

Bitcoin Daily BullflagA bullflag on the daily chart for BTCUSD suggesting price will move higher in which a bullflag is a bullish pattern indicated by the name
I think Bitcoin will still move up but alts will outperform with this next move
Daily chart

BTCUSD…relative equal lowsGood day traders, I’m back with another setup and this time we looking at the cryptocurrency (BTCUSD). This setup up is a short term trade, looking at the 1H TF we can clearly see the equal lows lows and one of lows that make up those relative lows is also our minutes TF’s low.
For the day our narrative is that internal liquidity and we also can expect price to push past that external liquidity. The 2 ray lines make up the volume imbalance that’s once price rebalances we can expect lower price for the rest of the day or maybe even rest of the week.

Bitcoin (BTC) Price Outlook: Path to $150,000Overview:
Bitcoin continues to demonstrate remarkable strength, maintaining its long-term uptrend and consistently setting new highs. Based on my technical analysis, I am projecting a bullish target for BTC in the $150,000 region, supported by robust price action and key technical levels.
Trend Analysis:
The chart clearly illustrates a persistent upward trajectory, with BTC respecting a major ascending trendline that has acted as dynamic support throughout this cycle. This trendline not only underscores the prevailing bullish sentiment but also provides a reliable reference for potential pullbacks and trend continuation.
Key Levels:
BTC is currently trading near $102,800, having recently overcome several resistance levels. The next significant resistance zones are identified at approximately $106,500 and $109,400. However, the most critical area to watch is the $150,000 region, which is highlighted as a major resistance zone on the chart. This level represents both a psychological milestone and a technical barrier, where I anticipate increased volatility and profit-taking.
Support Structure:
On the downside, BTC is well-supported by multiple levels, including $95,200, $95,600, and $96,300. Should the market experience a correction, these zones are likely to attract buyers and provide a foundation for the next leg up. Further below, the $67,100 and $64,960 levels serve as deeper support, though a move to these areas would likely require a significant shift in market sentiment.
Technical Patterns:
The chart also highlights previous consolidation phases and breakout patterns, all of which have resolved to the upside. This consistent pattern of breaking out from consolidation channels further reinforces the bullish outlook.
Conclusion:
In summary, Bitcoin’s technical structure remains overwhelmingly positive. As long as the uptrend persists and key support levels hold, I expect BTC to continue its ascent toward the $150,000 target. Investors should monitor the intermediate resistance zones for potential short-term volatility, but the broader trend remains firmly intact.
Disclaimer: This analysis is for informational purposes only and does not constitute financial advice. Always conduct your own research before making investment decisions.

BTCUSD Can it do this one more time?Bitcoin / BTCUSD is on a strong 1week MA50 rebound, while staying inside the Channel Up from the Cycle bottom and holding the 1week RSI Support.
Last time it did that was during the 2015-2017 Bull Cycle.
In fact it was May 2017 when the price started rising aggressively and eventually broke above the Channel Up into a relentless parabolic rally until the end of the year.
With the Cycle seemingly identical, do you think Bitcoin can do this one more time?
Follow us, like the idea and leave a comment below!!

BTCUSD: is far away from its Sell Zone.Bitcoin remains overbought on its 1D technical outlook (RSI = 70.017, MACD = 4154.600, ADX = 16.535) but still in the middle of the Cycle's Channel Up. After a 1W MA50 rebound (April 7th) on the bottom quarter, it is aiming for the blue Sell Zone of the top quarter of the Channel Up where the last two tops were priced. A +93.64% rise has been the most common inside this pattern. Based on that the minimum TP for this run is 140,000.
## If you like our free content follow our profile to get more daily ideas. ##
## Comments and likes are greatly appreciated. ##

Bitcoin and the Historic 8-Year Trendline: A Pivotal MomentHello, I'm full-time trader Dusk.
If this analysis helps you, please consider following and boosting this post. Thank you!
Today, I'm writing with anticipation and excitement as Bitcoin once again approaches an 8-year-long historical trendline.
It has been quite a journey, with Bitcoin reaching a high of $19,000 in 2017,
soaring to $69,000 in 2021, and touching $109K in 2025
On January 20 of this year, Bitcoin tested its 8-year trendline but failed to break above it, subsequently dropping sharply to $74,500 (-32%) by April 4. Since then, Bitcoin has steadily recovered and continued its upward momentum.
Currently, Bitcoin is at $104,000, with the next key target being $113,000.
I've outlined four possible scenarios:
① Immediate rejection and decline from current priceProbability: ★★★☆☆ (Medium)
② Reaching $113K, then decliningProbability: ★★★☆☆ (Medium)
③ Direct breakout above $113KProbability: ★★☆☆☆ (Moderate)
④ Touching $113K, consolidating, then continuing upwardsProbability: ★★★★☆ (High)
Personally, I find scenarios ② and ④ to be the most likely, though I’m hoping for scenario ③—a powerful breakout beyond $113K.
However, the region between $105K and $113K currently presents significant selling pressure. It remains uncertain whether Bitcoin can swiftly break through this resistance and maintain momentum despite substantial selling volume.
That said, the current market dynamics differ significantly from the past. BlackRock now holds approximately 600,000 BTC, MicroStrategy around 550,000 BTC, and various U.S. states and countries are increasingly recognizing Bitcoin as a strategic asset.
Today's news highlights Galaxy Digital's Nasdaq listing and discussions with the SEC regarding tokenizing Nasdaq-listed U.S. stocks.
With increased institutional and governmental adoption and now discussions around stock tokenization, Bitcoin stands on the threshold of mainstream institutional acceptance.
Let's closely monitor how Bitcoin responds at this historic trendline, and together witness the potential unfolding of a new financial era.
I hope this isn't just wishful thinking!

BTC-----Sell around 104000, target 102000 areaTechnical analysis of BTC contract on May 16:
Today, the large-cycle daily level closed with a small positive line yesterday, and the K-line pattern was single negative and single positive. The price was still consolidating at a high level. The attached chart indicator was running with a shrinking volume and the fast and slow lines showed signs of a dead cross. But again, the current signal is a retracement correction, not a trend, because at the weekly level, the price is just retracing the moving average, and everyone should be clear about this; the high pressure level is in the 105800 area, and the low point is in the 100600 area; the short-term price rebounded in the early morning, and retreated under pressure in the Asian morning. The intraday high was around the 104500 area. The current retracement did not continue, so there is still a demand for consumption during the day, but the hourly chart attached chart indicator has already crossed.
Therefore, today's BTC short-term contract trading strategy: sell at the 104000 area, stop loss at the 104500 area, and target the 102500 area

BTC Primary trend. Secondary - expanding triangle.Logarithm. Time frame 1 week. Linear for clarity. Now the price is in consolidation in the key resistance zone of the "psychology 100" zone. Everything is as before, nothing new.
The price moves from dynamic zones of support and resistance of the large channel, and with the observance of the proportions of decreasing % from the previous maximums and minimums, adhering to a conditional 4-year cyclicality. Which is also initially embedded in the Bitcoin halvings, and the understanding of increasing demand, with a decrease in supply through halvings (but, here is a nuance with ETF, that is, conditionally with "fake bitcoins", which significantly increases the supply).
With a huge degree of probability, in the next cycle (possibly the final one), Bitcoin will be driven above or around $ 1 million, depending on the maximum that will be set in this cycle. Perhaps it will be much higher (parabolic growth as at the end of 2017) than the average distribution price. Mass digitalization is underway... and there are more and more dollars, they need to be somehow utilized in the future.
I specifically refreshed the old ideas of the main trend (2 and 3 years ago published) of this scale, and made it on a linear chart, for greater visualization of the trend direction and patterns that are formed on a smaller scale.
BTC/USD Secondary trend cycles and halvings. 1 07 2022
BTC/USD Halving 518 When will the minimum and maximum price be cycles. 27 09 2023

SPY/QQQ Plan Your Trade For 5-16 : Gap Potential PatternToday's pattern suggests the SPY will attempt to GAP at the open. The current price structure suggests the SPY/QQQ are in an upward FLAGGING formation related to a broad Excess Phase Peak pattern. I believe this upward trend will continue until price attempts to break either the upper previous Ultimate High pattern or break the lower channel of the current FLAGGING formation.
The wonderful thing about these Excess Phase Peak patterns, and other techniques I'm trying to teach you, is that they provide very clear triggers/directions/opportunities for traders who understand these patterns.
Today, I highlight my SPY Bias (Primary & Secondary) trending system that shows the SPY is much weaker than many people believe. Because of this, I believe we are potentially nearing an Exhaustion Peak in the SPY/QQQ - time will tell.
The use of my extended Biasing systems and Custom Index charts helps me understand what is taking place behind the SPY/QQQ price action. It's like peaking behind the curtains in terms of what my Custom Indexes and other specialized data can provide. I can see what is really taking place related to price action - moving beyond the simple SPY/QQQ charts.
Gold and Silver appear to be setting up an Inverted Excess Phase Peak pattern off a potential Ultimate Low in price. It will be interesting to see how this downward price flag plays out over the next week+. If this pattern holds, we should see the FLAG end and price should rally up into the consolidation phase. Very exciting for metals.
Bitcoin, which tends to lead the SPY/QQQ, is stalling near a peak. Keep your eyes on BTCUSD over the weekend as I believe we may be able to identify how the SPY/QQQ will react on Monday by watching what BTCUSD does.
Thanks for being patient and understanding my schedule over the past 30+ days. I've had multiple family member visit the hospital over the past 5-6+ weeks and my world has been filled with doctors, hospitals, follow-ups, work, and trying to keep everyone healthy and away from trouble.
It appears these issues are starting to get more settled - which means I'll be able to stay more focused on work - instead of driving around everywhere and waiting for appointments.
Get some..
#trading #research #investing #tradingalgos #tradingsignals #cycles #fibonacci #elliotwave #modelingsystems #stocks #bitcoin #btcusd #cryptos #spy #gold #nq #investing #trading #spytrading #spymarket #tradingmarket #stockmarket #silver

After $105K Peak, Bitcoin May Revisit 0.382 FOB Level!CRYPTOCAP:BTC is pulling back after hitting a high of $105,800
If you look at the daily chart, we haven’t seen any healthy pullback, the price has gone straight up.
In my opinion, a retest of the 0.382 FOB level around $94K would be a healthy correction for Bitcoin. Based on the liquidation heatmap, we’re also seeing liquidity building up at lower levels.
This is one of the signs of a pullback, which is important for a sustainable and healthy market.
Stay tuned and follow for more updates!

ADAUSDT IDEAI think chart looks pretty clear now. Red supply area properly laid down. Along with price properly taking buys from demand area in blue with higher lows. So obvious path will be the movement above supply till next supply (red area). Remember the supply is selling area (no retest concept) so strong selling could also originates. so trades are only after breaking out with clear price marching above supply zones.

btc + $200kBitcoin's absolute focus is +$200k and beyond.
I think the 2024\2025 local peak has not been seen yet and we may see a peak around + $200k .

BITCOIN Stairway to 134k.Bitcoin (BTCUSD) is unfolding a very interesting pattern since its April 07 bottom. That was at $74500 and since that level, it has been consistently targeting all 10k intervals above it: From 74k to 84k, 94k and is now on 104k.
Once it hit all those levels, the price consolidated, forming a very structured Channel Up. Now, the Channel Up may not hold forever but this consistency gives us the idea that it can continue targeting all those levels above it: 114k, 124k, 134k. If this pattern continues to hold for as much time as it has since the bottom, then we may see $134k by late June/ early July.
Do you think it is possible to stay this consistent for that long? Feel free to let us know in the comments section below!
-------------------------------------------------------------------------------
** Please LIKE 👍, FOLLOW ✅, SHARE 🙌 and COMMENT ✍ if you enjoy this idea! Also share your ideas and charts in the comments section below! This is best way to keep it relevant, support us, keep the content here free and allow the idea to reach as many people as possible. **
-------------------------------------------------------------------------------
💸💸💸💸💸💸
👇 👇 👇 👇 👇 👇

BITCOIN MIGHT SEE $160KWe have a vey similar movement for bitcoin compare to few months ago
1) Pass the 20MA on weekly
2) Bullish cross on MACD
3) Cross and stay above the weekly resistance ( yellow trendline )
4) +60% upside movement
Im not saying 60% raise is coming to bitcoin ( may be come ), but at least $134k - $140k is very likely IMO

BTCUSD Next MoveNote: This chart presents a short-biased plan for BTC/USD based on key technical levels and price action signals.
🔍 Key Levels
: Resistance / All-Time High Area: $105,000
: Support Zone: Around $101,000
: Sell Trade TP1: $99,000
: Sell Trade TP2: $96,000
: Final Target: $93,500
: Critical Breakdown Level: $101,000 (Support)
📌 Plan Breakdown
🟦 Bearish Bias Setup:
> The market is consolidating between $101,000 support and $105,000 resistance, forming a range-bound structure near all-time highs.
> A breakdown below $101,000 support with a confirmed candle close below that level would trigger a sell signal.
> Rewritten chart note:
If the price breaks below the $101,000 support area and a candle closes beneath it, we can consider initiating a sell trade.
🔽 Downside Path:
: If the price breaks the support:
: First target: $99,000 — minor support.
: Second target: $96,000 — highlighted range zone.
: If the price breaks below $96,000, expect further downside toward $93,500 (final target).
🔄 Sideways Possibility:
: If the price breaks below $101,000 but fails to push through $96,000, the market may range between $96K–$99K before choosing a direction.
: The purple box (around $96K) is expected to be choppy — a break below confirms strong bearish continuation.

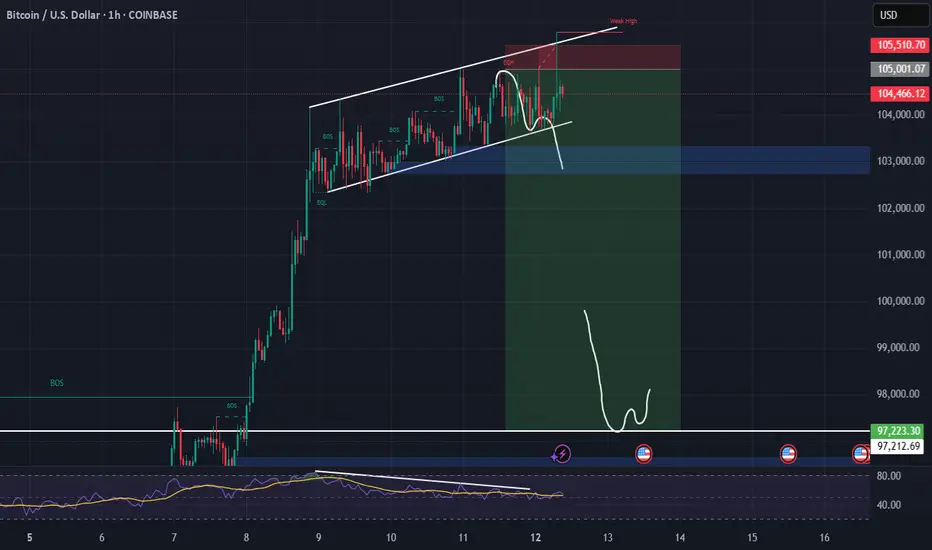
BITCOIN BTC Is Entering Into The Correction Read Caption Bitcoin Chart Analysis: Potential Correction Incoming
In my opinion, Bitcoin (BTC) is showing signs of entering a correction phase. The price is approaching its previous all-time high (ATH), and historically, such levels often act as strong resistance. With the market exhibiting signs of exhaustion and profit-taking behavior, a short-term pullback or consolidation could be expected before any further bullish continuation.
---
Would you like a more technical version with indicators (like RSI, MACD, or Fibonacci levels), or a visual chart to accompany

BTC Strength Alert: Key Levels, Fibonacci & VolatilityBitcoin (BTCUSD) Strength Alert: Key Levels, Fibonacci & Volatility Point to Entry Opportunities
Bitcoin (BTCUSD) Technical Analysis: Navigating Strength and Volatility
Bitcoin (BTCUSD) continues to capture the attention of the global financial markets, demonstrating notable resilience and underlying strength. The current market structure suggests a period where bulls are actively defending key price thresholds, creating a fascinating technical landscape. This analysis will provide an in-depth examination of BTCUSD, focusing on its price action relative to significant psychological levels, the supportive role of Fibonacci retracements, characteristic volatility patterns, and strategic entry considerations based on bullish candlestick formations.
1. Introduction to Bitcoin and the BTCUSD Pair
Bitcoin, introduced in 2009, stands as the progenitor of cryptocurrencies, operating on a decentralized peer-to-peer network secured by cryptographic principles and recorded on a public distributed ledger known as the blockchain. It was designed as a digital alternative to traditional fiat currencies, free from central bank control. The BTCUSD pair represents the exchange rate between Bitcoin and the United States Dollar, making it one of the most liquid and heavily traded instruments in the digital asset space. Its price movements are a barometer for the broader cryptocurrency market sentiment and are influenced by a myriad of factors including adoption trends, regulatory news, macroeconomic developments, and technological advancements within the Bitcoin network itself. Understanding the technical dynamics of BTCUSD is crucial for traders, investors, and market analysts seeking to navigate its often-turbulent price swings.
2. Current Market Sentiment and Price Action: Holding Above Key Psychological Levels
A significant observation in the current BTCUSD market is its ability to maintain its footing above a key psychological price level. Such levels, often round numbers (e.g., $50,000, $60,000, or in this context, a hypothetical significant level like $100,000 if we assume a major bull run has occurred), act as important mental benchmarks for market participants. When price successfully breaks above such a level and subsequently holds it as support, it can signal a powerful shift in market sentiment. This behavior suggests that buyers are willing to step in and defend this new valuation, absorbing selling pressure and preventing a swift retracement.
The act of holding above a major psychological level often has a self-fulfilling prophecy component. As traders and algorithms identify this level as critical, buy orders tend to cluster around it, reinforcing its strength as a support zone. Conversely, if the price were to decisively break below such a level after holding above it, it could trigger a cascade of stop-loss orders and a rapid decline, indicating that the previous bullish conviction has waned. The current strength shown by Bitcoin in maintaining its position above such a noted psychological threshold is therefore a bullish indicator, suggesting underlying demand and a positive short-to-medium-term outlook, provided this support continues to hold. This resilience can build confidence among market participants, potentially attracting further capital inflow.
3. Fibonacci Retracement Analysis: Identifying Strong Support
Fibonacci retracement levels are a cornerstone of technical analysis, employed to identify potential areas of support and resistance. Derived from the Fibonacci sequence – a series of numbers where each number is the sum of the two preceding ones (0, 1, 1, 2, 3, 5, 8, 13, etc.) – the key retracement levels are 23.6%, 38.2%, 50%, 61.8%, and 78.6%. These percentages are applied to a prior price swing (from a significant low to a significant high in an uptrend, or vice-versa in a downtrend) to project areas where the price might pull back before resuming the primary trend.
The observation that Fibonacci retracement levels suggest strong support at current BTCUSD levels is particularly pertinent. When the market is in an uptrend and experiences a corrective pullback, traders watch these Fibonacci levels closely. The 38.2%, 50%, and 61.8% levels are often considered the most significant. A retracement to, and subsequent bounce from, one of these levels indicates that the correction is likely a healthy pause within a larger bullish trend, rather than a reversal.
If BTCUSD is currently finding support near a critical Fibonacci level, it implies that the preceding upward momentum was strong, and the current consolidation or minor pullback is being met with buying interest at a mathematically significant point. For example, if Bitcoin recently rallied from point A (low) to point B (high), and has now retraced to the 61.8% level of that rally and is holding, it's a classic sign that bulls are re-entering the market, viewing the pullback as a discounted buying opportunity. The confluence of a psychological level with a Fibonacci support level would create an even more potent support zone, significantly increasing the probability of a price bounce. Traders often look for candlestick confirmation at these Fibonacci levels before committing to a position.
4. Volatility Analysis: US Evening and Asian Morning Hours
Volatility is an inherent characteristic of Bitcoin, representing the degree of variation of its trading price series over time. The observation that BTCUSD volatility tends to increase during US evening and Asian morning hours is a valuable insight for strategic trade timing. This period typically corresponds to the overlap between the closing of the New York trading session and the opening of major Asian financial centers like Tokyo, Hong Kong, and Singapore.
Several factors contribute to this heightened volatility:
Market Overlap and Liquidity Shifts: As one major market winds down and another ramps up, there can be shifts in liquidity. The initial hours of the Asian session often bring fresh news, order flows, and participants, leading to price discovery and increased trading activity.
News Dissemination: Significant economic data releases, corporate earnings (for Bitcoin-related companies), or crypto-specific news from either the US (late announcements) or Asia can occur during these hours, directly impacting BTCUSD prices.
Algorithmic Trading: Many trading algorithms are programmed to react to specific inter-market conditions or news events, and their activity can amplify price movements during these transitional periods.
Derivatives Market Activity: The global nature of Bitcoin derivatives markets (futures, options) means that activity in these markets can influence spot prices around the clock. The US evening/Asian morning window sees active participation from traders in these regions.
For traders, this period of increased volatility presents both opportunities and risks. Opportunities arise from potentially larger price swings that can be capitalized upon with well-timed entries. Risks are elevated due to the potential for rapid price changes, which can trigger stop-losses or lead to slippage. Therefore, while these hours can be opportune for entry, they also demand heightened vigilance and robust risk management.
5. Entry Strategies: Volatility, Candlestick Patterns, and Timing
Leveraging the increased volatility during US evening and Asian morning hours for entry timing requires a methodical approach, primarily focusing on the confirmation provided by bullish candlestick patterns. Candlestick charts offer a visual representation of price movements and can signal shifts in market sentiment and potential reversals or continuations.
Key Bullish Candlestick Patterns for Entry Confirmation:
Hammer: Appearing after a downtrend, a Hammer is characterized by a small real body at the upper end of the trading range, with a long lower shadow (at least twice the size of the body) and little to no upper shadow. It indicates that sellers initially pushed prices down, but buyers stepped in strongly to drive prices back up near the open, suggesting a potential bottom and bullish reversal.
Inverted Hammer: Also a bottom reversal pattern, the Inverted Hammer has a small real body at the lower end of the trading range, a long upper shadow, and a short (or absent) lower shadow. It suggests that buyers attempted to push the price up, but sellers resisted. However, the fact that buyers showed strength is a tentative bullish sign, requiring further confirmation.
Bullish Engulfing: This is a powerful two-candle reversal pattern. The first candle is bearish (red/black), and the second candle is bullish (green/white) with a real body that completely "engulfs" the real body of the preceding bearish candle. It signifies that buying pressure has overwhelmed selling pressure.
Piercing Line: Another two-candle bullish reversal pattern seen after a downtrend. The first candle is a strong bearish candle. The second candle opens below the low of the first candle but then closes more than halfway up the real body of the first bearish candle. This indicates a significant shift in sentiment from bearish to bullish during the second candle's session.
Morning Star: A three-candle bullish reversal pattern. It begins with a long bearish candle, followed by a small-bodied candle (which can be bullish or bearish and ideally gaps down from the first candle), and then a long bullish candle that closes well into the body of the first bearish candle (ideally gapping up from the second candle). The small middle candle (the "star") represents indecision, and the strong bullish third candle confirms the reversal.
Three White Soldiers: This is a strong bullish continuation or reversal pattern consisting of three consecutive long-bodied bullish candles. Each candle should open within the body of the previous candle and close at or near its high, making progressively higher highs. It signals sustained buying pressure.
Strategic Entry Timing:
Monitor Volatile Periods: Be particularly attentive to price action during the US evening and Asian morning hours.
Identify Key Support: Note the psychological levels and Fibonacci retracement zones where BTCUSD is expected to find support.
Scan for Bullish Candlesticks: Look for the formation of one of the aforementioned bullish candlestick patterns (or others like Dojis at support, Bullish Harami) at or near these support levels during the identified volatile periods.
Seek Confirmation: Wait for the candlestick pattern to fully complete at the close of its period (e.g., end of the hour for an hourly chart). Some traders wait for the next candle to trade above the high of the bullish pattern for further confirmation.
Volume Analysis: Higher trading volume accompanying the formation of a bullish candlestick pattern adds to its reliability, indicating stronger conviction behind the buying pressure.
Context is Key: Bullish reversal patterns are most potent when they appear after a discernible pullback within a larger uptrend, or at the end of a consolidation phase near strong support.
By combining the timing advantage of predictable volatility spikes with the confirmation signals from bullish candlestick patterns at technically significant support levels, traders can refine their entry strategies for BTCUSD.
6. Other Key Technical Indicators for Comprehensive Analysis
While the core observations provide a strong foundation, incorporating other technical indicators can offer a more holistic view of BTCUSD's market dynamics:
Moving Averages (MAs): MAs smooth out price data to identify trend direction and potential support/resistance. The 50-day, 100-day, and 200-day SMAs (Simple Moving Averages) or EMAs (Exponential Moving Averages) are widely watched. Price trading above these MAs is generally bullish. Crossovers, like a "golden cross" (50-day MA crossing above the 200-day MA), are considered strong long-term bullish signals. Conversely, a "death cross" (50-day MA crossing below the 200-day MA) is bearish.
Relative Strength Index (RSI): This momentum oscillator measures the speed and change of price movements, ranging from 0 to 100. An RSI above 70 is often considered overbought (suggesting a potential pullback), while below 30 is oversold (suggesting a potential bounce). However, in strong trends, BTCUSD can remain in overbought or oversold territory for extended periods. Bullish or bearish divergences between price and RSI (e.g., price making a new high while RSI makes a lower high) can signal weakening momentum.
MACD (Moving Average Convergence Divergence): This trend-following momentum indicator consists of the MACD line and a signal line. A bullish crossover occurs when the MACD line crosses above the signal line, suggesting increasing upward momentum. A bearish crossover is the opposite. The MACD histogram visualizes the distance between the MACD and signal lines; a growing positive histogram is bullish.
Horizontal Support and Resistance Levels: Beyond Fibonacci, historical price action creates distinct support (price floor) and resistance (price ceiling) levels. These are areas where the price has previously reversed or consolidated. Identifying these levels on daily and weekly charts provides a broader map of potential turning points.
Trendlines and Channels: Drawing trendlines connecting successive lows (uptrend line) or highs (downtrend line) helps visualize the dominant trend. Price often respects these lines. Parallel trendlines can form channels, providing dynamic support and resistance boundaries. A break out of a well-established trendline or channel can signal a significant change in trend.
Volume Analysis: Trading volume is a critical confirming indicator. A price rally accompanied by increasing volume is generally seen as healthy and sustainable. Conversely, a rally on declining volume may indicate weakening conviction. Spikes in volume during breakouts above resistance or bounces from support add validity to the price move.
Integrating these indicators with the primary observations about psychological levels, Fibonacci support, and candlestick patterns during volatile periods can provide a more robust and nuanced trading framework.
7. Risk Management in Bitcoin Trading
The high volatility inherent in BTCUSD, while offering profit potential, also necessitates stringent risk management. Without it, traders expose themselves to significant losses. Key risk management practices include:
Stop-Loss Orders: Always define an exit point for a trade if it moves against you. A stop-loss order automatically closes a position when the price reaches a predetermined level, limiting potential losses.
Position Sizing: Determine the appropriate amount of capital to allocate to a single trade based on your overall portfolio size and risk tolerance. A common rule is to risk no more than 1-2% of trading capital on any individual trade.
Risk/Reward Ratio: Before entering a trade, assess the potential profit (reward) versus the potential loss (risk). Aim for trades where the potential reward is significantly greater than the risk (e.g., 2:1 or 3:1).
Diversification: While this analysis focuses on BTCUSD, traders should consider diversifying their overall crypto portfolio if they are investors, rather than concentrating all funds in one asset.
Emotional Discipline: Avoid making trading decisions based on fear (FUD - Fear, Uncertainty, Doubt) or greed (FOMO - Fear Of Missing Out). Stick to a well-defined trading plan.
8. Potential Future Outlook (Based on Technicals)
Based on the current technical posture where Bitcoin shows strength above a key psychological level and finds support at Fibonacci retracement zones, the outlook leans cautiously optimistic, contingent on these supports holding.
Bullish Scenario: If BTCUSD continues to respect these support levels, particularly during periods of consolidation, and bullish candlestick patterns during volatile US evening/Asian morning hours lead to upward impulses, further upside is likely. A sustained break above immediate overhead resistance, confirmed by volume, could see BTCUSD challenge its next major resistance zones and potentially trend towards new highs. The ongoing defense of psychological levels is paramount for this scenario.
Bearish Scenario: Should the identified support levels (psychological and Fibonacci) fail to hold, the outlook could shift. A decisive break below these supports, especially on increased selling volume, would indicate that sellers have gained control. This could lead to a deeper correction, targeting lower support structures and potentially invalidating the current bullish sentiment. Increased volatility during the US evening/Asian morning hours could, in this case, exacerbate downward moves if bearish patterns emerge.
9. Conclusion
The technical analysis of BTCUSD reveals a market displaying notable strength, characterized by its ability to hold above a significant psychological price point and find robust support at Fibonacci retracement levels. This underlying resilience is a positive sign for bulls. The tendency for volatility to surge during the US evening and Asian morning trading sessions presents strategic windows for traders, particularly when seeking entries confirmed by validated bullish candlestick patterns at these critical support junctures.
A comprehensive trading approach should also integrate other indicators like moving averages, RSI, MACD, and volume analysis to confirm signals and understand the broader market context. While the current technical setup suggests a favorable environment for bulls, the inherent volatility of Bitcoin demands disciplined risk management practices. Traders must remain vigilant, adapting their strategies to the evolving price action and ensuring that any bullish conviction is continuously validated by the market's behavior at these key technical inflection points. The interplay between these technical elements will be crucial in determining BTCUSD's trajectory in the near to medium term.

BTC should test all time highs soon, if not set some new highs. I am not sure we will hit my $120-130k target from previous charts but we a have a nice bull flag here on lower time frames. The 4 hour seems to have momentum moving to the up side after seeing oversold conditions. It appears that we are moving off the orange up sloping support and breaking out of the green channel. Perhaps we will drop back into the channel and then run but only time will tell. Not financial advice, do your own research.
