BTC/USD 1H chartHello everyone, let's look at the 1H BTC chart for USD, in this situation we can see how the price moves over a strong growth trend line. However, let's start by defining goals for the near future the price must face:
T1 = 109164 $
T2 = 110207 $
Т3 = 111463 $.
Let's go to Stop-Loss now in case of further declines on the market:
SL1 = 107264 $
SL2 = 106314 $
SL3 = 105578 $
SL4 = 104781 $
Looking at the RSI indicator, we see
Return above the upper limit, which can cause an attempt to relax at the coming hours.
1-BTCUSD

Bitcoin Approaches the $110,000 Zone Once AgainBitcoin has seen a strong bullish surge in recent trading sessions, climbing more than 7% and now trading back above $108,000 per BTC. The buying bias has been consistently fueled by the announcement from Metaplanet, which plans to raise over $5 billion to acquire Bitcoin — a move that has temporarily restored short-term confidence in the market. As euphoria continues to build in the short term, buying pressure may become increasingly relevant in the upcoming trading sessions.
New Uptrend Line Forming
Following recent upward movements, a new bullish rebound has formed on the chart, initiating a consistent uptrend as price action nears historical highs once again. If buying pressure remains stable, this emerging trendline could gain greater relevance in the short term.
MACD
The MACD histogram continues to oscillate below the neutral 0 line, which suggests that the primary market momentum still lies in bearish territory. If the histogram keeps showing lower values, the previously dormant selling pressure could begin to regain strength.
Bollinger Bands Width
The line measuring the width of the Bollinger Bands remains at low levels, indicating a steady decline in long-term average volatility. If this behavior persists, it could signal the beginning of a consolidation phase in Bitcoin’s price during the next few sessions.
Key Levels to Watch:
$111,000 per BTC: Previous all-time high zone. A breakout above this level could strongly reactivate the bullish bias and open the door to a more aggressive uptrend in the short term.
$106,000 per BTC: Nearby support that may serve as a buffer against potential selling corrections in the sessions ahead.
$100,000 per BTC: A key psychological support level, aligned with recent local lows. Price action falling below this level could put the current bullish formation at risk.
Written by Julian Pineda, CFA – Market Analyst

Bitcoin Weekly Outlook – June 9, 2025Bitcoin ( BINANCE:BTCUSDT ) continues to maintain its bullish structure, now trading around $106.6K. While price action looks strong, the market is approaching a key resistance zone between $110K–$120K, with technical signals hinting at a possible short-term rejection before further upside.
🔍 Technical Overview
Current Price: $106,654
Resistance Zone: $110K – $120K
Support Zone for Pullback: $98K – $100K
200 EMA & 100 EMA: Still trending up and providing strong base support
The chart suggests a potential "rejection-retest-rally" structure forming, where BTC may temporarily pull back before making a fresh push toward new highs.
📊 Momentum & Indicators
Stochastic RSI on the daily timeframe recently bottomed and is starting to curl back up — a potential bullish shift in momentum
Volume remains stable — no signs of aggressive distribution or FOMO activity yet
💬 Sentiment & Structure
The current structure remains healthy, with HH-HL (higher high - higher low) formation intact. Market sentiment is optimistic but not yet euphoric, which is ideal for continued accumulation.
Short-term traders may look for a pullback opportunity near the $98K–$100K zone before re-entering.
🎯 Mid-Term Outlook
If BTC holds the $98K–$100K range during a pullback, it could act as a springboard toward the $120K target in the coming weeks.
✅ Summary
🔵 Bullish trend intact
📉 Possible short-term pullback before breakout
📈 Mid-term target remains: $120K
🚫 Avoid chasing breakouts — position wisely at key supports
Let the price come to you. Patience pays more than FOMO.

Is Bitcoin hearing for a ATHs, again?After reaching new highs around $112k, BTC has since retraced to support around $100k.
Currently reclaiming support around $105k, continued strength could see price reach ATHs in the coming days or weeks.
Losing support around $105k could signal a retest of $100k.
Referring to a previous post, my theory that we may not see sub $100k for the rest of the year is still in play, perhaps a signal of market strength despite the fear of the bull market ending.
Evidently, BTC is still holding up to all bullish expectations... Until proven otherwise.

BTCUSD analysis for this cycle TopBTCUSD analysis for this cycle Top
1. According to the Elliot wave it is the 5th wave of elliot theory
2. As per the time cycles Btc should define the top in the last quarter of this year possibility in (oct or nov)
3. And for the projection as always the Btc favourite patthen AB=CB is also in play.
4. Fib extension tool level 1.618
So as we can see if btc will play according to this analysis. As its always follows this same things again & again in all cycle. So we can expect the top somewhere around (165,000).

Bitcoin: Weekly Bullish Continuation🟠 The weekly divergence between the March 2024 and January 2025 peaks has driven the recent 3-month decline.
🔴 BTC is expected to make a weekly move higher, creating another divergence in the way.
🔵 BTC held above the 2024 peak range 73K without overlap, while the Stock RSI has completed a full reset, reinforcing the bullish momentum.
🟢 Outlook: Over the next 6 months, Bitcoin CRYPTO:BTCUSD is expected to rally into new ATH, with a potential target around 127K by October 2025.

09/06/25 Weekly OutlookLast weeks high: $106,812.33
Last weeks low: $100,372.93
Midpoint: $103,592.63
Billionaire spats and V-shaped recoveries, the beginning of June starts off in an interesting way. As President Trump goes forward with "The big beautiful bill" Elon Musk lets his feelings be known publicly sending shockwaves throughout markets, but what does this mean for Bitcoin?
The bill could add $3-5T in US government spending which is great for risk-on assets as there is more money able to flow into markets. I believe this exact thought process is visible on the chart in the V-shaped recovery we can see on Thursday. A clear sell-off as Elon Musk's anti government spending views clash with the bill, the uncertainty causes a sell the news moment, just as BTC comes into $100,000 the dip is bought up on the realization this means greater inflows are on the way, dips are truly for buying at this stage in the cycle and to me, this proves it.
In a more bearish view of the chart I would say the clear resistance is now weekly high at ~$106,000. Anything above that meets huge selling pressure with price discovery on the other side the market just doesn't seem to have the fuel as of yet to make the next step. However I believe it is just a matter of time and as M2 global money supply grows we get closer and closer to seeing new significant highs.
For this week CPI & PPI take place on Wednesday and Friday respectively. With CPI set to grow from 2.3% to 2.5% according to forecasts it will be interesting to see how markets react, expect short term volatility. Key battlegrounds for me are weekly high and midpoint.
Good luck this week everybody!

Bitcoin (BTCUSD) - Daily Price Consolidation Under ResistanceBitcoin (BTCUSD) price has been in a short-term downtrend since June 2025.
Price is currently consolidating under $106,000 resistance.
Watching to see if an evening star candle pattern prints on the daily chart, for a very-short-term pullback.
Support targets: $105,000, $104,000, $101,000, $100,000.
Resistance targets: $107,000, $109,000, $110,000, $112,000.
Bitcoin has been correlating with the USA stock market, tech stocks, consumer sentiment, and breaking news.

$IDUSDT 1D chart The BINANCE:IDUSDT 1D chart shows a potential breakout from its long downtrend.
Price recently bounced off a strong demand zone at $0.1785 and is now testing above the descending trendline.
If momentum holds, a move toward the $0.4004 target +131% is possible.
Watch for strong volume confirmation to validate the breakout.
DYRO, NFA

NQ tumbles?Good day traders, I don't know why but I get a bit scared when it comes to analyzing NQ. I always doubt myself with it.
On the weekly TF price is trading inside an order block and for the past two weeks price has visited the order block two times. In the two times that price revisited the order block it failed to close above the midpoint indicating the strength of the order block, going into the new week I am going to use the discount zone of the OB+ as my resistance.
On the daily TF before I say much, THERE IS A GAP, and price did not trade to it since opening high on the 12th May. That gap is my target and I want to see price go and fill that volume imbalance as ICT calls it.
Still on the daily TF...when you read price for past two weeks on NQ, you'll quickly come to a realization that price has been expanding higher since Tuesday 3rd June, but expanding to where?...well liquidity resting above the high of the candle booked on the 29th of May.
Now on the 4 hour TF things are opening up and price is becoming clearer and it goes to show the importance of multi time frame analysis. The lows of Tuesday and Thursday make the relative equal lows that are shown on the chart. The internal liquidity shown below is my short term target or TP1. The red triangle represents that 4H inverse FVG and once price is trading below the inverse any movement inside that inverse should show weakness!

Targets for Bitcoin Bullish outlook for BTC in the coming days IF we close above 106,1 k.
The 3 day candles indicates we could have a "Three White Soldier Pattern" coming up for BTC. It would be a pattern showing a trend reversal and potenially trigger the next trend to retest the old ATH. Although, I would like to see increase in volume to confirm this during the rest of the day to be more certain on this pattern.
Expecting NASDAQ:MSTR to get really bullish aswell if this occur.

BTC Neowave analysis - 8 JuneAssuming wave D has completed, two potential scenarios can be considered for the development of wave E:
1. Contracting Triangle Scenario:
We are currently in the final wave (wave e ) of the triangle. Upon its completion, either wave a of E or the entire wave E could be considered complete. Confirmation of this scenario would be a strong breakout below 105,000 with solid momentum. However, this scenario would be invalidated if the price moves beyond 107,000.
2. Diametric Scenario:
If the price surpasses 107,000 or if the breakout below 105,000 lacks sufficient momentum (e.g., takes more than one day to play out), this alternative becomes more plausible. It suggests a 7-leg structure. In this case, waves f and g are expected to take approximately one to one and a half days each.

BTCUSD: Will Go Up! Long!
My dear friends,
Today we will analyse BTCUSD together☺️
The market is at an inflection zone and price has now reached an area around 105,746.43 where previous reversals or breakouts have occurred.And a price reaction that we are seeing on multiple timeframes here could signal the next move up so we can enter on confirmation, and target the next key level of 106,033.06.Stop-loss is recommended beyond the inflection zone.
❤️Sending you lots of Love and Hugs❤️

Bitcoin plummets!!Good day traders, I am back with yet another update on BTC/USD. My last update on bitcoin what I was expecting price to do unfortunately did not happen as price was very weak, I had a FVG(SIBI) that I really wanted price to revisit and the two price levels that make up the SIBI are 107752 and 107149.
Now that both our sellside liquidity were taken does that mean price is now gonna look for the buyside liquidity? My honest opinion is I don't think because I said 97k is insight and I believe it can still happen and it will according to my HTF perspective.
On the daily TF we have clear sight of relative highs that we wanna see price take and that might happen today but my short term objective is the high that was booked on Tuesday. That Tuesday's candlestick has a very large wick and from my time learning with ICT's content, wicks contain a lot of price data that can be used either for entries or exits.
4H- Here we had a shift in market structure lower on Thursday but price has been bullish ever since the shift happened. On this respective TF we have equal highs too, and ICT teaches us to always focus our attention on them mainly because price looks for liquidity and imbalances on the 4 hour TF...should we look closely on the left of our screens or chart, there is an order block from the wick I mentioned above. Again what are the rules of an order block?..
FROM TOMORROW PRICE WILL START TO PLUMMET!!

Last 133 days of the bull market!This idea gives more details about the pint in the cycle we are at right now. When measuring the duration between halving and tops we usually see the best in ~500 days after the halving. Following my previous idea about topping in October you can find the same pattern translating in 546 days after last halving. If this proves right , we are about 133 days before top. At this point we should see fireworks till October. In blue is price action in those 133 in 2017 and in yellow 2021, according to the btc nature of diminishing returns we should see peaks bellow those years.Cheers

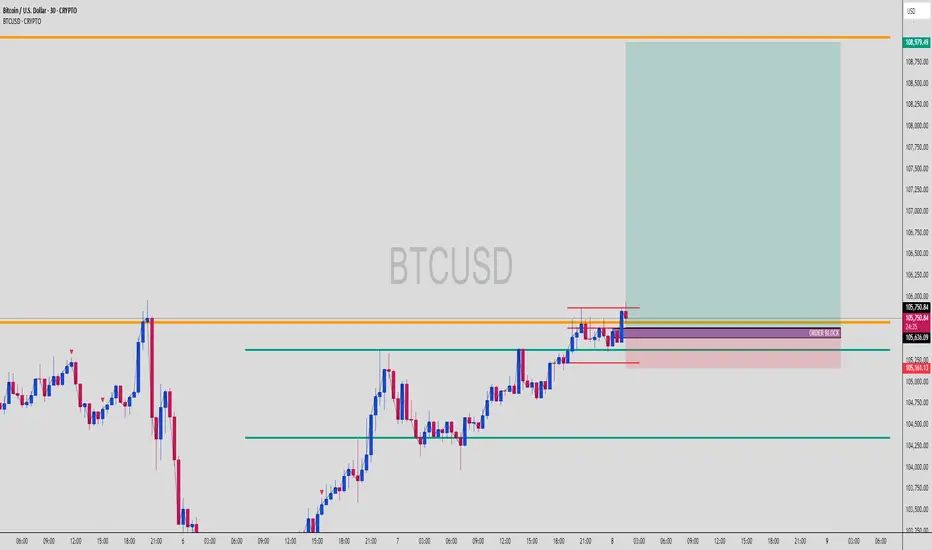
BTC Long Triggered from OB, Smart Money Played This Perfectly!BTCUSD | 30-Min Chart – Long Setup Execution
Bitcoin has just activated a clean long entry from a well-defined bullish Order Block at a key structural level. This move follows textbook Smart Money Concepts (SMC) — the kind of play institutional traders thrive on.
🔍 Setup Breakdown:
🔹 Order Block (OB):
Identified near 105,636 — aligned with previous support
Precise reaction zone after consolidation, showing institutional interest
OB respected after fakeout below short-term liquidity
🔸 Liquidity Sweep:
Quick wick below 105,250 acted as a stop hunt for early shorts
Price reclaimed the OB immediately after → classic Smart Money trap
🟩 Entry Zone (OB Zone):
105,636–105,250 range
Confluence with minor bullish imbalance and structure support
Price barely tapped the zone before launching higher
📈 Upside Target:
TP marked at 108,979 — prior liquidity pocket and untested highs
Large green zone shows ideal RR (approx. 1:6)
First obstacle: minor resistance at 106,750, but momentum looks strong
🟥 SL Placement:
Safely below OB at ~105,161
Below liquidity sweep zone = strong invalidation
🧠 Why This Setup Works:
✔ Price moved impulsively into the OB
✔ OB lines up with previous structure support
✔ Rejection + strong bullish candle = confirmation
✔ No significant resistance until higher liquidity zones (108K+)
This is classic SMC execution: trap, sweep, OB tap, and send. Let retail panic — we follow footprints.
💬 Ninja Wisdom:
"Smart Money doesn’t chase price — it traps and collects."
This was a clean confirmation of a bullish continuation after reclaiming control from liquidity grabs.
📍 Save this chart – this setup could explode into a full bullish swing
💬 Drop your thoughts: Are we headed to 109K or pausing at resistance?
👣 Follow @ChartNinjas88 for more sniper-level BTC/ETH/Gold plays
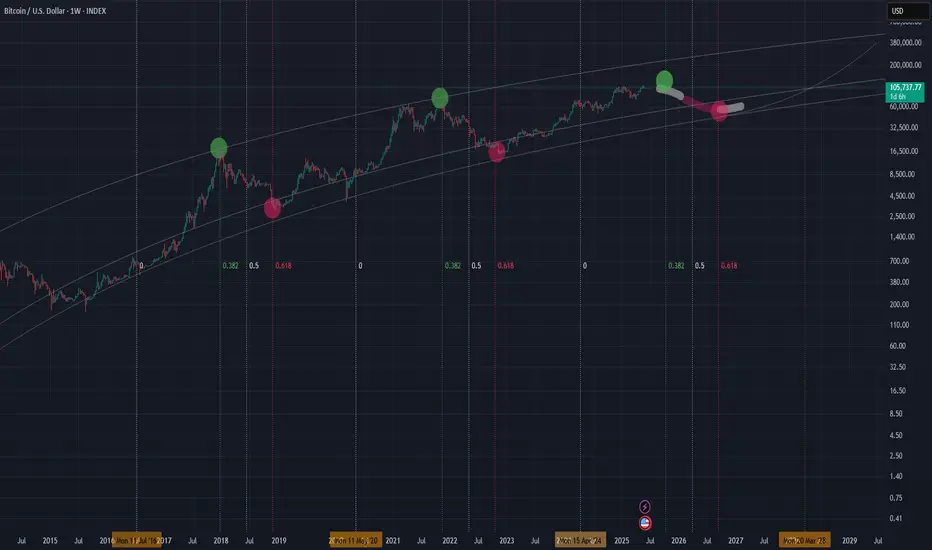
Trend Base Fib Time suggesting getting out before October 2025!I have been warning you that time is running and a few months left before things start cooling off. This tool is trend base fib time , measured from one halving till the next one. I assumed halving in 2028 at some point in march so this result in a target of October to be the month matching with the 0.382 when peaks use to be found. The 0.618 would be the one for catching the bottoms around Sep 2026. Secure some gains and buy back at next bear market lows close to 40k. Cheers
Volatility period has begun.
Hello, traders.
Please "Follow" to get the latest information quickly.
Have a nice day today.
-------------------------------------
We need to see if the price can hold above OBV Low.
We need to see if the price can hold above OBV High or HA-High.
It is showing a downward trend while failing to rise above OBV Low.
If this continues to decline further, we should check if the HA-Low indicator is newly created.
This volatility period is expected to start around June 6 (June 5-7) and continue until around June 13 (June 12-14).
If the auxiliary indicator OBV falls below the Low Line, there is a possibility of another large decline.
At this time, the key is whether it can receive support and rise near 99705.62.
If not, it is expected to select the trend again when it meets the M-Signal indicator on the 1W chart.
The basic trading strategy is to buy at the HA-Low indicator and sell at the HA-High indicator.
If you apply this basic principle, you buy when it rises above 102049.52 and shows support, and sell near 104938.72.
For this basic principle to be applied normally, OBV is rising and the StochRSI indicator is rising.
However, it is better if the StochRSI indicator has not entered the overbought zone if possible.
However, if it is resisted and falls at the HA-Low indicator, it is likely to show a stepwise downtrend, and if it is supported and rises at the HA-High indicator, it is likely to show a stepwise uptrend.
Therefore, when testing support near the HA-Low indicator, if the OBV shows a downward trend and the StochRSI indicator shows a downward trend (if possible, a downward trend in the overbought area), the possibility of a stepwise downtrend increases.
The end of the stepwise uptrend that occurs after meeting the HA-Low or HA-High indicator is a downtrend, and the end of the stepwise downtrend is an uptrend.
Therefore, the trading method should be a fractional trading method.
I think the important thing in spot trading is how much you increase the number of coins (tokens).
Of course, depending on the situation, it may be better to make cash profits.
Since the coin market allows trading in decimal units, it is a useful investment market for increasing the number of coins (tokens).
Therefore, we can increase the number of coins (tokens) corresponding to profits while conducting trading according to the basic trading strategy.
That is, when the price rises by the purchase amount for each purchase price, sell it and leave the number of coins (tokens) corresponding to the profit.
At this time, you should be careful to include the transaction fee in the purchase amount and sell it.
The coins that are good for increasing the number of coins (tokens) corresponding to the profit rather than cash profit are BTC or ETH.
Additionally, BNB is also possible.
I think it is better to obtain cash profit if possible for the rest of the altcoins.
However, if there is a coin (token) that you think you want to increase in the medium to long term, you can increase the number of coins (tokens) corresponding to the profit by increasing the number of coins (tokens).
-
Thank you for reading to the end.
I hope you have a successful transaction.
--------------------------------------------------
- This is an explanation of the big picture.
(3-year bull market, 1-year bear market pattern)
I will explain more details when the bear market starts.
------------------------------------------------------

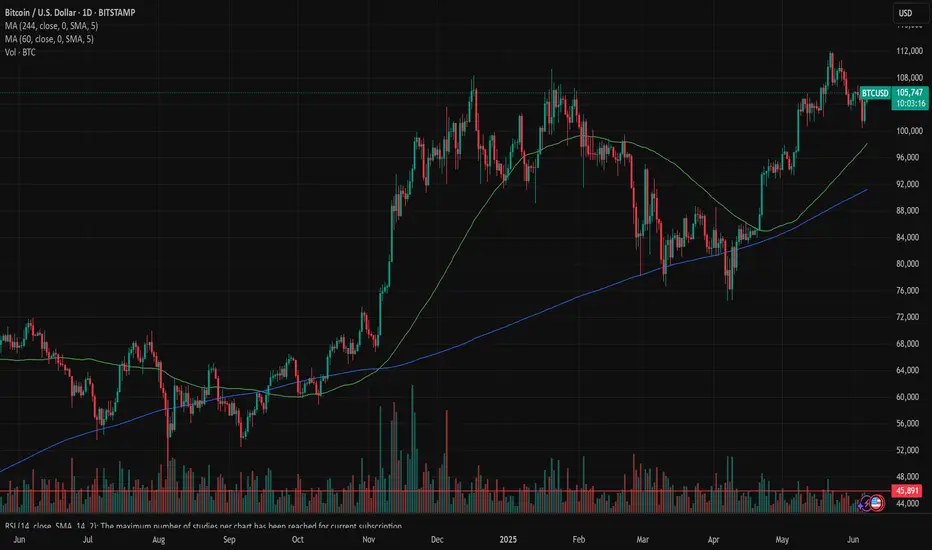
Bitcoin: will $105K prevail or not?After a spike in price on May 22-23rd, the price of BTC continued with a consolidation, moving the price toward the lower grounds. Fridays stronger than expected US jobs data returned the optimism among market participants, bringing back the price of BTC toward the levels around the $105K, where BTC is ending this week. The lowest weekly level reached was $100.754 on one occasion.
The RSI was pushed at levels below the 50 level, around 45, but is still ending the week at 52. This is an indication that market participants are slowly starting to eye the oversold market side. The MA 50 continues to strongly diverge from MA200, without an indication that the cross might come anytime soon.
Since the peak level was reached as of the end of May, the BTC was traded with lower highs and lower lows for the rest of the period. This is a clear indication that some short consolidation is ahead. In the technical analysis this formation is imposing the question, where this trend ends? One possibility is that BTC will again test the $100K, which was the lowest level reached during the previous week, on a short occasion. This level could also be treated as a psychological level for investors. The second option would be a break of the $105K level, which is currently tested, to the upside, where BTC will seek higher grounds, probably around $108K. Both scenarios currently have equal probabilities. Which one BTC will choose, it will be clearer at the start of the week ahead. Until then, the $105K is the level to watch closely, will it prevail or not?
Biggest Altcoin Season of this Bull Cycle is Coming! As you can see, there is a Massive Ascending Broadening Wedge forming on the #Bitcoin Dominance!
Currently dominance is located almost near the top of the wedge. More likely we will see its ascend up to 67% which will be marked as top before the dump.
The breakdown of this wedge will signal a beginning of a HUGE Altcoin Season (comparable to Autumn of 2021 or Autumn of 2023) when not only small cap, but major altcoins will be sent to new highs. With high probability it will begin in August and will last till December this year.
Mark my words & be prepared for the last opportunity of this bull cycle!

BTC Is Replaying a Bullish Fractal >>> Are You Watching?Hello guys!
I see a deja vu here! Let’s look at the historical daily chart (Jan–May 2025):
What happened?
Initial Drop (Yellow Oval): Bitcoin approached a key S&D zone but didn't touch it, triggering a short-lived bounce before dropping again.
Second Drop (Red Ovals): This time, price precisely touched the demand zone, triggering a clean bullish reversal.
What followed was a strong trend breakout, sustained higher lows, and an eventual surge past prior resistance levels.
Current 4H Chart Setup: A Mirror Image?
Yellow Highlight: Once again, we saw a bounce that didn't quite touch the key demand zone ($98K–$100K).
Red Zone Prediction: If this mirrors the historical move, the price is likely to return and touch this S&D area before launching a bullish leg.
Blue Path Projection: A sharp reversal is expected post-touch, aiming toward $111K–$113K as the next key resistance zone.
The descending trendline adds confluence
___________________
History Doesn’t Repeat, But It Often Rhymes
Based on this fractal analysis, Bitcoin is likely forming the same bullish base seen earlier in 2025. The setup hinges on one key event: a return to the $99K–$100K zone, where demand is likely to step in aggressively.
If the pattern repeats, the current market may offer one last high-reward long opportunity before a parabolic rally.

BTC is basically SPX with a higher multiplesince Wall Street got in we actually got significantly more correlated (obviously)
(it wasn't as much prior to 2021)
BTC has basically become SPX with a higher multiple.
Do with that what you will

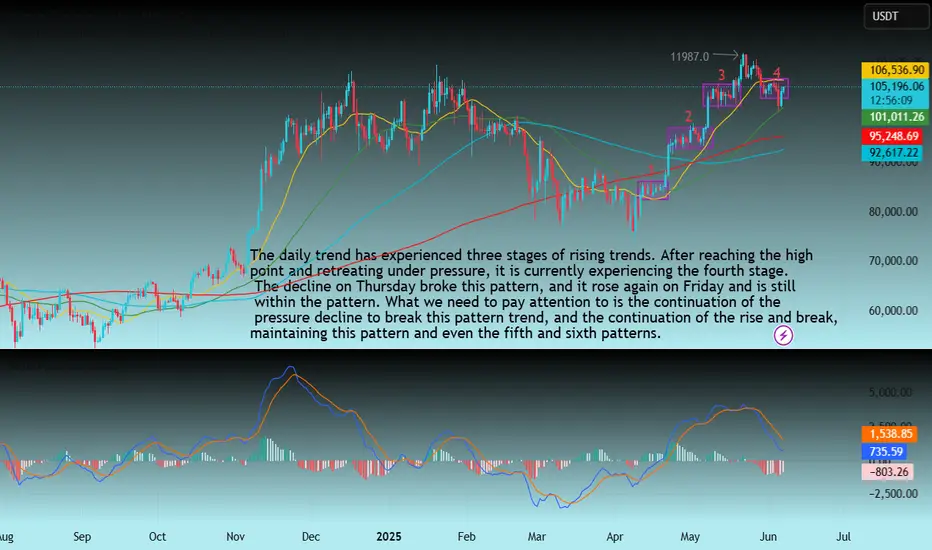
Technical analysis of BTC contracts (outlook for next week)Technical analysis of BTC contract on June 7 (next week outlook):
The weekly trend, after the price hit the high point of 112000 area, it retreated under pressure. The current K-line pattern is negative, but the price is still at a high level, which also exacerbates the overall trend of volatility. The daily price was fluctuating downward before Friday. The impact of yesterday's data caused the price to rise, which seemed to break this trend, and it also became contradictory. The technical indicators of the four-hour chart and the hourly chart changed very quickly, and there was no reference signal for the medium and long term; in general, the current trend will continue the oscillating pattern, with the upper pressure position in the 107000 area and the low point support position in the 100600 area;