Bitcoin: $150,000, $180,000, $200,000 Or $220,000This is a question that nobody has been able to answer in the past 6 months: Will Bitcoin peak at $220,000 or $150,000?
Will the next All-Time High happen at $150-$160,000 or $180,000?
It is hard to say right now isn't it? But, consider this, if a new All-Time High will be hit within a few short weeks, or days, then there is plenty of room for Bitcoin to reach levels toward 200K. So maybe 150-160,000 is an easy target, it can go higher...
Now, it is true that we can guess and speculate about $250,000 or $220,000 or more, but there is no doubt that the next move is a rise, a strong rise, a continuation of the bullish move that started just a month ago. Five consecutive weeks closing green. As bullish as it gets.
Are you a SHORT trader?
You are about to be liquidated. There is till time, close your position now because Bitcoin is going up!
This is a friendly reminder.
Load up on the Altcoins.
Thanks a lot for your continued support.
Namaste.
1-BTCUSD

1 Billion USD+ SHORTs Liquidation —Bitcoin BullishGood morning my fellow Cryptocurrency trader, I hope you are having a wonderful day.
We all know that life is not a game of checkers, it is more like fifth dimensional chess. It can be easy once we master how to play but it is actually hard to learn the game. The same goes for trading Cryptocurrencies, it is not an easy game.
Billions of dollars are about to be liquidated from SHORT traders. The All-Time High liquidation. This is a friendly reminder.
» If you are bullish, congratulations. You are good and you will do great.
» If you are bearish, there is still time, you don't have to lose knowing beforehand what will happen next.
The whales and market manipulators are setting up a trap right now, but they can never fool you because you know best.
What do you know?
» You know Bitcoin to be bullish because it is easily trading above 100K.
» You know Bitcoin is rising because it has been moving up since the 7-April low.
» You know a continuation will soon follow because we have signals coming from the Altcoins, the Stock market and Gold. Everything is pointing up.
I know you are smart and thank you for coming back and reading again. In only a matter of days, billions of dollars worth of SHORTs will be liquidated. Make sure not to be caught on the wrong side of the fence.
» Bitcoin is going up.
Namaste.


BTC | New ATH Incoming | + 135% ??A very interesting fractal from 2021 lead to a 135% increase - and a new all time high.
Bitcoin has been following similar patterns to the bullish twin-peaks in 2021. After a multi-month correction, the price proceeded to increase another 135% over the next few months. Some weeks fast, and some weeks sideways.
Is it possible that BTC follows a similar pattern - and increase another 135%, all the way to 170k?
Hec, I'd even be happy with just a 100% ! That would lead us up to around 149k, which can also be considered a phycological resistance zone.
While you're here! Check out this post on PEPE:
_________________
BINANCE:BTCUSDT

GME - Uncertainly certainThe future is simply bright, from a top down view, GME is executing on the turnaround, by betting on Bitcoin. Simple as that, the future trajectory of this stock will be heavily tied to the Digital Gold, which is a good thing.
This turnaround also exposes Gamestop to future volatility events happening in the Cryptocurrency world. Up or down, once the pile of coins gets big enough, GME will benefit... Or go through intense selling periods (à la MSTR).
My proposed targets are :
- $65 August 2025
- $137, January 2026
- (-60% heavy correction through most of 2026)
- $174+, January 2027 this date being my personal MOASS date : January 27th 2027.
Confident in the leadership, confident in the market short and medium term. Those two factors could launch us into the second leg of this bull market, we may see GameStop perform exceptionally well, even on words and promises. Thankfully video games will sell themselves (GTA 6), consoles will too (Switch 2), but GME is finally about to become a lot more than that.
Don't sleep on it because it's a meme stock, these perform the best when the market goes banana on stimulus and deflation. If everything hits at the right time, then this 21% drop on SPX we've gone through in March and April of 2025 was the best dip buy ever.
GME forever bottomed in 2020, and since they started executing on the turnaround, the ceiling has been truly raised, although it was always high from the get-go :D
I must say, about that $174+ I honestly think, it's much much higher than that, I'm expecting this target to be busted through quite easily, ultimate target : $501. If, and if we get there, early 2027, I'm looking at a quite fantastic event, some kind of big news will shake up the markets, but GME, with a little bit of help from BTC could go through inversing main indices.

BTCUSD: This is a one way trip to $150k.Bitcoin is rising towards the overbought barrier on its 1D technical outlook (RSI = 68.126, MACD = 4169.000, ADX = 23.891) and that has rearely been a problem in the past as the market tends to thrive on overbought conditions. The minimum rally it delivered after a 1W MA50 rebound (like the one it is on now) has been +100%. TP = 150,000 by the end of summer.
## If you like our free content follow our profile to get more daily ideas. ##
## Comments and likes are greatly appreciated. ##

The latest Bitcoin analysis strategyThe price has rebounded above the 0.786 Fibonacci retracement support level at $102,400. The EMA trend indicators show upward divergence, with the EMA15 fast trend line continuing to act as support and extending higher, expected to provide underlying support for the candlesticks near $101,000. A bullish channel has formed on the Bollinger Bands, but the price is 受阻 (resisted) at the upper band pressure level of $106,300, increasing the probability of short-term sideways trading.
Candlestick patterns indicate the price has consistently traded at the top of the EMA trend indicators, with bullish momentum starting to contract and top-side pressure showing a clear downward shift. The MACD has continuously reduced trading volume while approaching the zero line, with DIF and DEA converging, signaling that a top divergence pattern has spread to the medium-term trend. During the Bollinger Bands' sideways phase, the upper band resistance is at $105,200, and the lower band support is at $101,800.
The latest U.S. inflation data came in below expectations, strengthening market expectations for Federal Reserve rate cuts—a factor typically boosting risk asset performance. Additionally, the initial progress in U.S.-China trade negotiations, where both sides agreed to reduce tariffs, has improved geopolitical conditions and provided further support for Bitcoin.
you are currently struggling with losses, or are unsure which of the numerous trading strategies to follow, at this moment, you can choose to observe the operations within our channel.

BTC/USDT Scalping Opportunity – Fib & Trendline Confluence!As analyzed, BTC is sitting perfectly at the Fibonacci level combined with trendline support – a strong confluence zone for a long scalp.
📌 Entry 1: 101.8k
📌 Entry 2: 101.6k
🛡️ Stop Loss: 1hr candle close below 101.4k
🎯 Target: 300 – 1000 points
This zone has been tested and respected multiple times. We either bounce strong from here or hunt the liquidity at 100.7k before reversal. Both plans are marked in green – stay sharp!
#Bitcoin #BTCUSDT #Scalping #CryptoTrading #PriceAction #Trendline #FibStrategy

BTCUSDT, We are in Up TrendHello everyone
According to the chart that you can see the price movement was moved exactly to the route the we analysed and shown weeks ago and according to this time , that analysed is valid
If you need some help you can send us messages
Good Luck
AA
BITCOIN Analysis (1H)We have a CHoCH (Change of Character) in the internal structure, and a bullish order block has been cleared. Price is currently within a supply zone, and there is a resistance line above the current price level.
It appears that price is aiming to pull back to lower support zones. These lower zones are fresh and unmitigated, so we expect that upon reaching them, price may bounce back upward toward the previous high.
A 4-hour candle closing above the invalidation level would invalidate this bias.
Do not enter the position without capital management and stop setting
Comment if you have any questions
thank you

ETH ANALYSE We have two key levels to watch on ETH:
- Either the price reacts upwards on the $2401 level in H4,
- Or it falls further and reacts at the $2,121 Daily level.
Either way, the fall should not last too long.

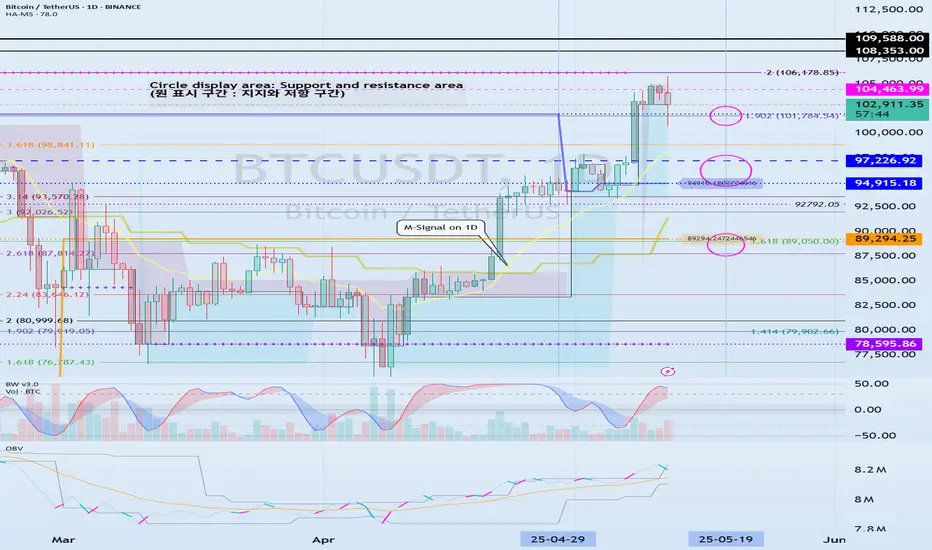
Important section: 101947.24-106133.74
Hello, traders.
If you "Follow", you can always get new information quickly.
Have a nice day today.
-------------------------------------
(BTCUSDT 1D chart)
It has touched the Fibonacci ratio 1.902 (101784.54) and is rising.
The key is whether it can receive support near the StochRSI 50 indicator (102971.99) and rise.
If not, it can fall to the 94915.18-97226.92 area.
Since the HA-Low indicator is formed at the 89294.25 point, it is important whether the price can be maintained above that point.
If the StochRSI indicator falls below the overbought range and then rises while moving sideways around the Fibonacci ratio range of 1.902 (101784.54) ~ 2 (106178.85), it is expected to renew the ATH.
Even if it falls more than expected, if it rises along the M-Signal indicator on the 1D chart, it is highly likely to renew the ATH.
----------------------------------------------------------
I will explain the newly added indicators, StochRSI 50, StochRSI 80, and StochRSI 20.
The disadvantage of interpreting the StochRSI indicator added as an auxiliary indicator is that it cannot determine the price movement.
Because of this, when interpreting the StochRSI indicator so far,
- Whether it is in the overbought or oversold zone,
- Whether StochRSI is above or below the 50 point,
we interpreted it as above.
Therefore, we added the price movement to the StochRSI indicator to check the movement more accurately.
-
The StochRSI 50 indicator is literally created when the StochRSI indicator passes the 50 point.
Therefore, we need to think about a response plan based on the price StochRSI 50 indicator.
-
The fact that StochRSI 80 is created means that the StochRSI indicator has risen above 80.
Therefore, in order to continue the upward trend, StochRSI must rise above 80.
If StochRSI 80 is not created and only StochRSI 20 is created, the upward trend will occur when the price is maintained above the StochRSI 50 indicator.
-
The fact that StochRSI 20 was created means that the StochRSI indicator has fallen below 20.
Therefore, in order to continue the downtrend, it must fall below StochRSI 20.
If StochRSI 20 is not created and only StochRSI 80 is created, the downtrend will occur when the price is maintained below the StochRSI 50 indicator.
-
Thank you for reading to the end.
I hope you have a successful trade.
--------------------------------------------------
- This is an explanation of the big picture.
I used TradingView's INDEX chart to check the entire range of BTC.
I rewrote the previous chart to update it by touching the Fibonacci ratio range of 1.902 (101875.70) ~ 2 (106275.10).
(Previous BTCUSD 12M chart)
Looking at the big picture, it seems to have been following a pattern since 2015.
In other words, it is a pattern that maintains a 3-year bull market and faces a 1-year bear market.
Accordingly, the bull market is expected to continue until 2025.
-
(Current BTCUSD 12M chart)
Based on the currently written Fibonacci ratio, it is displayed up to 3.618 (178910.15).
It is expected that it will not fall again below the Fibonacci ratio of 0.618 (44234.54).
(BTCUSDT 12M chart)
I think it is around 42283.58 when looking at the BTCUSDT chart.
-
I will explain it again with the BTCUSD chart.
The Fibonacci ratio ranges marked in the light green boxes, 1.902 (101875.70) ~ 2 (106275.10) and 3 (151166.97) ~ 3.14 (157451.83), are expected to be important support and resistance ranges.
In other words, it seems likely to act as a volume profile range.
Therefore, in order to break through this section upward, I think the point to watch is whether it can rise with support near the Fibonacci ratios of 1.618 (89126.41) and 2.618 (134018.28).
Therefore, the maximum rising section in 2025 is expected to be the 3 (151166.97) ~ 3.14 (157451.83) section.
To do that, we need to look at whether it can rise with support near 2.618 (134018.28).
If it falls after the bull market in 2025, we don't know how far it will fall, but considering the previous decline, we expect it to fall by about -60% to -70%.
So, if the decline starts near the Fibonacci ratio 3.14 (157451.83), it seems likely that it will fall to around Fibonacci 0.618 (44234.54).
I will explain more details when the downtrend starts.
------------------------------------------------------
SPY/QQQ Plan Your Trade For 5-15 : CRUSH PatternToday's CRUSH pattern could play out as a very big downward price move if the 578-580 level is broken. CRUSH patterns are usually very large-range price bars. Yes, they can be to the upside as well (depending on recent trending).
A CRUSH pattern is usually in the opposite direction of recent trends. Thus, I believe today's CRUSH pattern will be to the downside.
Although I believe today could be very exciting for traders, I urge all traders move with caution in the early 30min to 60min of trading today. I believe the SPY/QQQ will attempt to establish a range (early trading range), then work to break away from that range.
Traders should be very cautious of getting married into a direction/position in early trading. Let the market tell you where it wants to go.
Gold and Silver appear to have setup the Ultimate Low overnight. Now, we'll see if metals can move higher throughout the rest of this week and build a base for the next phase higher.
BTCUSD seems to have started to roll over (top), but I urge traders to stay cautious of the current upward FLAGGING trend. Until BTCUSD breaks below $96-97k, I would still consider it to be trending upward.
Going to be a busy day for me. Stay safe as I'll be on the road most of the morning.
GET SOME.
#trading #research #investing #tradingalgos #tradingsignals #cycles #fibonacci #elliotwave #modelingsystems #stocks #bitcoin #btcusd #cryptos #spy #gold #nq #investing #trading #spytrading #spymarket #tradingmarket #stockmarket #silver

BTCUSD UPDATE 15-05-2025This chart shows the Bitcoin (BTC/USD) price action on the 1-hour timeframe, published on TradingView.
Key Details:
Chart Pattern: A distribution phase is visible, forming what appears to be a double or triple top pattern in a resistance zone (highlighted in yellow at the top), which typically signals potential reversal or bearish breakdown.
Current Price: Around $102,265, down by 1.22%.
Support and Resistance Zones:
Resistance: Around $105,600–$105,643
Support: Around $96,000–$97,322
Bearish Projection:
The blue arrow indicates a bearish move is expected, targeting the support zone near $96,000.
This suggests a short position setup, possibly expecting profit-taking at the support zone.
Price Ranges Marked:
Red and green shaded boxes indicate stop-loss and take-profit zones respectively, with risk-reward considerations.
This chart suggests a bearish sentiment in the short term, with the analyst expecting a decline to the lower yellow zone after multiple failed attempts to break resistance.
Let me know if you want technical indicators or further analysis.

Looks like the rally is going on... BTCUSDT Uptrend Analysis 📈
BTCUSDT is currently around $102,000 and in a short-term downtrend. Here are some key points to watch:
- Buying Opportunities: The $100,600 - $99,600 range may present a good buying opportunity. 💰
- Critical Levels: If the price drops below $99,400, there’s a risk of falling to $97,000. Investors should stay cautious. ⚠️
- Uptrend Targets: For the uptrend to continue, the $108,000 - $112,000 area looks like a suitable take profit zone. 🚀 After that, the $120,000 range could be targeted.
It's essential for investors to closely monitor market movements! 📊

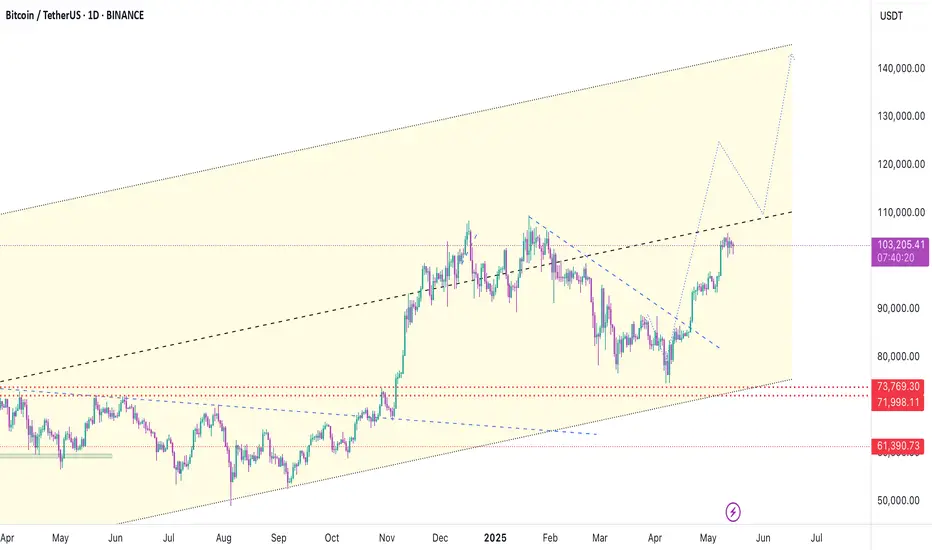
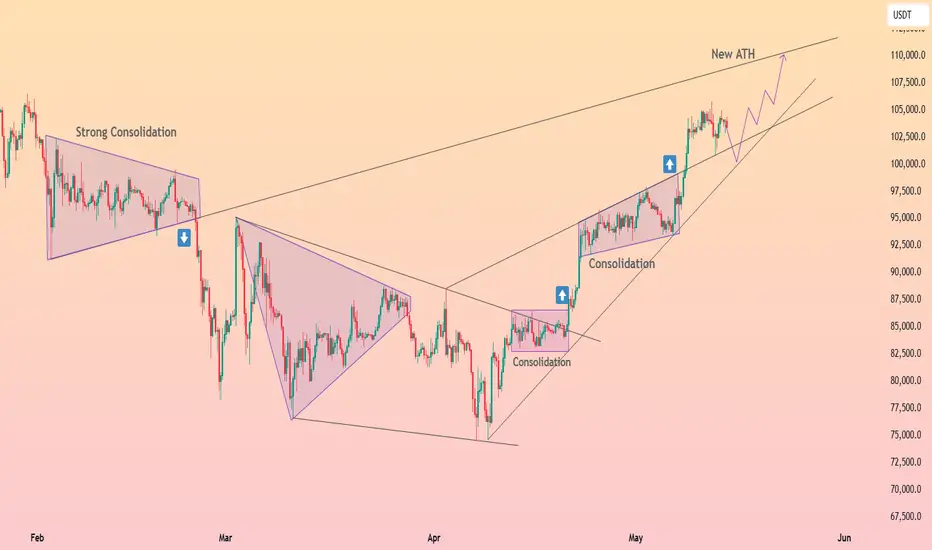
HolderStat┆BTCUSD channel run to 115kAfter February’s strong consolidation wedge cracked, Bitcoin price rebounded, carving a fresh ascending channel that sits snug on wedge support above 100 k. Each mini‑consolidation has resolved higher, and the current leg projects into the 112‑115 k new‑ATH rail drawn on the chart. Pullbacks toward 100‑102 k are structurally healthy so long as the lower trend‑line stays intact, keeping the broader BTC breakout narrative alive.
BTCUSD; Heikin Ashi IdeaBINANCE:BTCUSD
Possible continuation at marked area, or we will have a correction to lower daily demand area where impulsive move started.

May 14 Bitcoin Bybit chart analysisHello
It's a Bitcoinguide.
If you have a "follower"
You can receive comment notifications on real-time travel routes and major sections.
If my analysis is helpful,
Please would like one booster button at the bottom.
This is the Nasdaq 30-minute chart.
There is no separate indicator announcement today.
I conducted a brief analysis with rough movements.
The 3-hour chart MACD dead cross pressure is in progress,
and from the purple finger at the top to number 1,
it is the best short position entry section of the day,
and from the orange resistance line breakthrough, it is an upward trend.
*The 21.1K red finger at the bottom is a long-term strategy,
and if there is a rebound within the purple support line without touching the entry point,
it will rise vertically.
The short-term pattern may be broken from the 2nd section,
and it is a downward sideways movement to the bottom -> the 3rd section is the 1+4 section.
I applied it to Bitcoin as is.
This is a 30-minute chart for Bitcoin.
Since there is no Nasdaq indicator announcement, we proceeded with trend following.
In the case of Bitcoin, the 12-hour chart MACD dead cross was engraved,
and the lower Bollinger band was touched first.
On the left, with the purple finger,
101.1K long -> 104.283.2 dollar short switching
I connected the strategy as it is.
*When the blue finger moves,
It is a two-way neutral
short->long switching strategy.
1. 104.326.6 dollar short position entry section / stop loss price when orange resistance line is broken
2. 103,278.1 dollar long position switching / stop loss price when green support line is broken
If the strategy is successful,
section 1 can be used as a long position re-entry section. (Purple parallel line maintenance condition)
I proceeded tightly up and down for fear of missing the entry point.
Instead, if I explain in detail,
The movement within 1 at the top and 2 at the bottom is a sideways section,
and it is a section where a trend can emerge when breaking out or breaking out.
For those who have been holding a short position since yesterday,
I think it would be good to operate with a stop loss price when breaking out of the orange resistance line, just like today's strategy.
If it comes down right away without touching the 104.3K short entry point,
the final long position is waiting in the 2nd section.
The stop loss price is the same.
If it breaks out of the bottom section today, it can be directly connected to the 3rd section at the bottom,
so those who are operating a long position should be careful.
Up to this point, I ask that you simply refer to and use my analysis,
and operate safely with principle trading and stop loss price. Please support the 4 consecutive perfect challenges
Thank you

BITCOIN 's 'Final 6 months rally' kickstarts the Altseason!This isn't the first time we show you this chart but it couldn't be more relevant than today. We have established on previous analyses how Bitcoin (BTCUSD) has most likely started the final rally of its Cycle, historically the parabolic rally of the last 6 months of the Bull Cycle that ends with its Top.
The addition of today's analysis is that with Bitcoin Dominance (orange trend-line) approaching its 8-year Lower Highs trend-line, this 'Final 6 months rally' of BTC is what technically also starts the Altseason. This is when lower cap coins see massive gains compared to the high cap ones.
At the same time, we get one more confirmation of why a $150k BTC Target is realistic, as by the end of 2025, this price would still be on the 0.618 Fibonacci level of the 8-year Fib Channel Up, a rather 'bad case' scenario based on this pattern.
So what do you think? Will BTC's Final 6 months rally spark a massive Altseason too? Feel free to let us know in the comments section below!
-------------------------------------------------------------------------------
** Please LIKE 👍, FOLLOW ✅, SHARE 🙌 and COMMENT ✍ if you enjoy this idea! Also share your ideas and charts in the comments section below! This is best way to keep it relevant, support us, keep the content here free and allow the idea to reach as many people as possible. **
-------------------------------------------------------------------------------
💸💸💸💸💸💸
👇 👇 👇 👇 👇 👇

Bitcoin Update – Expecting a Correction to $96K! Crypto traders! 💙 Bitcoin looks ready for a pullback to our key level at $96,000. I’m waiting to BUY in this zone, but if the level breaks and price stabilizes below, I’ll consider a SHORT trade to our next target (as previously defined).
⚡️ Pro Trading Tip:
✅ If you’re a trader, always have a strategy—be ready for any scenario!
✅ For long-term investors, accumulate on dips near support levels.
📌 Risk management is key! Double your position size at each lower level to drastically reduce your average entry price.
💎 The Golden Rule of Crypto Success:
🔹 Keep losses small & disciplined.
🔹 Let your winners run to maximize gains!
🔹 The market is unpredictable, but YOU control your capital!
🚀 Bitcoin never sleeps—what’s your play?
👇 What’s your take on this move?
For detailed entry points, trade management, and high-probability setups, follow the channel:
ForexCSP

Decision Point at Major Trendline 📊🚀 Bitcoin Today: Decision Point at Major Trendline ⚡📈
Hey Traders!
Bitcoin is once again at a critical decision point. The price is currently holding above the key ascending trendline around 101,970, and the market is giving us a clear message: Hold and Bounce... or Break and Drop.
If BTC can sustain above this trendline, we maintain a bullish bias with a 70% probability 📈 of reaching our first major target at 105,962. Break that, and the path to 113,000 opens up nicely!
However, stay vigilant! A confirmed break below 101,970 could invalidate the bullish setup and expose lower targets around 99,985 and 97,770.
📅 The next few candles will be decisive—perfect time to practice patience and disciplined entries.
Let’s see if BTC can hold the line and give us that bullish continuation we’re waiting for!
One Love,
The FXPROFESSOR 💙

Bitcoin Today- Time to Pump?📊🚀 Bitcoin Today 🌍🔥
Hey Traders!
Bitcoin is holding critical support at 101,970, and the probability for a bullish reversal remains high at 70% 📈. If momentum picks up, we’re eyeing targets at 105,000 and possibly a stretch toward 113,000.
However, remain cautious! If BTC loses the 101,970 level, downside targets are set at 99,000 and even 97,000. Manage your risk accordingly!
🔹 On the fundamental side, global events like Trump’s negotiations in Saudi Arabia and Qatar, along with Ukraine peace talks, are fueling optimism. Stock markets have already reacted—crypto might be next in line!
💡 Bitcoin Dominance (BTC.D) is facing heavy resistance at 63.5%. A rejection here could trigger a fresh wave of altcoin strength, with dominance potentially falling toward the 59-60% range.
📈 Altcoin Market (TOTAL3) is showing strong bullish potential. As long as we hold above the 893B support, the upside target sits at 1.13 Trillion USD, representing a +25% gain.
The charts are loaded with opportunity—stay focused and let’s see if altseason is officially kicking off!
One Love,
The FXPROFESSOR 💙

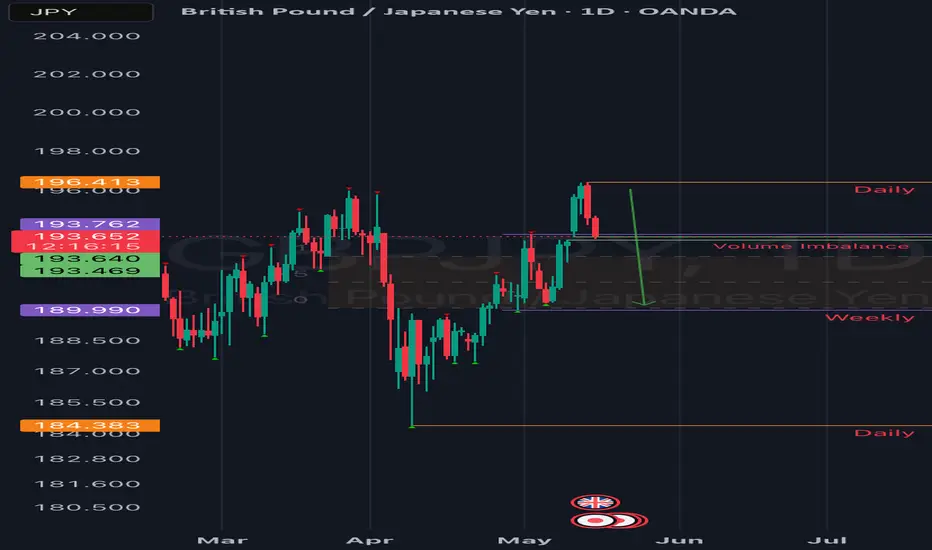
GBPJPY( British pound my banker!)Good day traders, I’m back with another idea on GbPJPY but this one is based on the strength and weakness of the pound itself. Before you ask what I mean…on this respective TF we had a break of structure higher(strength) but we saw price immediately move lower showing some weakness in price.
For the rest of the London session we can expect price to move higher on that volume imbalance to start the New York session. The rectangle is a balanced price range.