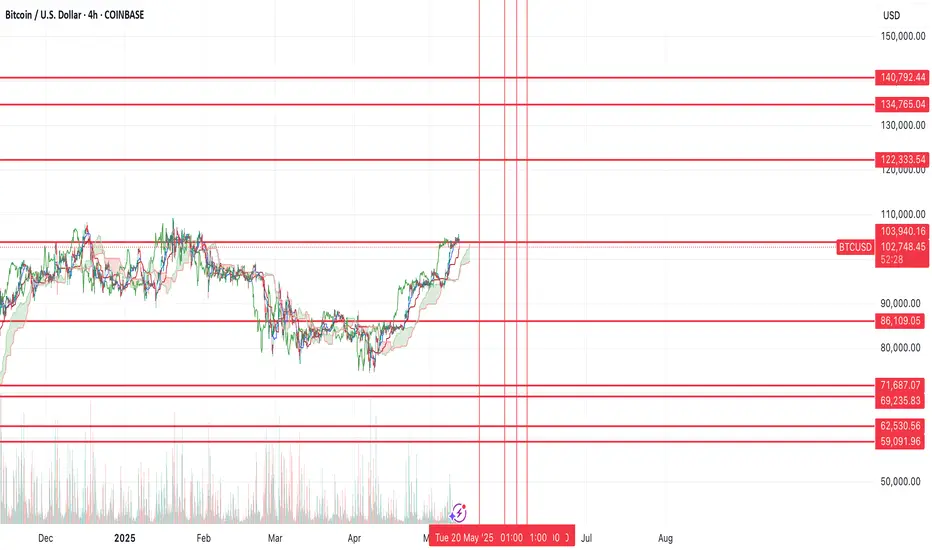
$BTC probability still favors new lowBTC has had a strong rally back into the prior resistance and unless we can break above the prior highs, I still think probability still favors more downside (and I think we see a new low).
I've marked off support levels and resistance levels as I think this will largely be the range over the next year.
My base case as of now, is that we see one more low down in the $69k-$62k region before we start a new run to the highs above ($122k+). Another possibility is that we sweep the lows and bounce at $72k, then move up towards the highs.
That said, the reason I think lower is due to the massive imbalance on the chart that needs to get resolved.
Overall I still think we're in a bullish trend, but that we continue to pullback before the final move higher.
1-BTCUSD
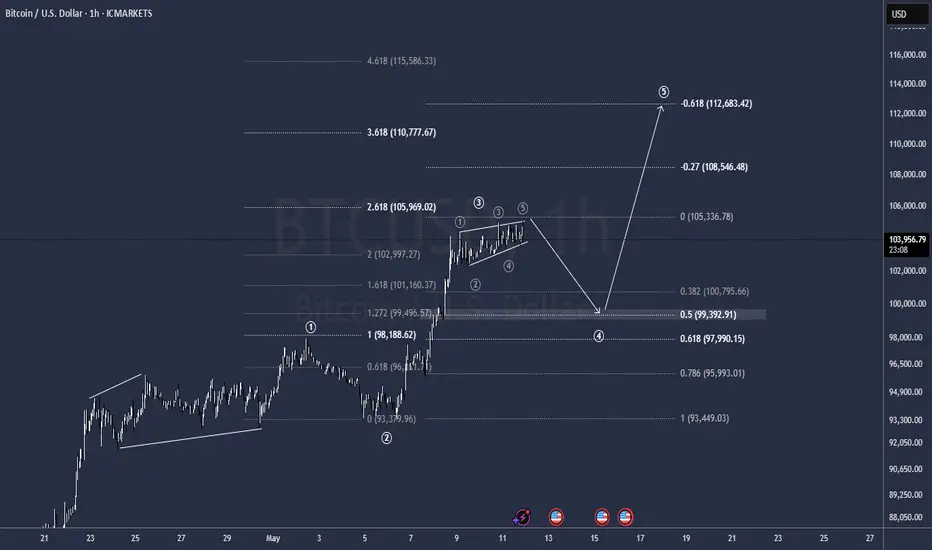
BTCUSD – Multi-TF Bearish SFP & Fib Retrace Before ATH Rebound
Bearish SFP printed on 4H / 8H / 12H / 1D at $103 345 – $104 985 after a parabolic ~$94 k → $104 k run and multiple rejections at $104 k–$106 k resistance.
Trump tariff-cut announcement sparked a sharp spike into resistance that was quickly sold off, confirming heavy supply at $104 k – $106 k.
Baseline plan: drop to 0.786 Fib ~$102 586, then 0.618 Fib ~$100 613, before a push toward the ATH ~$109 588.
Trade Setups
Short – SFP Breakdown
Trigger: 4H close below $103 345
Entry: ≈ $103 300 on retest
SL: $105 500 (above swing high)
TP1: 0.786 Fib ≈ $102 586 RR ≈ 0.7
TP2: 0.618 Fib ≈ $100 613 RR ≈ 2.6
Long – Fib Rebound
Trigger: Bullish reversal at 0.618 Fib / FVG cluster ≈ $100 613
SL: $99 300 (below FVG)
TP1: SFP top / range high ≈ $104 145 RR ≈ 2.7
TP2: ATH ≈ $109 588 RR ≈ 6.8

Bitcoin BTC Is Entering Into CorrectionHello, Skyrexians!
I got a lot of comments to analyze BINANCE:BTCUSDT because it has almost reached ATH and people don't understand what is happening. In my opinion last pain ahead and after that likely we see great gains.
Let's take a look at 4h time frame. We can finally notice the full 5 waves cycle which is likely to be finished. If you remember my recent analysis this is just the wave 1 inside higher degree wave 3. Awesome Oscillator has printed divergence, so there is a great chance that correction has been already started. The target for this correction is 0.5 Fibonacci at $90k. I don't recommend you to short this move if you are not experienced because this is trade against the trend.
Best regards,
Ivan Skyrexio
___________________________________________________________
Please, boost this article and subscribe our page if you like analysis!

BTC Forecast The Shark Harmonic pattern has clearly formed on the daily chart of BYBIT:BTCUSDT and could lead to some corrections.

Trade Idea: BTCUSD Long ( BUY LIMIT )1. Trade Direction: Long
• Trend Alignment:
• Daily: Strong uptrend resumption with higher highs, higher lows, and price reclaiming above key moving average. RSI > 70 indicates strong momentum.
• 15-Min: Bullish breakout from consolidation, steep EMA slope, MACD rising, momentum increasing.
• 3-Min: Intraday momentum continuation pattern. Clean bullish price structure.
• MACD (All Timeframes): Strong bullish crossover, rising histogram — confirming trend strength.
• RSI (All Timeframes): RSI not yet overextended on lower timeframes, suggesting room for more upside.
• Price Action: Recent breakout with healthy retracement structure and no major bearish divergence.
• Fundamentals (Contextual):
• BTC crossing $100K is a psychological milestone likely to invite more inflows.
• Macro environment remains supportive for digital assets (inflation hedge, fiat debasement narrative).
• Strong market sentiment and volume suggest continuation potential.
⸻
2. Trade Setup
Entry:
• Entry Zone: $102,800
• Price is consolidating above previous resistance (~$102,000), now acting as support.
Stop Loss:
• SL: $101,200
• Below most recent intraday swing low and EMA on lower timeframes, giving it enough room.
Take Profit:
• TP: $106,800
• Near the next psychological level and extension target from recent measured moves.
FUSIONMARKETS:BTCUSD

EurUsd…Daily FVG fill.Good day traders, I’m back with another setup but this setup is based on the GBPUSD setup I posted yesterday…go and look at it, to get the ideological.
To be honest I don’t think the drop in price to start the week was unexpected because of the strength shown last week on the DXY and on the idea I posted on GBpUSD I highlighted that last week XXX/USD pairs did not perform as the USD/XXX pairs. Which explains why we open with a bearish move lower and now I believe price is gonna do as I expected it on GBPUSD before taking liquidity but strength was too strong.
EurUsd on this respective TF we can see that it has been on a downward movement, and if we take a look at that healthy bearish leg. Price has left imbalances but the most visible one is the volume imbalance that I have shown you on the chart. For the rest of the day should price closer above the VI than I believe we can expect it to move higher till Thursday before DXY continues moving higher.

Bitcoin: again above $100KThe FOMC meeting held during the previous week brought back at least some level of confidence on financial markets. This time, the increased positive sentiment was reflected also on the crypto market, and its major coin, BTC. Increased demand for riskier assets brought back BTC to levels above the $100K. This coin is ending the week at levels above the $103K.
As of the end of the week, the RSI reached the level of 76, which is treated as highly overbought market side in technical analysis. The moving average of 50 days continues to converge toward the MA200, indicating a potential for another cross in the coming period. Just as a reminder, at the beginning of April, the two lines made the so-called “dead cross”, swiftly after, the trend changed to the upside.
Investors' confidence is back on the market, however, it should be considered that US-China trade negotiations are expected to start soon, which would most certainly bring back some higher volatility and nervousness among market participants. On a longer scale of time, BTC will most certainly seek the way to test its current ATH and even to make the new ones. However, on a shorter time scale, this road will be marked with ups and downs. The current $103K level will be tested at the start of the week. Some short term reversal is quite possible, at least to the level of current support line at $100K. A move toward the higher grounds is also possible, to some extent, however, at this moment, it should not be expected to be a significant one.

SPY/QQQ Plan Your Trade for 4-12 : Rally In CountertrendIn today's video, I try to highlight the TREND features in the SPY CYcle Pattern data window for all of you to use.
Yesterday, I received a comment from a friend/client asking about the strength in the markets compared to my expectations.
My answer was simple. The SPY Cycle Pattern data window shows Short-Term (ST), Long-Term (LT) trending as well as the Daily/Weekly Bias trends.
Traders should use these to determine the primary trend/direction of price action.
Additionally, I try to add my own thoughts/context related to the market setup/structure. That is where I teach you about the EPP/Cradle patterns and more.
Ideally, my analysis and the SPY Cycle Patterns align with the future price moves in a way that everyone can profit from the highest probability outcomes.
There are times when news or outside forces drive the market trend beyond my expectations and, in some cases, beyond the SPY Cycle Pattern predictions. This recent Trump-Pump rally may be one of those cases.
Either way, I continue to try to deliver the best technical analysis and research I can offer for followers.
Get some.
#trading #research #investing #tradingalgos #tradingsignals #cycles #fibonacci #elliotwave #modelingsystems #stocks #bitcoin #btcusd #cryptos #spy #gold #nq #investing #trading #spytrading #spymarket #tradingmarket #stockmarket #silver

DeGRAM | BTCUSD ended the period below 100k?📊 Technical Analysis
● Price rocketed out of the $91 300 demand zone, snapping the 6‑month descending trend and converting the $99 500 former cap into support.
● A tight bull pennant is forming just above that level; a decisive break targets the marked resistance level/supply band at $108 000. Long bias void below $93 300.
💡 Fundamental Analysis
● U.S. Treasury’s plan to boost quarterly bill issuance is flattening real yields and lifting non‑yielding assets.
● Hong Kong’s new spot‑BTC ETFs amassed >$500 M AUM in two weeks, signalling fresh Asia‑Pacific demand and tightening offshore float.
✨ Summary
Pennant continuation above new support and expanding Asian ETF inflows argue for a push from $99.5 K to $108 K; protect longs if price closes under $93.3 K.
-------------------
Share your opinion in the comments and support the idea with a like. Thanks for your support!

BITCOIN TO $140KAccording to this weekly chart I have, bitcoin has a very important trendline that no one pay attention to, which gives us a very strong resistance about $134k to $140k , depends when bitcoin touch that, and I expect a big rejection from that area.

Bitcoin Chart Pattern Signals Possible Dip Before Pump!🚀 Hey Traders! 👋
If you’re finding value in this analysis, smash that 👍 and hit Follow for high-accuracy trade setups that actually deliver! 💹🔥
📉 #BTC – Potential Inverse Head & Shoulders in Play
Bitcoin is showing signs of a classic inverse head and shoulders formation on the daily chart. However, it's facing heavy resistance near the neckline around the $106,000 zone.
🧠 Possible Scenario:
A correction toward the GETTEX:92K –$93K range could complete the right shoulder before a potential breakout. If we see a clean bounce from that level, bulls might reclaim momentum.
⚠️ Invalidation:
A daily close above $106,000 would invalidate the structure and signal early continuation.
💬 What do you think of this setup? Drop your views and analysis in the comments below!

BITCOIN about to test its ATH following HUGE U.S. - China deal!Bitcoin (BTCUSD) is marching towards the $109000 Resistance, which is its All Time High (ATH), following the U.S. - China trade agreement 3 hours ago. This can be a huge fundamental boost to the bullish trend as technically, every time the Resistance level broke during this Bull Cycle, the break-out that followed was extremely aggressive.
On October 2 2023, the Resistance test resulted into a strong break-out, which completed a +96.18% rise from the bottom before a 1D MA100 (green trend-line) pull-back. At the same time of the Resistance break-out, we had a 1D MA50/100 Bullish Cross and a 1W MACD Bullish Cross.
The October 29 2024 Resistance test on the other hand was initially unsuccessful and made a 5 day rejection back near the 1D MA50 (blue trend-line) before the next successful test. Again the rise was more than +96.18%.
As a result, we are expecting to see at least $145k by July (+96.18%) once the Resistance breaks.
Do you think that is a realistic time-frame for $145000? Feel free to let us know in the comments section below!
-------------------------------------------------------------------------------
** Please LIKE 👍, FOLLOW ✅, SHARE 🙌 and COMMENT ✍ if you enjoy this idea! Also share your ideas and charts in the comments section below! This is best way to keep it relevant, support us, keep the content here free and allow the idea to reach as many people as possible. **
-------------------------------------------------------------------------------
💸💸💸💸💸💸
👇 👇 👇 👇 👇 👇

12/05/25 Weekly OutlookLast weeks high: $104,972.46
Last weeks low: $93,385.49
Midpoint: $99,178.97
Bitcoin climbs over 12% from weekly low to weekly high, an incredible achievement despite a mixed performance in Tradfi. A pattern we've seen since the $74,500 double bottom following Liberation day goes; A strong rally for a week, consolidation in a tight trading range for a week, then repeat. Should this pattern continue we should see consolidation between weekly high and $102,075 (0.75 line).
CPI & PPI take place this week on Tuesday and Thursday respectively, inflation is still a big talking point but baring a crazy print I would be surprised if these events move BTC. In the last few hours at time of writing The US has reduced tariffs on China to 30% for 90 days, China has reduced tariffs on the US down to 10%. To me this signifies the worst of the trade war narrative is behind us.
This week I will be tracking altcoins with strong fundamentals as BTC.D rolls over from its highest point since January '21, ETH has already had a strong breakout from the downtrend and with BTC at ATH levels with strong resistance this should be the time to see altcoin strength and play catch-up.
Good luck this week!

May 9 Bitcoin Bybit chart analysisHello
It's a Bitcoinguide.
If you have a "follower"
You can receive comment notifications on real-time travel routes and major sections.
If my analysis is helpful,
Please would like one booster button at the bottom.
This is the Nasdaq 30-minute chart.
There is no separate indicator announcement today.
With the green support line maintenance condition, I created a strategy for a sideways market with a red finger long position strategy.
The main sections are indicated by price, so
Please refer to it.
This is a Bitcoin 30-minute chart.
At the bottom left, with a purple finger,
I just connected the 99,222.6 dollar long position strategy from the 8th analysis article.
*When the red finger moves,
One-way long position strategy
1. 102,536 dollar long position entry section / cut-off price when the green support line breaks
2. Top section 105,417.6 dollar long position 1st target -> Target price in order from Good to Miracle.
From Miracle, the report is updated,
and the possibility of the report being updated has greatly increased due to yesterday's movement.
The 1st purple finger section at the top
If it doesn't break through, it's a sideways market, but if it breaks through, it can be directly connected to an upward trend,
so it seems safer to operate it as a long position waiting rather than taking a short. (Horizontal range until convergence section 1, 2)
From the green support line deviation of section 2 at the bottom
Because of the full candle on the left, it can be pushed hard,
So you must follow the stop loss price.
This week, it is open from Bottom-> 3rd -> 97086.1,
So please use it well in real time.
Up to this point, I ask that you simply refer to and use my analysis
And I hope that you operate safely with principle trading and stop loss price.
Thank you for your hard work this week.
Thank you.

Bitcoin - Will Bitcoin set a new high?!Bitcoin is located between EMA50 and EMA200 on the four-hour timeframe and is in its descending channel. If Bitcoin moves downward towards the specified demand zone, we can look for its next buying opportunities.
It should be noted that there is a possibility of heavy fluctuations and shadows due to the movement of whales in the market and compliance with capital management in the cryptocurrency market will be more important. If the downward trend continues, we can buy within the demand range.
Berkshire Hathaway’s long-standing skepticism toward gold and Bitcoin may be undergoing a shift—at least that’s the perspective of Jack Mallers, CEO of Strike and the newly founded 21 Capital. In response to Warren Buffett’s recent cautionary statement about the U.S. dollar, Mallers offered a bold interpretation, suggesting that broader changes in macroeconomic conditions could eventually influence Berkshire’s conservative stance.
During Berkshire Hathaway’s latest shareholder meeting, Buffett remarked, “We never want to own an asset whose currency we believe is truly deteriorating—and that’s precisely our main concern with the U.S. dollar.” Mallers found the timing of this comment particularly significant, considering Berkshire’s sizable exposure to U.S. Treasury securities.
Speaking to Kitco News, Mallers said: “Warren has over $200 billion in U.S.Treasuries, right? So for him to openly admit this, especially while the bond market is unraveling and he’s questioning the very structure of global capital flows, reflects the broader macroeconomic context we’re in.”
Historically, Buffett has been openly critical of gold and Bitcoin, once calling gold “neither useful nor productive” and referring to Bitcoin as “rat poison squared.” But Mallers believes those comments no longer hold weight. “Those quotes sound outdated to me,” he said. “Buffett is undoubtedly a great investor, but he’s from a previous generation—one that operated under the dominance of fiat currencies and the U.S. dollar as the global reserve.”
Given that Berkshire currently holds over $230 billion in cash and Treasury holdings, Mallers sees the potential for a reallocation of capital into assets like Bitcoin and gold. “It’ll be fascinating if Buffett shifts his outlook,” he added. “Gold and Bitcoin are two of the world’s most credible, fixed-supply assets.”
In a related development within the crypto space, an interesting point has emerged: if Bitcoin’s price reaches $110,000, over $1 billion worth of short positions could be liquidated.
Standard Chartered Bank has recently revised its earlier projection, saying that its previous $120,000 price target for Bitcoin in Q2 2025 may now be too conservative. The bank now maintains a bullish outlook and has cited several key drivers behind this shift.
These include capital flows transitioning from U.S.-based assets to Bitcoin, as well as significant accumulation by large institutional investors, which has helped push prices higher.
According to Standard Chartered, approximately $5.3 billion has flowed into U.S. Bitcoin ETFs over the past three weeks. Major players such as Abu Dhabi’s sovereign wealth fund and the Swiss National Bank are reportedly among the institutional buyers. These developments signal a broader market transition—from high-risk asset correlation to a more strategic focus on liquidity and targeted accumulation within the crypto space.

Bitcoin BTC price analysis - READ the text !There was some positive news: "The US and China have agreed to reduce tariffs for 90 days."
The price of CRYPTOCAP:BTC has entered the zone of total sales - $105-110 thousand.
🕯 Metrics show that large wallets are now opening short positions worth hundreds of millions of dollars, and on the other hand, no less large wallets that organized this rebound in the OKX:BTCUSDT price are very tempted to launch the final stage of cascading liquidations of shorts.
🍿 So, stock up on popcorn - it's going to be "fun" today/tomorrow, and then we'll go to the stronger side!)
Globally, before the growth wave begins, we want to see the final "shake-up" of the longs who have survived everything and still held their positions and didn't give up.
1️⃣ Weak correction in the range of $90-91k - to close the GAP that formed on this rebound and then continue to confidently update ATH with a clear conscience.
2️⃣ A strong correction to the range of $80-82k - during which it will be very interesting to watch the capital flow and dominance.
Which scenario is closer to your heart? Write in the comments!
_____________________
Did you like our analysis? Leave a comment, like, and follow to get more


Bitcoin Update – Textbook Patterns Playing OutIn last week’s Bitcoin idea, I highlighted a key technical setup: price retested the neckline of a massive inverted Head & Shoulders pattern and launched a strong move upward. Let’s dive into what’s unfolding on the daily chart.
We’re seeing classic Wyckoff consolidation behavior—appearing right before the breakout and again after the neckline retest. Multiple smaller Head & Shoulders patterns have also formed and hit their targets cleanly.
The Volunacci pattern came alive after a precise bounce from the Golden Zone, adding more fuel to the bullish narrative.
Next major level in focus: $120K. Will Bitcoin reach it? Let the market decide.

BTCUSDTHello everyone. Wishing you all a great weekend!
Just because the FX market is closed today doesn't mean we should stay away from trading in the crypto markets.
That’s why I’ve activated a Buy trade on BTCUSDT and wanted to share it with you as well:
🔍 Criteria:
✔️ Timeframe: 15M
✔️ Risk-to-Reward Ratio: 1:1.50
✔️ Trade Direction: Buy
✔️ Entry Price: 103974.98
✔️ Take Profit: 104442.64
✔️ Stop Loss: 103662.77
🔔 Disclaimer: This is not financial advice. It's a trade I’m taking based on my own system, shared purely for educational purposes.
📌 If you're also interested in systematic and data-driven trading strategies:
💡 Don’t forget to follow the page and subscribe to stay updated on future analyses.

SPY WEEKLY 12 MAY 2025Welcome to Spy weekly. I have tried my best to explain the price action here. If you have any doubts, feel free to leave a comment or DM me.
NOTESTAY AWAY FROM OPTIONS

"BTCUSD Smart Money Setup: Fair Value Gap + Weak Highs🚨 Bitcoin (BTCUSD) Smart Money Play Unfolding!
Let’s break down what’s happening on this 15-minute BTCUSD chart and why we could be gearing up for a powerful bullish reversal:
📍 Liquidity Sweep + Market Structure Shift
Price aggressively pushed into a weak low, grabbing liquidity from late sellers and stop orders. Smart Money behavior detected as price forms a potential Change of Character (ChoCH) at a discount zone.
This shift signals a transition from bearish pressure to potential bullish intent.
📍 Fair Value Gap (FVG) as Re-entry Zone
We’ve marked a clean Fair Value Gap (pink box) just below current price action, aligning with the 78–79% retracement zone. Smart Money loves these inefficiencies — they act as magnets for price to rebalance before strong directional moves.
🟣 This FVG is your 1st key zone for entries. If price respects this, we could see an explosive move toward the buy-side liquidity.
📍 Confluence: Fibonacci + Imbalance
Notice how this FVG perfectly aligns with the Fibonacci Golden Zone (70.50–79.00%). This adds extra confluence that this area could act as a powerful springboard for long positions.
📍 Buy-Side Liquidity & Weak Highs Targeted
Above current price lies a Buy Side Liquidity pool and a marked Weak High, signaling that Smart Money may be targeting these inefficiencies next.
🎯 These are the obvious targets if price reacts from the FVG:
First TP at 104,680
Second TP at 104,887
Optional continuation beyond if price grabs liquidity and breaks structure
📊 Risk-to-Reward (R:R) Play
Entry near FVG with stop just below the Strong Low offers an attractive R:R setup. Targeting the weak high gives a multi-R potential.
🟢 High probability setup if price shows bullish reaction (engulfing, BOS) in the FVG zone.
🧠 Smart Money Logic:
Manipulation ✅
Imbalance/FVG ✅
Liquidity Grab ✅
Structure Shift ✅
Clean Targeting of Buy Side Liquidity ✅
This is a textbook SMC long setup in development.
⚡ Game Plan:
Wait for confirmation in the FVG zone (e.g., bullish engulfing or BOS on lower TF).
Set longs with tight stop below 103,535 (Strong Low).
Secure partials at first TP and trail for extended target.
🚨 Risk Management Reminder:
Stick to your trading plan.
Let price come to you.
Never risk more than you can afford to lose.
✍️ In summary:
BTC is sitting at a beautiful discount level with a clear inefficiency to fill. If Smart Money reacts here, we’re looking at a smooth climb into higher liquidity zones. This could be the cleanest setup of the day — if you know how to play it right.
💬 Comment “BTC READY” if you’re planning to enter this setup!
👥 Tag a crypto buddy who needs to see this!

Bullish Tide: Are Bears Drowning as $31M Shorts VanishBullish Tide: Are Bears Drowning as FWB:31M Shorts Vanish and "Price Discovery 2" Looms?
The cryptocurrency landscape is once again electric with anticipation, and at the heart of this renewed fervor stands Bitcoin. As of May 2025, the prevailing winds appear to be firmly in the sails of the bulls. A cascade of recent market events, headlined by a dramatic $31 million liquidation of Bitcoin short positions, is sending a stark warning to pessimistic speculators. This, coupled with compelling technical analysis suggesting that Bitcoin must close the week above a crucial level to initiate 'price discovery 2', paints a picture of a market on the brink of a potentially explosive upward trajectory.
This isn't merely about fleeting price surges. Underlying these market dynamics is a growing conviction that Bitcoin doesn’t need to change; the world does. While critics often call for Bitcoin to become "faster, cheaper, greener," a powerful counter-narrative champions its existing, robust design as a solution to the inherent weaknesses of traditional systems. Adding fuel to this bullish fire is the subtle but significant trend of Bitcoin’s Quiet Coup, as wealth funds methodically build up their holdings. Furthermore, market sentiment indicators like Bitcoin funding rates remaining positive on major exchanges like Binance seem to confirm a strong, underlying uptrend. Are Bitcoin bears truly losing out, and are we witnessing the dawn of a new era for the king of cryptocurrencies?
The Cost of Doubt: $31 Million in BTC Shorts Wiped Out
The unforgiving nature of leveraged trading in the cryptocurrency markets was recently laid bare with the news that a staggering $31 million in Bitcoin short positions were liquidated. This event serves as a potent illustration of the risks involved in betting against Bitcoin's momentum, especially in the current climate.
Short selling in the crypto sphere, much like in traditional markets, involves traders borrowing Bitcoin, selling it with the expectation that its price will fall, and then planning to buy it back at a lower price to profit from the difference. However, the crypto markets are known for their high volatility and the widespread use of leverage, particularly in perpetual futures contracts. Leverage allows traders to control a much larger position than their initial capital would normally allow, amplifying potential profits but also, crucially, potential losses.
When the market moves sharply against a leveraged short position – meaning Bitcoin's price surges upwards – traders can face a margin call. If they cannot add more funds to cover their mounting losses, the exchange automatically closes their position to prevent further debt. This forced closure is a liquidation. The $31 million wipeout signifies that a substantial volume of bets on Bitcoin's price decline was overwhelmed by a potent wave of buying pressure.
This mass liquidation event has several implications. Firstly, it inflicts significant financial pain on those who were positioned for a downturn, effectively Bitcoin bears losing out on their wagers. Secondly, these forced closures inherently involve buying Bitcoin to cover the short positions, which paradoxically adds more fuel to the upward price movement. This can trigger a "short squeeze," where rising prices force more shorts to cover, leading to further liquidations and an accelerated price rally. Such events bolster bullish sentiment, demonstrating underlying market strength and deterring further aggressive short selling. It’s a clear signal that the market's undercurrent was far more robust than the bears had anticipated.
On the Cusp of a New Frontier: The Critical Weekly Close and "Price Discovery 2"
The excitement among Bitcoin proponents is palpable, with many analysts asserting that Bitcoin bulls are on the cusp of launching the market back to all-time highs and beyond. Central to this optimistic outlook is the focus on an upcoming, crucial weekly close. According to prevailing technical analysis, Bitcoin must close the week above a specific, strategically important price level to start 'price discovery 2'.
"Price discovery" is the process by which market participants determine the fair value of an asset through their buying and selling activities. When an asset like Bitcoin surpasses its previous all-time high (ATH), it enters a phase where historical resistance levels cease to exist. This is true price discovery – the market is venturing into uncharted territory, with no past price ceilings to act as psychological or technical barriers. "Price Discovery 1" can be considered Bitcoin's journey to its previous peak (around $69,000 in November 2021). The term "Price Discovery 2" thus implies a new, sustained bull run that would take Bitcoin significantly beyond that former zenith.
The significance of a "weekly close" above a key resistance level cannot be overstated in technical analysis. Weekly charts smooth out short-term noise and are often seen as better indicators of major trend shifts. A decisive weekly close above, say, the previous ATH or a major interim peak, would be a powerful confirmation for many traders and investors that the bulls are firmly in control. It would invalidate bearish scenarios that predicted a rejection at these upper levels and would likely attract a fresh wave of capital into the market.
Several potent catalysts could fuel this ascent into "Price Discovery 2." The quadrennial Bitcoin halving event, the most recent of which occurred in April 2024, historically constricts the new supply of Bitcoin, often leading to significant price appreciation in the months and years that follow as demand outstrips this reduced supply. Continued institutional adoption, evidenced by wealth funds accumulating Bitcoin, provides a steady stream of large-scale buying pressure. Furthermore, a challenging macroeconomic environment, characterized by persistent inflation in major fiat currencies or geopolitical uncertainties, can enhance Bitcoin's appeal as a non-sovereign store of value and a hedge against systemic risks. Should Bitcoin achieve this critical weekly close and embark on "Price Discovery 2," the upside could be substantial, as the market seeks to establish a new equilibrium in uncharted price territory.
The Unwavering Standard: Bitcoin Doesn’t Need to Change, The World Does
Amidst the price charts and market analyses, a more profound narrative is solidifying: Bitcoin doesn’t need to change; the world does. For years, critics have argued that Bitcoin should be faster, cheaper, greener, often comparing its transaction throughput or energy consumption to centralized payment networks or newer, less proven blockchain protocols. However, an increasing number of proponents argue that maybe the point isn’t to fix Bitcoin. Maybe it’s to fix everything else with Bitcoin.
This perspective champions Bitcoin's core attributes – often perceived as limitations by detractors – as its most vital strengths:
• Unparalleled Decentralization: Bitcoin operates on a globally distributed network with no single point of control. This makes it resistant to censorship, shutdown, or manipulation by any government or corporation. In an age of increasing financial surveillance and control, this is a feature, not a bug.
• Robust Security and Immutability: The Proof-of-Work (PoW) consensus mechanism, while energy-intensive, is what underpins Bitcoin's formidable security. The immense computational power dedicated to mining creates an economic fortress around the network, making its transaction history virtually tamper-proof. While the "greener" argument often pushes for alternatives like Proof-of-Stake (PoS), many believe PoW offers a unique level of objective security crucial for a global store of value. Moreover, the narrative around Bitcoin's energy use is evolving, with increasing adoption of renewable and stranded energy sources for mining, and a growing recognition that its energy consumption is a worthwhile trade-off for securing a truly independent financial system.
• Absolute Scarcity: Bitcoin's supply is capped at 21 million coins, a hard-coded limit that cannot be altered. This programmatic scarcity makes it a powerful antidote to the inflationary pressures inherent in fiat currencies, which can be created limitlessly by central banks. This "digital gold" characteristic is fundamental to its value proposition.
• Layered Scaling: While the Bitcoin base layer prioritizes security and decentralization over raw transaction speed, innovation is flourishing on Layer 2 solutions like the Lightning Network. These protocols enable fast, low-cost transactions by batching them off-chain and settling them periodically on the main Bitcoin blockchain, thus allowing Bitcoin to scale for everyday payments without compromising its core principles.
The argument is that instead of trying to mold Bitcoin to fit the constraints of the old financial world, we should recognize how its unique properties can address the systemic flaws within that world – issues like inflation, financial exclusion, censorship, and counterparty risk. Bitcoin, in its current form, offers a radical, resilient alternative.
The Silent Infiltration: Wealth Funds Build Up Bitcoin Holdings
Further bolstering the bullish case is the ongoing, often understated, trend of Bitcoin’s Quiet Coup: Wealth Funds Build Up Holdings. This isn't about flashy headlines but rather a methodical, strategic accumulation of Bitcoin by sophisticated institutional investors, including pension funds, endowments, sovereign wealth funds, and large family offices.
These entities, traditionally conservative and managing trillions of dollars in assets, are increasingly allocating a portion of their portfolios to Bitcoin. Their motivations are manifold:
• Diversification: Bitcoin has historically exhibited low correlation with traditional assets like stocks and bonds, making it an attractive addition for enhancing portfolio risk-adjusted returns.
• Inflation Hedge: In an environment of persistent global inflation, Bitcoin's finite supply positions it as a potential store of value, a digital hedge against currency debasement.
• Asymmetric Upside: Even a small allocation to Bitcoin can offer significant upside potential, an appealing proposition for large funds seeking growth.
• Growing Regulatory Clarity and Infrastructure: The approval of Bitcoin ETFs in major jurisdictions like the U.S. has provided regulated and accessible avenues for institutional investment, alongside the development of institutional-grade custody and trading solutions.
This "Quiet Coup" signifies a maturing perception of Bitcoin, moving it from a speculative niche asset to a legitimate component of institutional investment strategy. The steady inflow of significant capital from these large players not only provides price support but also lends credibility and encourages further adoption, potentially reducing long-term volatility as more Bitcoin is held by entities with long-term horizons.
Reading the Bullish Tea Leaves: Bitcoin Funding Rates Remain Positive
Adding another layer of confirmation to the prevailing bullish sentiment is the observation that Bitcoin Funding Rates Remain Positive On Binance — Strong Uptrend Confirmed? Funding rates are a key mechanism in cryptocurrency perpetual futures markets, designed to keep the price of the perpetual contract aligned with the spot price of the underlying asset.
When funding rates are positive, it generally means that traders holding long positions (betting on a price increase) are paying a premium to those holding short positions. This indicates a higher demand for long leverage, reflecting overall bullish sentiment in the derivatives market. Consistently positive funding rates on a major exchange like Binance, which boasts significant trading volume, suggest that this optimism is sustained. It implies that traders are confident enough in Bitcoin's upward trajectory to pay a recurring fee to maintain their leveraged long positions.
While extremely high funding rates can sometimes signal an over-leveraged market ripe for a correction (a "long squeeze"), moderately and persistently positive rates, as currently observed, are often interpreted as a healthy sign of a strong and well-supported uptrend. It suggests that the rally is not just speculative froth but is backed by conviction among active traders.
Conclusion: A Perfect Storm for Bitcoin's Next Chapter?
As May 2025 progresses, the confluence of factors points towards a potentially transformative period for Bitcoin. The $31 million decimation of short positions serves as a stark reminder of the perils of underestimating Bitcoin's strength. The market's eager anticipation of a weekly close that could unlock "Price Discovery 2" highlights the potent bullish technical setup. This is further reinforced by the fundamental conviction that Bitcoin's core design is its ultimate strength, offering solutions the traditional financial world desperately needs.
The quiet, strategic accumulation by wealth funds injects not only capital but also a profound sense of legitimacy, while positive funding rates reflect a confident and sustained bullish sentiment among active traders. While the path ahead will undoubtedly feature volatility – a characteristic inherent to Bitcoin's journey – the current alignment of technical indicators, institutional adoption, strong market sentiment, and a compelling fundamental narrative suggests that Bitcoin bears may indeed be losing out, and significantly so. The stage appears set for Bitcoin to not only challenge its previous highs but to potentially embark on a new, exhilarating phase of growth and adoption, further solidifying its role in the evolving global financial order.
