Strategic Analysis of Bitcoin for Next WeekRecently, Bitcoin has broken through the $100,000 mark, and its market dominance has risen to over 60%. Investors are highly bullish. Such a positive market sentiment is likely to attract more investors to enter the market, further driving up the price. 👉👉👉
In the short term, the price of Bitcoin has continuously broken through multiple key technical resistance levels. For example, on May 8th, it broke through the psychological barrier of $100,000, demonstrating strong bullish momentum. The market dominance has risen to over 60%, and investors are highly bullish. Such a positive market sentiment is likely to attract more investors to enter the market, further driving up the price.
BTCUSD Trading Strategy
buy @ 103500-103200
sl 101000
tp 104300-104600
If you approve of my analysis, you can give it a thumbs-up as support. If you have different opinions, you can leave your thoughts in the comments.Thank you!👉👉👉
1-BTCUSD

Summary of Bitcoin Last WeekThe overall trend of the Bitcoin market shows a pattern of "first decline and then rise". The price has continuously broken through several key technical resistance levels, strongly breaking through the psychological barrier of the $100,000 mark and reaching a new stage high.👉👉👉
With the rise in price, the hash price of Bitcoin has steadily rebounded and is approaching the high range of the past month, rising for several consecutive days, indicating that the market demand for computing power resources remains robust.
Overall, after the previous fluctuations, the Bitcoin market has demonstrated strong resilience and optimistic expectations under the dominance of the bulls in the recent period. However, the cryptocurrency market is highly uncertain and risky, and investors still need to approach it with caution.
If you approve of my analysis, you can give it a thumbs-up as support. If you have different opinions, you can leave your thoughts in the comments.Thank you!👉👉👉

Crypto Markets: “Sell in May, and Go Away” — What Does It MeanThe historical pattern known as the “Sell in May, and Go Away” seasonal divergence was popularized by the Stock Trader’s Almanac, which stated that investing in stocks represented by the Dow Jones Industrial Average from November to April and switching to fixed income for the other six months “has delivered reliable returns with reduced risk since 1950.”
What is “Sell in May, and Go Away”?
“Sell in May, and Go Away” is a well-known saying in finance. It is based on the historical underperformance of stocks over the six-month period from May to October.
According to Fidelity Investments, the divergence has been most pronounced in recent years, with the S&P 500 (SPX) gaining an average of about 2% from May to October from 1990 onwards over the next 30 years, compared with an average of about 7% from November to April.
The Halloween Indicator, 'Sell in May and Go Away': Everywhere and All the Time*, a research paper examining stock markets outside the US, found the same pattern, calling the seasonal divergence trend "surprisingly resilient."
Key Takeaways
👉 "Sell in May and go away" is a saying that refers to the historically weaker performance of financial markets from May to October compared to the other half of the year.
👉 Investors can try to capitalize on this pattern by switching to less risky assets from May to October, based on historical data.
Seasonality in investment flows may persist as a result of year-end bonuses from the financial industry and businesses, perhaps helped by the mid-April deadline for filing U.S. income tax returns.
Whatever the underlying fundamentals, the historical pattern was made more pronounced by the October stock market crashes of 1987 and 2008.
Final Points
👉 The problem with historical patterns is that they do not reliably predict the future. This is especially true for well-known historical patterns. If enough people became convinced that the “Sell in May and Walk Away” pattern would persist, it would essentially begin to disappear immediately. All the early sellers would try to sell in April and bid against each other to buy back the assets before everyone else in October.
👉 At the same time, certain considerations regarding the development of geopolitical events in the period from May to October 2025 reasonably give reason to think about the prospects of such a scenario for the next 6 months.
* The Halloween Indicator, 'Sell in May and Go Away': Everywhere and All the Time
>> Ben Jacobsen Tilburg University - TIAS School for Business and Society; Massey University
>> Cherry Yi Zhang. Nottingham University Business School China; Massey University - School of Economics and Finance.
--
Best wishes,
@PandorraResearch Team 😎
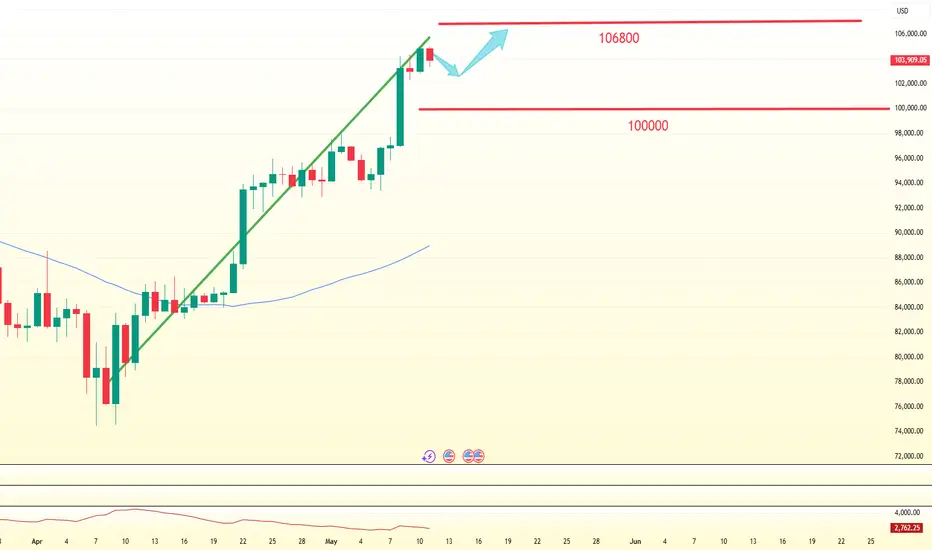
BTC at a Crossroads: Bull Trap or Moon Mission?A possible bearish scenario is playing out on BTC, but hey—just one of many possibilities before the real bloodbath begins. 👀 This could just be a classic trap to lure people in before shaking them out. The key resistance zone is between GETTEX:97K and $101K, a big range to clear. If we flip it and close above $102K on the weekly, that would be amazing—but let’s be real, we’ll need a strong catalyst for that. If we do, then we’re likely talking about the $120K range.
On the flip side, if we drop lower from here, the most obvious support sits at $72K. Below that… well, let’s just say we don’t wanna go there—next real support isn’t until $50K. For everyone’s sake, let’s hope we don’t see those levels. Big decision point ahead—let’s see who wins this battle! ⚔️🚀
Bitcoin is expected to maintain its upward trend throughout nextAgainst the backdrop of an unstable global macro and geopolitical environment, the resilience of Bitcoin will continue to be tested. The escalating geopolitical tensions between India and Pakistan pose a risk of evolving into a full-scale conflict. Meanwhile, the Federal Reserve finds itself in a dilemma between employment and inflation and has no immediate intention of cutting interest rates. Although the Trump administration's tough rhetoric on tariffs has somewhat softened, the market is still awaiting a clear direction for its trade policy. Based on these factors, it is expected that Bitcoin is likely to continue to fluctuate within the range of $70,000 to $109,000 in the coming two months.
you are currently struggling with losses, or are unsure which of the numerous trading strategies to follow, at this moment, you can choose to observe the operations within our channel.
BTC New Update (12H)The upward wave appears to be a complex correction. Price may retrace downward either from this area or from the red box, and then we could see another strong bullish move from Bitcoin starting from the green zone.
It doesn’t matter where the rejection occurs | what matters is the green Rebuy zone marked on the chart.
In the green zone, we are looking for buy/long positions.
A daily candle closing below the invalidation level will invalidate this analysis.
For risk management, please don't forget stop loss and capital management
When we reach the first target, save some profit and then change the stop to entry
Comment if you have any questions
Thank You

GBPUSD…inverse FVGGood day traders I have a lot of great setups but I believe this one can be a big mover going into the new week.
1D- Before going into more details I hope the inverse FVG is visible because that’s the area of interest, for the most part of last week was bearish indicating that US dollar for the upcoming week might continue with the strength shown last week. Price has broken structure lower but the way it broke price is not in a convincing way so keep an open mind to manipulation but overall the inverse is our area of interest. Monday and Tuesday we can expect price to move higher first than make a run lower since last week the move did not match the USD/XXX moves.
4H- Here we saw market shift lower to be in sync with the daily solidifying our weekly price movement bias. Here I’m not gonna say much cause the idea is based of the daily TF.

BTC 4H analysisIn the previous analysis, the zone of 70 was determining level for us, whether it was a correction or a downward trend.
BTC continued it's upward movement from near that area.
Now Bitcoin is near it's historical resistance area, this time the zone of 110 to 114 plays this role for us.
According to ICHIMOKU and according to previous analysis, Bitcoin tends to move to higher levels marked on the chart.

BTCUSD: Next Move Is Down! Short!
My dear friends,
Today we will analyse BTCUSD together☺️
The recent price action suggests a shift in mid-term momentum. A break below the current local range around 104,756.66 will confirm the new direction downwards with the target being the next key level of 104,224.56 and a reconvened placement of a stop-loss beyond the range.
❤️Sending you lots of Love and Hugs❤️

$ADA Breaking structure Cardano just touched a long-term descending trendline support and shows signs of a potential reversal. 👀
🧠 Smart money might be watching for a bounce, consolidation, and a sharp move toward the $0.95–$1.05 zone.
🕰️ Patience is key — breakout confirmation will be crucial.

BTCUSD: Market Sentiment & Price Action
Looking at the chart of BTCUSD right now we are seeing some interesting price action on the lower timeframes. Thus a local move down seems to be quite likely.
Disclosure: I am part of Trade Nation's Influencer program and receive a monthly fee for using their TradingView charts in my analysis.
❤️ Please, support our work with like & comment! ❤️

BTCUSD Supply Zone Play: Smart Money Dump in Progress!🚨 Bitcoin (BTCUSD) is playing the classic Smart Money trap — and you’re either the bait or the sniper.
Let’s decode this fresh 1H chart with laser precision 👇
📈 Market Structure:
BTC had a clean rally with momentum, but notice what happened next — price tapped directly into a 1H Bearish Order Block and Fair Value Gap (FVG) combo.
That red zone? That’s where smart money was waiting.
Now, price is consolidating and rejecting inside that OB. This isn’t just sideways action — this is distribution. 📉
📉 Liquidity Engineering:
See those equal lows below? 👀
Retail sees them as support.
Smart money sees them as liquidity to be harvested.
✅ Triple tap lows (marked by $$)
✅ Buy-side liquidity swept at the strong high (104.79k)
✅ Fair Value Gap left open as inefficiency magnet
This screams: "Trap the breakout chasers, then dump."
🔥 Smart Money Setup:
Entry was timed post-rejection inside the OB after tapping the Fair Value Gap.
This is distribution at premium pricing, exactly where big players unload while retail buys the top.
✅ OB Rejection
✅ Inside Premium
✅ Strong High respected
✅ Perfect Risk-to-Reward opportunity
🎯 Targets:
TP1: Local support flip or structure break near 101.2k
TP2: Full move into Weak Low / imbalance fill at ~99.1k
SL: Above OB / strong high @ 104,794.48
Risk-Reward? Solid 1:4+ sniper-grade setup 🔥
🧠 Psychology Tip:
Most traders get chopped here by overtrading or entering too early.
Be the sniper — not the machine gun. 🧘♂️💥
Wait for price to enter premium, show weakness, then strike with precision.
🚀 Summary of Confluences:
OB + FVG stacked
Strong High as invalidation
Distribution signs within premium
Weak Lows begging to be swept
Clear imbalance toward 99.1k
BTC is delivering textbook SMC setups — your job is to stop chasing and start planning like Smart Money.
➡️ Comment “BTC READY” if you're watching this setup!
➡️ Save this post for your backtesting journal! 🔥

BTCUSD 1H Long Setup | Strong Low to Weak High Play📈 BTCUSD | 1H Long Opportunity | May 11, 2025
BTC just tapped into a Strong Low around the 79% Fibonacci retracement (~103,440) after a powerful bullish push. Now forming a potential long continuation setup toward the "Weak High" marked at 104,985.
🔍 KEY CONFLUENCES:
🔵 Strong Low at 103,440 = clear demand with displacement
🔁 Fib retracement zone: 61.8%–79.0% tapped perfectly
📈 High-Volume Bullish Candle = displacement confirmation
🎯 Targeting the "Weak High" = liquidity magnet
🔂 Expecting BOS (break of structure) above weak high for full validation
📊 Setup Specs:
Pair: BTCUSD
Timeframe: 1H
Entry: 104,100
SL: 103,440
TP: 104,985
RR: Approx. 1:1.25 (solid for continuation scalps)
💡 Smart Money Concepts Breakdown:
We’re playing the classic Strong Low → Weak High liquidity play. Retail might hesitate due to consolidation, but the market structure still favors bullish continuation. Watch for confirmation volume and quick reaction above the high.
📌 Chart Ninjas Reminder:
“Strong Lows are meant to hold. Weak Highs are meant to break. Trade the imbalance in between.”

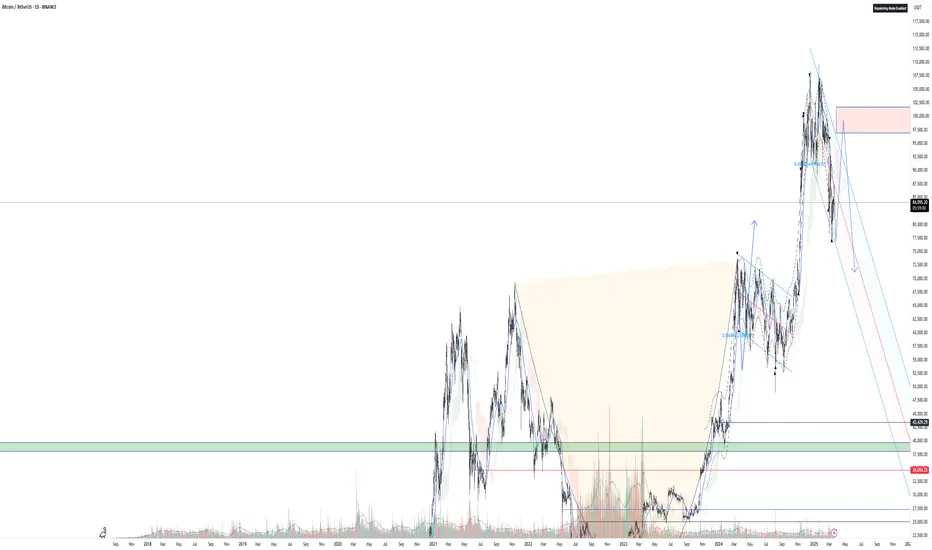
BTCUSD Technical Analysis – V-Shaped Recovery Points to BreakoutBitcoin (BTCUSD) is showing strong bullish momentum following a textbook V-shaped recovery from the recent support zone around $73,699. After consolidating and breaking the descending channel, BTC surged with conviction, reclaiming critical levels and now approaching the previous All-Time High (ATH).
Key Technical Highlights
Pattern: V-Shaped Recovery
Support Zone: $73,699 – $75,000
Resistance/ATH: $109,255
Trendline: Long-term bullish trend remains intact
Recent Breakout: Clean breakout above the falling wedge/descending channel
BTC has reversed sharply from the bottom, printing higher highs and higher lows. This aggressive rebound has brought price action back toward ATH levels, with strong chances of a breakout continuation.
The structure suggests bullish control, especially after retesting key areas with strength.
Bitcoin Dominance at 62.2%
Bitcoin's market dominance sits at 62.2%, showing clear investor confidence and capital preference for BTC over altcoins. This dominance level reinforces the bullish bias as smart money flows into Bitcoin in anticipation of a potential price discovery breakout.
This trend, along with large institutional inflows, highlights a growing belief in BTC’s strength as a leading asset, especially in the current macro environment.
BTCUSD Trade Setup (As Per Chart)
🎯 Entry $104,732.85
⛔ Stop Loss $99,507.06
✅ Take Profit $114,359.25
The trade idea is based on the continuation of the current uptrend and breakout above $109,255, which previously acted as resistance (ATH). A clean daily close above this level would likely open the path toward $114,359 and possibly $116,000+ as the next milestone.
BTC is primed for a new leg higher. The market structure favors bulls with BTC dominance rising, large investments entering, and strong technical recovery in place. If Bitcoin holds above the entry zone and pushes through ATH, we may see a new high forming in the coming weeks.

$FHE/USDT Chart Update$FHEUSDT/USDT Chart Update
Strong bounce from the demand zone
6h structure holding firm with a clear bullish reaction
Entry: $0.095–0.097
SL: $0.08615
TP: $0.18484+
It looks ready to explode, so don’t sleep on this one! 👀
DYRO, NFA

BTC/USDT Crypto Heist - Bullish Breakout Blueprint!🔥 Thief Trading Style: BTC/USDT Bullish Heist Plan 🔥
Greetings, Money Makers & Market Robbers! 🤑
Ready to execute a daring heist in the Bitcoin vs. Tether (BTC/USDT) crypto market? 📈 Our Thief Trading Style combines technical precision and fundamental insights to target a bullish breakout. Follow this charted strategy to ride the wave and exit before the risky Red Zone. Let’s grab those profits together! 💪🎯
---
📊 Trade Setup: The Heist Plan
- Market: BTC/USDT (Crypto) 🌐
- Bias: Bullish Breakout 🌟
- Timeframe: 1D (Swing Trade) ⏰
Entry 📈:
- Breakout Entry: Wait for a clean breakout above the Moving Average (MA) at 108000. Place Buy Stop orders just above 108000 to seize the momentum. 🚀
- Pullback Entry: For lower-risk entries, set Buy Limit orders at the recent 15M/30M swing low (e.g., 105000-106000) to catch pullbacks. 📍
- Trader Tip: Set a TradingView alert for the 108000 breakout to stay ahead of the move! 🔔
Stop Loss 🛑:
- Breakout Traders: After the breakout confirms, place your Stop Loss below the recent 1D swing low at 96000 to guard against reversals. ⚠️
- Pullback Traders: Tailor your Stop Loss to your risk appetite (e.g., 1-2% of account). Adjust based on lot size and multiple orders. 📏
- Risk Alert: This heist is high-stakes! Stick to disciplined position sizing to protect your capital.🔥
Target 🎯:
- Aim for 122000, near the risky Red Zone (an overbought area prone to consolidation or reversal). 🏴☠️
- Exit Strategy: Consider taking profits early if bearish signals (e.g., high volume, reversal candles) emerge near 122000. 💸
Scalpers 👀:
- Stick to Long-side scalps with tight trailing stops. Join swing traders for the full heist or scalp quick moves if your capital allows. 💰
---
📡 Why This Heist Has Potential
BTC/USDT is in a neutral trend with strong bullish prospects, driven by:
- Technicals: A breakout above the 108000 MA, backed by higher lows on the 1D chart, signals robust momentum. 📊
- Fundamentals: Institutional buying and positive crypto sentiment (check COT reports) fuel upside potential. 📰
- Seasonal Trends: Bitcoin often rallies in Q2, aligning with our setup. 📅
- Intermarket Factors: USD weakness and altcoin strength could lift BTC higher. 🌎
---
⚠️ Risk Management: Secure Your Gains
- News Caution: Skip new trades during major news events (e.g., CPI, FOMC) to avoid volatility spikes. 🗞️
- Trailing Stops: Use trailing Stop Loss to lock in profits as price nears 122000. 🔒
- Position Sizing: Limit risk to 1-2% of your account per trade for a safe heist. 🚨
---
💥 Power Up the Heist! 💥
Join our Thief Trading Style crew by liking, commenting, and following for more high-energy trade plans! 🚀 Your support strengthens our market raids, helping us profit with precision. Let’s conquer BTC/USDT together! 🤝🏆🎉
Stay Sharp: Another heist plan is on the horizon. Keep your charts locked and loaded, traders! 🐱👤😎
#BTCUSDT #Bitcoin #Crypto #Bullish #SwingTrading #Breakout

$BTC Looking Bullish CRYPTOCAP:BTC $104,987 resistance testing, as expected some struggle here at given key resistance area. $103,093 support tested and holding as of now, Bullish engulfing on last 1D close, need to see if it gets follow thru Today. RSI on 1D in oversold region, 4H RSI looking good, 18H left to close current weekly, looking bullish as MACD turns green, $99,361 remains key support, current support range $103,093-$102,280.

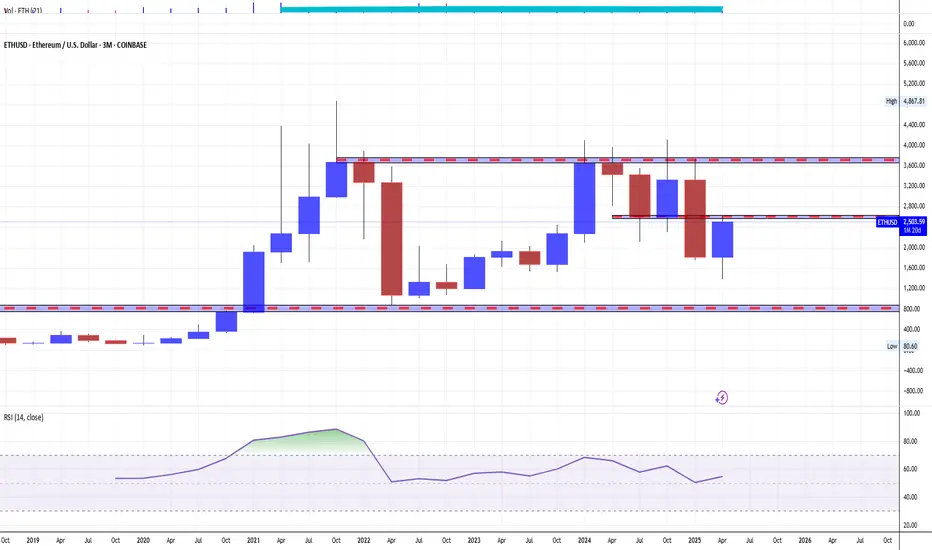
(BTC) Technical Outlook: Imminent ATH ReversalBitcoin’s rejection at ~$105 000 completes a classic A–B–C corrective pattern in a low-liquidity zone. Failure to hold $90 000–$85 000 will likely trigger a rapid decline toward the primary support at $32000. Only a weekly close above $105 000 on strong volume would invalidate this bearish outlook.

BTC SHORT TP:101,500 10-05-2025🚨 Short setup locked in!
We’re going for 101,500 on the 4H chart, with an expected move in the next 20 to 30 hours.
This comes after a clear fake breakout — and now the risk-reward is looking 🔥
The setup is clean, the timing is right.
You manage your stop the way it fits your strategy — I just bring the move.
Follow for updates and let’s execute with precision.
#BTC #ShortSetup #TradeClean

Btc Future Scalp setupEnter at cmp 104200 2nd entry 103k, Sl 1hr closes below 102920 on binance future chart. Tp 106k this is a touch n go zone so put limit 105.8k. until unless we don't closes below 102920 at least 2hrs candle chances are high for new ath.

BTC TradeditionAs you can see on the chart, the price has entered the cloud, the lag line is below the price and the future cloud is red, so I will watch the price and not enter the order.
Price zones to watch:
- 102k-105k$
- 90k- 92k$
- 70- 73k
These are strategic price zones that need close attention for the next price trend

BTC in 17 April 2025Potential Major Move on Thursday, April 17, 2025 📍
📊 Based on an analysis of historical Bitcoin chart averages and similar patterns, there is a likelihood of a significant price movement on this date.
This analysis is conducted using technical analysis and a detailed examination of Bitcoin’s movement averages. It suggests that approximately every 150 days after the start of a neutral trend, we can expect a sharp upward or downward move that sets the stage for the main trend in the future.
📅 As of the current date, March 29, 2025, there are about 18 days left until this significant event.
You can follow the results of this analysis and the conducted review on TradingView on the specified date.

BTC LONG TP:105,300 10-05-2025🚀 Bullish continuation in play!
We’re going LONG with a target at 105,300, following a clear continuation pattern on the 1H chart 📈
Entry zone is between 102,500 and 103,200 — a clean range to stack your position.
This move should develop over the next 6 to 8 hours, so precision and timing are key ⏳
Price action shows strength, and the momentum is still on our side.
Manage your stop in a way that fits your personal strategy — stay sharp, trade smart.
Follow me for updates and let’s bag those greens together 💰🔥
#BTC #PriceAction #Reydragon2
