BTC SHORT TP:98,800 08-10-2025🚨 Short setup activated!
We’re aiming for 98,800 on the 2H chart, as BTC enters the selling zone between 103,500 and 105,000.
Momentum is fading — the price looks tired, and this area is primed for a reversal 📉
We expect this move to unfold within 24 to 48 hours, possibly with manipulative spikes to 105k–106k before the real drop begins.
Add your short in a way that fits your strategy — be sharp, be tactical.
Follow for updates and let’s profit from the downside together 🔥💰
#BTC #ShortSetup #PriceAction
1-BTCUSD

BITCOIN Has Unfinished Business Below $74K! Will It Return?Key Disclaimer: Inefficiencies Don’t Need to Be Filled
Let’s set the stage clearly: inefficiencies like the one at $73,624.98–$74,420.69 for BTCUSD do not HAVE to be filled.
They’re a TENDENCY, not a rule, an intriguing opportunity to explore high-probability zones. If Bitcoin doesn’t return to this level, no harm is done; but this is a very good opportunity to analyze the term, as such... let’s break it down.
What Is an Inefficiency?
An inefficiency, or sometimes a fair value gap (FVG), is a price range with "minimal" trading activity, often caused by a rapid move—here, a rally—creating a liquidity imbalance. On the weekly BTCUSD chart, this area between wicks spans $73,624.98 to $74,420.69, likely formed during a sharp rally around April 2025.
This untested range makes it a potential target for future price action, as markets often seek to resolve such imbalances. Notably, the price has already approached this zone, and there’s a chance it may never return. However, around $74,400, there are still some “unfinished things to do”, untested liquidity, or orders, which could draw the price back if conditions align.
Why Do Inefficiencies Attract Price?
Inefficiencies often act as magnets for price due to:
Liquidity Seeking: Markets revisit areas with unfilled liquidity (stop-loss or pending orders) to balance supply and demand.
Market Memory: Traders and algorithms, target these levels, reinforcing their significance.
Mean Reversion: After rapid rallies, the price may retrace to test imbalances before continuing. (atm we are probably too far from it but still keep this area in your minds)
Institutional Activity: Large players might re-enter at these levels, making them key zones for reversals or consolidation.
Historically, assets tends to revisit such areas, as the chart notes.
BTCUSD Context: $103,000 with Bullish Momentum
As of May 10, 2025, BTCUSD is at ~$103,200 on the weekly chart, on the way to confirm a weekly breakout above $100,000, supported by higher highs, an ascending channel, and macro factors ( for example ETF inflows), signaling quite a strong momentum.
The inefficiency at $73,624.98–$74,420.69 is 28–29% below the current price, a deep pullback that might require a catalyst like a macro correction, negative crypto news, or profit-taking. Given the price has already approached this zone, it may not return, but the “unfinished business” around $74,400 keeps it on the radar. Still, strong trends can bypass inefficiencies, and factors like time decay or adoption may drive prices higher.
Trading Approach, Short-, Mid-Term Investors Take Your Profits!
This formation of inefficiency is not a prediction to short, it’s an opportunity to monitor.
Still, if you’re a short- to mid-term investor, it might be a smart move to take some profits here and observe what unfolds next.
Right now, we’re potentially seeing a double top forming around major psychological levels. And to be honest, the inefficiency below (shown on the chart) still lingers in the back of my mind.
People often ask me: “When is a good time to take profits?”
My answer? Now. It is a perfect example and it fits to all assets.
And here's why. There are clear scenarios that help remove the guesswork:
1. You sell now, and the price continues to rally higher.
That’s not a problem. By selling, you’ve reduced your risk, and securing your profits - always a smart move.
If the price breaks above $100K, you can always buy it back after a confirmed breakout and retest.
That’s a strong sign that investors are willing to pay higher prices for BTC, and historically, after such breakouts (like with the $50K level in August 2024), the market tends to come back to retest that breakout zone.
Of course, if you’re a long-term investor with a 3-5+ year horizon, you may choose to ride it out. In that case, trying to time this might just be over-managing your position. There’s always a chance BTC won’t retest $100K again.
2. The best-case scenario if you take profits now:
You get the chance to buy back lower.
If the market pulls back, keep that inefficiency level in mind—there’s also a mid-term trendline, previous yearly highs, and other technical elements that haven’t been tested yet.
Traders’ psychology hasn’t really been pushed to the limits at this stage, and in my view, the crypto market loves to test limits.
So if you’re a short- or mid-term investor who bought in at lower levels, this is a good time to seriously consider locking in some profits.
Step back, and let the price action guide the next move.
Listen—just listen.
Conclusion
Inefficiencies like the one between $73,624 and $74,420 don’t demand to be filled—but they’re worth understanding, tracking, and learning from. Whether price revisits that zone or not, the real value lies in recognizing where the market has moved too fast and what that might mean if momentum shifts.
Right now, BTCUSD is strong. But strength can fade, sentiment can shift, and “unfinished business” below still holds weight for traders who think in probabilities, not certainties.
If you’re in profit—especially from lower levels—this might be one of those moments to pause, and make sure greed isn’t driving your next decision.
Whether this zone becomes just a memory or a brilliant case study, it’s already a valuable example of how understanding market structure helps you stay a step ahead—not a step behind.
Stay alert. Stay humble. And as said… listen.
Cheers,
Vaido

(BTC/USD) 1H Trade Setup – Key Entry, Stop Loss & Dual TargetEntry Point: 95,431
Stop Loss: 95,264
Target Points:
Upside (Target 1): 100,674 (Potential gain: +5.36%)
Downside (Target 2): 86,614 (Potential loss: -7.57%)
Trade Setup:
Risk-Reward Ratio:
Approx. 1:0.7 (Not ideal; the reward is smaller than the potential loss)
Support Zones:
Highlighted in purple beneath the entry zone — this indicates a historically strong support area.
Resistance Zones:
The upper purple zone marks the next significant resistance around 100,000–100,795.
Technical Indicators:
50 EMA (Blue Line): Indicates mid-term trend support, currently holding price action.
Price Action: BTC appears to be retracing toward support after a bullish rally.
Interpretation:
The setup implies a long (buy) position with a very tight stop loss.
The price is nearing a support zone, and if it holds, there's potential for an upward move to the target at 100,674.
However, if price breaks below 95,264, a sharp drop to 86,614 is anticipated.

Potential Breakout Opportunity for BTC/USDT Potential Breakout Opportunity for BTC/USDT
Bitcoin (BTC/USDT) is showing interesting price action on the 15-minute timeframe. After a period of consolidation, the price appears to be testing a key resistance level around $103,700. We can observe a series of higher lows forming, suggesting increasing bullish pressure. A decisive break above this resistance, confirmed by strong volume, could signal the start of an upward move towards the $104,300-$104,500 area, as indicated by the blue arrow.
Traders might look for entry opportunities on a confirmed breakout above the resistance, with potential stop-loss levels placed below the recent swing lows (e.g., around $103,150) to manage risk. This analysis focuses on short-term price action and potential breakout scenarios. Remember to conduct your own thorough research and consider broader market conditions before making any trading decisions.
Key Observations:
* Resistance Level: $103,700 area acting as a significant hurdle.
* Higher Lows: Suggesting increasing buying interest.
* Potential Target: $104,300 - $104,500 zone if the breakout is successful.
* Risk Management: Important to define stop-loss levels.
This description avoids overly aggressive or promotional language and focuses on technical analysis observations, which is generally well-received on platforms like TradingView.

☄️ Bitcoin : If You're Believer 🅱️ I'd Be A Buyer ☀️Bitcoin 🌏
I'm Going To
Put It To
You Plain And
Simple
If You're Long Term Investor/Believer
I'd Be Buying At These Levels
🎱
BTC/USD
BTC/JPY🏯
BTC/AUD
BTC Total Market Cap
BINANCE:BTCUSD
CRYPTOCAP:BTC
INDEX:BTCUSD
👩🏼🚀👩🏼🚀🚀

3-year bull market, 1-year bear market pattern
Hello, traders.
If you "Follow", you can always get new information quickly.
Please click "Boost" as well.
Have a nice day today.
-------------------------------------
(BTCUSDT 12M chart)
It has been showing a pattern of 3-year bull market and 1-year bear market since 2015.
If this pattern continues, it is expected that 2025 will be the last bull market.
2015-2017: Up about 12124%
2019-2021: Up about 1971%
In the uptrend that started in 2023, the maximum uptrend point is expected to be around the Fibonacci ratio 3.618 (178910.15).
Before that, we need to see if the price can be maintained by rising above the Fibonacci ratio 2.168 (134018.28).
Since the increase is showing a sharp decrease in the increase as the price rises, I think the increase in 2025 is likely to be not that great.
-
(BTCUSDT 12M chart)
If we look at this on the BTCUSDT chart, it is the same as the chart above.
We will have to see the movement when the downtrend starts, but the current expected range is expected to be around 69K.
It is expected that the price range below 42K will never be seen again.
-
Thank you for reading to the end.
I hope you have a successful trade.
--------------------------------------------------
- Here is an explanation of the big picture.
I used TradingView's INDEX chart to check the entire range of BTC.
I rewrote it to update the previous chart while touching the Fibonacci ratio range of 1.902 (101875.70) ~ 2 (106275.10).
(Previous BTCUSD 12M chart)
Looking at the big picture, it seems to have been maintaining an upward trend following a pattern since 2015.
In other words, it is a pattern that maintains a 3-year uptrend and faces a 1-year downtrend.
Accordingly, the upward trend is expected to continue until 2025.
-
(Current BTCUSD 12M chart)
Based on the currently written Fibonacci ratio, it is displayed up to 3.618 (178910.15).
It is expected that it will not fall again below the Fibonacci ratio of 0.618 (44234.54).
(BTCUSDT 12M chart)
Based on the BTCUSDT chart, I think it is around 42283.58.
-
I will explain it again with the BTCUSD chart.
The Fibonacci ratio ranges marked in the green boxes, 1.902 (101875.70) ~ 2 (106275.10) and 3 (151166.97) ~ 3.14 (157451.83), are expected to be important support and resistance ranges.
In other words, it seems likely that they will act as volume profile ranges.
Therefore, in order to break through these ranges upward, I think the point to watch is whether they can receive support and rise near the Fibonacci ratios of 1.618 (89126.41) and 2.618 (134018.28).
Therefore, the maximum rising range in 2025 is expected to be the 3 (151166.97) ~ 3.14 (157451.83) range.
In order to do that, we need to see if it is supported and rises near 2.618 (134018.28).
If it falls after the bull market in 2025, we don't know how far it will fall, but based on the previous decline, we expect it to fall by about -60% to -70%.
Therefore, if it starts to fall near the Fibonacci ratio 3.14 (157451.83), it seems likely that it will fall to around Fibonacci 0.618 (44234.54).
I will explain more details when the bear market starts.
------------------------------------------------------


BITCOIN ( Is this the final DIP ? )I bought the dip but it just keeps dipping!
it's time to put on my bear glasses and check this ponzi chart !! oh yeah
As you can see in these patterns the moments everyone ready for breakout, bitcoin dumps to another lower level and kills all hopium that moonboyz, frog army and GM gurus got
if you think that you are person who manage to buy the exact number at dip you are wrong too, like people who bought at 60k and had plan to sell at 90k
RSI looks bearish like the pattern , I start shorting at 17490 and not going to close it till 16950$
If you got crypto on Huobi and Gemini exchange watch out too
funds are NOT safu

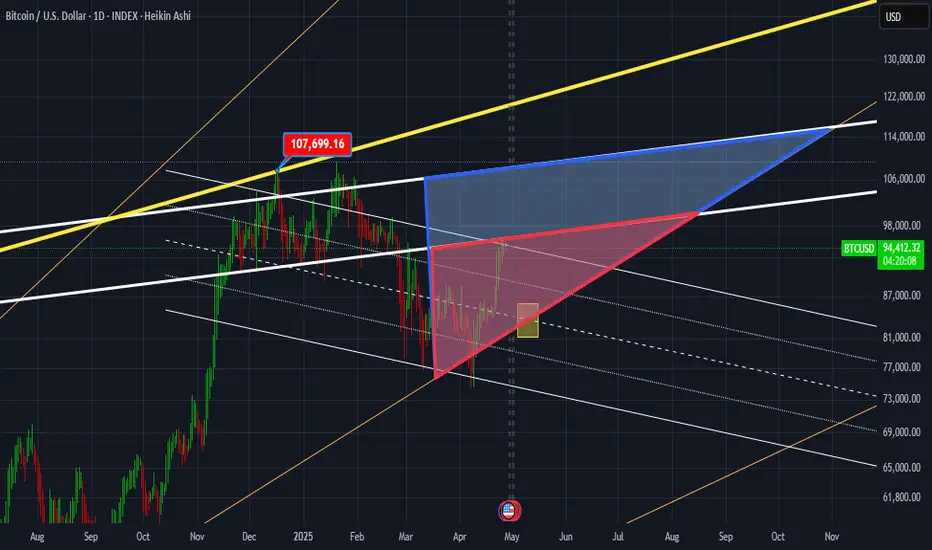
BTC in Bermuda triangle!I love shapes. Shapes have a rich and deep philosophy and give you an idea of what's going on in the mind of market's major players. BTC is no longer an infant, in fact, just like you, it's getting older and older everyday! "Now" the market movements are far beyond simple pump and dumps. No more slides in the park for baby bitcoin! Watch the small red triangle and the big blue one. The lovely yellow rectangle waves hands!
BTCUSD Technical Analysis – Is a Pullback Coming Soon?BITSTAMP:BTCUSD is currently trading within a clearly defined ascending channel, with price action now testing the upper boundary. This level may act as a dynamic resistance, and rejection here could trigger a corrective move towards the $98,000 support zone.
If buyers defend this support level, the bullish structure remains intact, with potential to move back toward higher levels. However, if price breaks below this zone, there will be little to stop it from falling further.
Monitoring candlestick patterns and volume at this key area is essential to identify potential buying opportunities. Risk should be managed properly—always confirm your setups and trade with solid risk management.
If you have any thoughts on this setup or additional insights, feel free to share them in the comments!

BTC - Upcoming bearish trendI think we are topping. Why?
The wave structure terminating the low is a 3 wave structure... or as it appears to me atleast.
For a trend to truly be a convincing reversal, we should be seeing a 5 wave structure indicating the end of the wave structure.
This is complex and the overall bullish sentiment makes me believe that we will top sooner or later.

BITCOIN (BTC/USD) - Testing Key Resistance Levels - Weekly ChartBitcoin (BTC/USD) is currently testing key resistance levels and potential all-time highs in 2025.
BTC price bounced up from the April 7th 2025 support ($78000) and continues to rally.
Price needs to hold above $95000 and $85000 support levels to maintain an uptrend in 2025.
Resistance targets to the upside are: $105000, $110000, $117000, $128000, $142000.
Support targets to the downside are: $100000, $90000, $83000, $75000, $70000.
Tariffs and trade deal news, stock market corporate earnings, government law changes and announcements, and consumer sentiment can all affect the price of Bitcoin.

Bitcoin Weekend MAPIm expecting a pullback this weekend and a new Buy
Levels in the chart
Manage Risk and Levels can be sligly different i track them as they approach
GG

Bitcoin -Weekly Forecast, Technical Analysis & Trading IdeasMidterm forecast:
86499.57 is a major support, while this level is not broken, the Midterm wave will be uptrend.
We will close our open trades, if the Midterm level 86499.57 is broken.
MARKETSCOM:BITCOIN BITSTAMP:BTCUSD
Technical analysis:
A trough is formed in daily chart at 74545.70 on 04/09/2025, so more gains to resistance(s) 105431.17, 109932.90, 115000.00 and more heights is expected.
Take Profits:
86499.57 ✅
91037.20 ✅
94505.46 ✅
98675.19 ✅
101430.12 ✅
105431.17
109932.90
115000.00
120000.00
125000.00
132000.00
140000.00
150000.00
160000.00
167666.00
________________________________________________________________
❤️ If you find this helpful and want more FREE forecasts in TradingView,
. . . . . . . . Hit the 'BOOST' button 👍
. . . . . . . . . . . Drop some feedback in the comments below! (e.g., What did you find most useful? How can we improve?)
🙏 Your support is appreciated!
Now, it's your turn!
Be sure to leave a comment; let us know how you see this opportunity and forecast.
Have a successful week,
ForecastCity Support Team

Bitcoin Smashes $103K: Is $150K Just Around the Corner?Bitcoin's Resurgence: Navigating the $100K Breakthrough and What Comes Next
In a remarkable display of market resilience, Bitcoin has reclaimed the coveted $100,000 level, just three months after dropping below this significant psychological threshold. The flagship cryptocurrency's powerful comeback has sent shockwaves through financial markets, triggering a massive short squeeze and reigniting debates about Bitcoin's long-term potential. As the asset pushes beyond $103,000 and approaches its previous all-time high, traders and investors are scrambling to position themselves for what many believe could be the next phase of an extraordinary bull cycle.
The Historic Reclamation of $100K
Bitcoin's journey back to $100,000 represents more than just a numerical milestone—it's a testament to the asset's remarkable resilience in the face of significant headwinds. After briefly touching six-figure territory in early 2025, Bitcoin experienced a substantial correction that saw prices retreat below $90,000, triggering concern among market participants and no shortage of bearish predictions from skeptics.
What makes this recovery particularly impressive is the speed with which it occurred. Historically, Bitcoin has often experienced extended consolidation periods after major corrections, sometimes lasting months or even years. The rapid three-month turnaround suggests underlying strength in Bitcoin's market structure that distinguishes this cycle from previous ones.
On-chain data reveals fascinating dynamics behind the recovery. Throughout the correction, long-term holders continued accumulating Bitcoin, with wallet addresses holding more than 1 BTC increasing by 5.2% even as prices declined. This pattern of "smart money" accumulation during periods of retail fear often precedes significant upward price movements.
The reclamation of $100,000 also coincided with several favorable macro developments, including renewed expectations for central bank easing and diminishing concerns about regulatory crackdowns. These factors, combined with Bitcoin's post-halving supply dynamics, created ideal conditions for a powerful recovery.
The Massive Short Squeeze
A key accelerant in Bitcoin's surge beyond $100,000 was an extraordinary short squeeze that forced bearish traders to cover their positions at increasingly higher prices. Data from cryptocurrency derivatives platforms reveals that over $850 million in short positions were liquidated during a 72-hour period as Bitcoin broke above key resistance levels.
The mechanics of a short squeeze are particularly powerful in cryptocurrency markets due to the prevalence of leverage. Many platforms offer leverage ratios of 10x, 20x, or even higher, meaning relatively small price movements can trigger automatic liquidations. As these liquidations occur, trading algorithms automatically purchase Bitcoin to close the short positions, creating additional upward pressure on prices and potentially triggering more liquidations in a self-reinforcing cycle.
What made this particular short squeeze especially impactful was its timing relative to market sentiment. The Crypto Fear & Greed Index had been hovering in "Neutral" to "Fear" territory for weeks, indicating widespread caution among market participants. This cautious positioning resulted in a market structure where relatively few traders were positioned for upside, creating the perfect conditions for a powerful squeeze when momentum shifted.
Is $150,000 Now Conservative?
In light of Bitcoin's powerful resurgence, price predictions that once seemed ambitious are being reevaluated. Earlier this year, several major financial institutions and research firms issued year-end targets of $150,000 for Bitcoin—forecasts that were met with skepticism by many market observers. Now, with Bitcoin already above $103,000 and demonstrating strong momentum, these once-ambitious targets appear increasingly conservative.
Technical analysts point to several factors supporting the case for higher prices. The weekly Relative Strength Index (RSI), despite the recent surge, remains below extreme overbought levels that typically signal exhaustion. Additionally, volume profiles show relatively little resistance above the previous all-time high, suggesting potential for rapid advancement if that level is breached.
The most bullish analysts have begun floating targets of $170,000 to $200,000 for this cycle, basing their projections on Fibonacci extensions, comparative analysis with previous bull markets, and on-chain metrics indicating strong holder conviction. These projections represent a dramatic shift in market sentiment compared to just a few months ago when many were questioning whether Bitcoin would reclaim $100,000 within the year.
Is It Too Late to Buy Bitcoin?
As Bitcoin pushes beyond $103,000, the perennial question resurfaces: is it too late to buy Bitcoin? This query, which has appeared at virtually every significant price level in Bitcoin's history, reflects the challenge of evaluating assets in price discovery mode without extensive historical reference points.
Historical perspective offers valuable context for addressing this question. Investors who asked whether it was "too late" to buy Bitcoin at $10,000, $20,000, or $50,000 and chose to remain on the sidelines missed substantial returns. However, those who purchased at local tops often endured extended drawdowns before seeing their investments return to profitability.
On-chain data provides additional perspective for evaluating current price levels. The MVRV (Market Value to Realized Value) ratio, which compares Bitcoin's market capitalization to its realized capitalization, currently sits around 2.8—elevated compared to bear market conditions but significantly below the extreme readings above 4.0 that characterized previous market tops.
Similarly, the percentage of Bitcoin supply in profit currently stands at approximately 93%, approaching but not yet reaching the 98-99% levels typically seen at cycle peaks. These metrics suggest that while Bitcoin isn't in "bargain" territory, present valuations haven't reached the extreme overvaluation levels that preceded major corrections in previous cycles.
Bull Run Warning: Navigating the Path Forward
While enthusiasm surrounds Bitcoin's reclamation of $100,000, experienced market participants recognize the importance of maintaining perspective during periods of strong momentum. Several potential warning signs merit attention as traders navigate the current environment.
The rapid nature of Bitcoin's ascent to $103,000 has created technically overbought conditions on shorter timeframes, suggesting the potential for near-term consolidation or pullbacks. The daily RSI has reached levels above 80, a zone that has historically preceded at least temporary pauses in uptrends, even during the strongest bull markets.
Additionally, funding rates on perpetual futures contracts have reached extremely positive levels, indicating traders are paying significant premiums to maintain long positions. This condition often occurs near local tops as market participants become overly enthusiastic about near-term prospects.
Risk management becomes particularly important during such periods of strong momentum. Many professional traders reduce position sizes when volatility increases, recognizing that while potential returns expand during such phases, so do potential drawdowns.
Next Price Targets: From $106K to $1M
As Bitcoin pushes into record territory, analysts have begun identifying potential targets for the next phase of the bull cycle. The immediate focus remains on the previous all-time high around $106,000, which represents both a psychological and technical resistance level. Beyond this point, limited historical price action creates a potential vacuum that could allow for rapid advancement if bullish momentum continues.
Technical analysts have identified several key levels through Fibonacci projections and extension analysis. The 1.618 Fibonacci extension from the previous major correction projects a target around $122,000, while the 2.618 extension suggests potential toward $170,000. These levels represent natural points where the market might experience resistance or consolidation during continued uptrends.
More ambitious predictions extend considerably higher. The stock-to-flow model, which relates Bitcoin's scarcity to its market value, suggests potential long-term valuations approaching $1 million per Bitcoin. While such forecasts remain highly speculative, they illustrate the wide range of potential outcomes for this emerging asset class.
Support levels are equally important to monitor, particularly for traders managing risk in leveraged positions. The psychological $100,000 level now represents initial support, followed by the $94,000-$96,000 zone where significant buying emerged during the recent advance. The 50-day moving average, currently around $92,000 and rising, provides an additional technical reference point for potential support during pullbacks.
Market Sentiment: Fear and Greed Dynamics
Market sentiment indicators provide valuable context for understanding Bitcoin's current positioning. The Crypto Fear & Greed Index has shifted into the "Greed" zone after spending much of the previous month in "Neutral" territory, reflecting improved market sentiment following Bitcoin's reclamation of $100,000.
This transition marks an important psychological shift but also signals increasing risk of overexuberance. Historically, when the index reaches extreme readings in either direction, it has often served as a contrarian indicator. Extreme greed readings have typically occurred near local tops, while extreme fear has often presented buying opportunities.
Social media activity metrics reveal a significant increase in Bitcoin-related discussions, with sentiment analysis showing predominantly positive expressions. Google Trends data indicates search interest for "Bitcoin" has reached its highest level since January, suggesting renewed attention from retail participants who typically enter during periods of strong price performance.
Institutional sentiment provides a contrasting perspective to retail excitement. Surveys of professional investors indicate a more measured outlook, with many maintaining Bitcoin allocations but expressing concern about near-term volatility and the potential for consolidation after the recent surge. This divergence between institutional caution and retail enthusiasm creates an interesting dynamic that may influence price action in the weeks ahead.
Trading Strategies for the Current Environment
For traders navigating Bitcoin's volatile price action, adapting strategies to current market conditions is essential. Different approaches suit varying risk tolerances and time horizons, particularly during periods of expanded volatility and strong directional momentum.
Trend-following strategies have performed exceptionally well during Bitcoin's recent advance, with systematic approaches based on moving average crossovers or momentum indicators capturing much of the upside movement. These strategies typically involve entering positions when short-term momentum aligns with longer-term trends and using trailing stops to protect profits.
Countertrend strategies face greater challenges in the current environment but can still prove effective when applied with appropriate risk parameters. These approaches involve identifying potential exhaustion points where trends might temporarily reverse, typically using oscillators like RSI or Stochastic indicators to identify overbought or oversold conditions.
For longer-term investors, dollar-cost averaging continues to demonstrate effectiveness in navigating volatile markets without requiring precise timing decisions. This approach involves regularly purchasing Bitcoin in fixed dollar amounts regardless of price, mathematically ensuring better average entry prices during periods of volatility.
Conclusion: Navigating Bitcoin's New Era
Bitcoin's resurgence beyond $100,000 represents a significant milestone in cryptocurrency market development, potentially signaling the beginning of the next phase in this remarkable asset's evolution. The speed and magnitude of the recovery from below $90,000 to above $103,000 demonstrates both the volatility inherent in this emerging asset class and the powerful market forces that can drive prices when technical breakouts coincide with favorable fundamental catalysts.
For traders and investors, the path forward requires balancing enthusiasm about Bitcoin's demonstrated resilience with pragmatic risk management appropriate for an asset capable of significant price swings in both directions. While the backdrop appears favorable for continued strength, history suggests the journey will include both exhilarating advances and challenging retracements.
As market participants position themselves for what may come next, maintaining perspective on both historical precedents and the unique aspects of the current market cycle provides the most sustainable approach to navigating this dynamic landscape. Bitcoin's breakthrough beyond $100,000 creates both opportunity and risk—the traders who successfully balance these competing forces while maintaining disciplined execution will likely find the greatest success in capturing the potential of this extraordinary market.
The question is no longer whether Bitcoin can reach $100,000, but rather how far beyond this once-unimaginable milestone the current cycle might extend. For an asset that began trading at fractions of a penny, the reclamation of six-figure territory serves as a powerful reminder of cryptocurrency's capacity to challenge conventional financial assumptions and create paradigm-shifting returns for those willing to embrace both its potential and its risks.

#BTCUSDT. Is ready for a retest of 103.98 and higher.Structurally, over the next few days it looks like an attempt by the First Cryptocurrency to adjust its recent growth with a small correction into the zone of 92000-90200 - near these levels one can look for setups for buying.
Near these zones there may be an attempt to buy back at 103.98.
It looks promising, we are watching.

TOTAL 2 ANALYSEThe longer BTC dominance continues to decline, the more likely it is that Total 2 will break through key resistance levels.
For now, I’m anticipating a retest of the highlighted area, which would support a logical continuation to the upside, in line with the H4 analysis on BTC dominance.

BTC/USDT 1H Chart: Testing Critical Support!Bitcoin is at a pivotal moment after showing weakness at $104,000 !
BTC recently hit a high of $104,338 but failed to hold, pulling back to $102,500 . The big question now: will this level hold as support?
I seeing a potential support at $102,500 . A break below could send BTC toward the Prev Day Mid at $100,600 , while a bounce might push it back toward $104,000 or even $109,100 to Yearly Highs.
Key Levels to Watch:
Resistance: $104,000
Support: $102,500, $100,600 (Prev Day Mid)
Breakout Target: $109,100
Breakdown Risk: $98,00
Will BTC hold $102,500 , or are we in for a deeper correction? Let’s hear your thoughts below!


Bitcoin Btc usdt Daily analysis
Time frame daily
As you can see byc is moving up and down in the green tunnel
My last target (yellow rectangle) is touched and byc couldn't break the upper side of tunnel
Now, my target is 120.000 $ ( red rectangle)
If this time , btc can break the green uptrend line as resistance line , my next target is 145.000$,
👉👉Important notice 👈👈
Here is not suitable Time for entry the long or short position because btc is in the middle of the tunnel

HolderStat┆BTCUSD stairway to 115K?CRYPTOCAP:BTC after breaking the resistance trend line is preparing to rise to $115,000, before which another consolidation in the triangle may be waiting for it.
BTC NEW UPDATE (4H)This analysis is an update of the analysis you see in the "Related publications" section
Bitcoin has not yet reached our zone, but it has formed a correction of the same degree as the previous ones and has also created a support area. The diametric pattern could potentially shift into a symmetrical one, and Bitcoin may even reach the 100K–105K zone.
We should keep a close eye on the 100K level for now, as it also serves as a psychological resistance.
For risk management, please don't forget stop loss and capital management
Comment if you have any questions
Thank You

BTCUSD INTRADAY bullish breakout above 100,00The BTC/USD pair maintains a bullish overall sentiment, underpinned by a sustained upward trend. However, recent intraday price action suggests a phase of sideways consolidation, indicating a potential buildup before the next directional move.
Key Levels:
Support: 96,000 (primary), followed by 93,875 and 90,850
Resistance: 104,100, with extended targets at 106,550 and 109,000
A corrective dip toward the key support zone at 96,000 could offer a bullish rebound opportunity. A successful bounce from this level would reinforce the uptrend and pave the way for a test of the 104,100 resistance. A breakout above this level may open the door to further gains toward 101,030 and 106,550 and 109,000 over the longer term.
Conversely, a decisive break and daily close below 966,000 would invalidate the bullish setup, potentially triggering a deeper pullback toward the 93,875 and 90,850 support levels.
Conclusion:
While the broader trend remains bullish, BTC/USD is currently consolidating. Traders should watch the 96,000 support closely—its defence may confirm trend continuation, while a breakdown could signal a short-term bearish reversal.
This communication is for informational purposes only and should not be viewed as any form of recommendation as to a particular course of action or as investment advice. It is not intended as an offer or solicitation for the purchase or sale of any financial instrument or as an official confirmation of any transaction. Opinions, estimates and assumptions expressed herein are made as of the date of this communication and are subject to change without notice. This communication has been prepared based upon information, including market prices, data and other information, believed to be reliable; however, Trade Nation does not warrant its completeness or accuracy. All market prices and market data contained in or attached to this communication are indicative and subject to change without notice.
