Bitcoin and altcoins are entering a correctionWe expect Bitcoin to reach around 80-83k.
Closer to the time, we’ll monitor and look for entry points in altcoins 🤔.
During this rapid rise, Bitcoin was actively sold on the Bitfinex exchange, +1 for a correction:
1-BTCUSD

Depth Study of Bitcoin's Value Trends: The Evolutionary CodeIn-Depth Study of Bitcoin's Value Trends: The Evolutionary Code Across Four Halvings
Authors: SanTi Li, Nahida, Legolas
Abstract: This paper focuses on Bitcoin's four halving events from 2012 to 2024, systematically reviewing the halving mechanism, inflation rate trends, and analyzing market performance before and after each halving to explore their impact on price movements. Through historical data analysis and macro comparisons, it is highlighted that Bitcoin has entered a cycle where its inflation rate is lower than that of gold, emphasizing its scarcity and establishing a long-term value logic comparable to traditional assets. Additionally, from the perspective of the four halving cycles, although the price increase post-2024 halving has been moderate, it is still in the accumulation phase, with the real window potentially opening between 2025 and 2026. The article concludes by discussing Bitcoin's core value foundations, including scarcity, decentralization mechanisms, and deflationary models, indicating its maturing logic as "digital gold."
1.Bitcoin Halving Cycle: Block Rewards and Inflation Rate
Bitcoin, designed by Satoshi Nakamoto in 2009, has a fixed total supply of 21 million coins. Initially, miners received 50 BTC per successfully mined block, with this reward halving approximately every 210,000 blocks (about four years), gradually reducing the new issuance. The halving cycle officially began in 2012, with subsequent halvings every four years. In 2024, the block reward became 3.125 BTC, leading to an annual inflation of 52,560 x 3.125 = 164,250 BTC, accounting for approximately 0.782% of the total supply.
This inflation rate is already lower than that of most developed countries and gold, which has an annual production inflation rate of about 1.5%-2%. Currently, Bitcoin has entered a cycle with an inflation rate lower than that of gold.
Fig.1 Bitcoin Halving Cycle Rewards and Inflation Rate Chart
As shown in the chart: When each block reward was 50 BTC, the annual increase was approximately 52,560 x 50 = 2.628 million BTC, about 12.5% of the total 21 million supply. In 2025, with a 6.25 BTC reward per block, the annual increase is 52,560 x 6.25 = 328,500 BTC, about 1.564% of the total supply.
As of around 14:00 on May 7, 2025, approximately 19,861,268 BTC have been mined, accounting for about 94.58% of the total supply, with a total market capitalization of approximately $2.034 trillion. Compared to the previous halving cycle in 2020, when about 18,385,031 BTC had been mined (approximately 87.5% of the total supply) and the total market capitalization was about $161.8 billion, the market cap has increased by approximately 1,236% over five years.
In the next four years, the annual inflation rate will be only 0.782%.
Fig.2 Comparison of Inflation Rates in Major Countries (2019-2025)
In 2019, China's inflation rate was about 2.9%, and the United States' was 2.3%. Due to the COVID-19 pandemic in 2020 and subsequent stimulus measures, it was predicted that the U.S. would experience significant inflation from 2020 to 2022. Indeed, the U.S. inflation rate reached a high of 8%, later decreasing to around 2.2% by 2024 due to Federal Reserve interest rate hikes. China's annual inflation rate is about 0.2%, effectively controlling inflation among major countries. Most developed countries have an inflation rate of around 2.5%, but the actual experience of currency devaluation may be more pronounced than statistical data suggests.
At this time, the latest Bitcoin halving will further reduce BTC's inflation rate to a new historical low of 0.782%. A lower inflation rate is generally beneficial for any asset, as it increases scarcity. However, this does not necessarily mean the asset's value will increase by 100% in the short term, but it is an important factor in resisting devaluation.
ii.Comparative Analysis of Market Performance After Four Bitcoin Halvings
Since Bitcoin's inception, each block reward halving has had a profound impact on BTC's market price. From 2012 to 2024, the four halving events exhibit relatively consistent cyclical characteristics. This paper compares market price trends before and after each halving to extract valuable patterns. History never repeats exactly, but before reaching peaks or nearing destruction, similar patterns often emerge.
Fig.3 BTC Value Changes Across Four Halving Cycles
The chart in Fig.3 summarizes BTC's trend data six months before and one year after each halving, as well as the highest point within the corresponding cycle. It shows that after each halving, Bitcoin's price experienced significant increases.
Using the closing price on the halving day as a baseline: 2012 halving: over 8,000% increase within one year 2016 halving: approximately 286% increase 2020 halving: approximately 475% increase 2024 halving: approximately 31% increase within one year (as of now), with a peak increase of 68.75% ($109,588)
1.Significant Price Increases Six Months Before Halving Reviewing the four halving events,
Bitcoin typically enters an upward trend six months prior to halving. For example:
●2012 halving: 141.03% increase compared to six months prior
●2024 halving: 118.88% increase compared to six months prior
This phase often corresponds to the market gradually pricing in the "halving expectation," serving as a strong preparatory signal.
2.Core Explosion Period 6–12 Months After Halving,
Not Necessarily the Peak Historical data shows that the 6–12 months following a halving are typically the main growth phase for Bitcoin:
●2012: 8,181.51% increase within one year
●2016: 286.29% increase
●2020: 475.64% increase
●2024: Currently, 31.18% increase, with a peak of 68.75% ($100.9k)
Especially in 2012 and 2020, the structure showed "consolidation within six months, followed by an explosion." After one year, the market entered the most significant growth phase, reaching new historical highs. As the 2024 halving has just passed one year, if history repeats, the real explosion window may open between 2025 and Q1 2026.
3.First-Year Post-Halving Trends Provide Preliminary Reference
After the 2024 halving, Bitcoin increased by 10.02% within a month but then experienced two months of fluctuation and correction, remaining in the accumulation phase. By October 2024 (six months post-halving), the price had only slightly increased by 6.30% compared to the halving day, far from entering the main growth phase. However, this is not uncommon historically, as both 2016 and 2020 saw significant price movements starting six months after the halving.
4.Bull Market Peaks Typically Occur 6–12 Months After Halving
Based on data from the first three cycles, the highest prices relative to the halving day's closing price occurred in the mid-term before the next halving:
●2012: 9,237.15% increase
●2016: 2,825.84% increase
●2020: 700.28% increase
In the current 2024 halving cycle, a peak of $109,588 has been observed, representing a 68.75% increase from the halving day, but it has not yet entered an exponential growth phase. This pattern applies only to the current cycle; if Bitcoin reaches values as high as $300,000–$500,000 or even $1 million, its valuation will be enormous. Unless there is significant devaluation of reference assets or further expansion of applications, such as interstellar exploration, it will be challenging to achieve multiple-fold growth in the next halving.
Chart Summary: Bitcoin's historical halving cycles exhibit a highly consistent three-phase rhythm: Accumulation and price increase (six months before halving) Stable fluctuation (six months after halving) Main growth explosion (6–18 months after halving) As the 2024 halving approaches its one-year mark, the market may still be accumulating energy for the later explosion phase, similar to the prelude to 2017, coinciding with the early period of Trump's presidency.
The Stock-to-Flow chart also indirectly supports the view that Bitcoin is still in a phase of accumulating strength. However, historical data and patterns are only for reference and should not be blindly followed; independent judgment and thorough research (DYOR) are essential.
Fig.4 Bitcoin Price Stock-to-Flow Chart
III. Scientific Attributes of Bitcoin's Long-Term Value
The value of an asset stems from both consensus and intrinsic worth. Long-term consensus, in particular, must be grounded in the asset’s inherent advancement, scientific underpinnings, and irreplaceable first-mover advantage. Bitcoin (BTC) is not merely a crypto asset — it is the culmination of breakthroughs in technology, economics, mathematics, cryptography, and more. Its long-term value is not sustained by market speculation alone, but rather built on a rigorous, verifiable, and manipulation-resistant system design.
1. Scarcity
As previously discussed, Bitcoin has a fixed total supply of 21 million coins, encoded in its protocol by Satoshi Nakamoto. Through a programmed halving mechanism, block rewards are reduced approximately every four years, with all coins expected to be mined by around the year 2140. Unlike fiat currencies which can be printed infinitely, Bitcoin’s deflationary nature supports its long-term appreciation from a supply-demand perspective.
Scarcity is the cornerstone of Bitcoin’s inflation resistance and lays the foundation for its status as "digital gold".
2. Decentralization: Neutrality Guaranteed by Consensus Mechanism
Bitcoin’s decentralized Proof-of-Work (PoW) consensus mechanism relies on computational power. Any node can verify transactions and participate in ledger maintenance. This structure avoids issues found in traditional financial systems such as central points of failure, power abuse, or systemic control. Its globally distributed nature significantly reduces the likelihood of a 51% attack.
3. Deflationary Model vs. Fiat Currency Devaluation
As shown in Fig.2 (not included here), Bitcoin's built-in deflationary issuance model starkly contrasts with the inflationary nature of global fiat currencies. Since 2020, central banks around the world have launched large-scale QE programs, resulting in currency overflows. Bitcoin has increasingly demonstrated its role as a hedge against fiat depreciation and asset bubbles. It is becoming a safe haven for capital in an era of diminishing trust in fiat money.
4. Technological Attributes: Advanced Cryptography + P2P Network Design
Bitcoin integrates multiple cutting-edge technologies:
●ECDSA (Elliptic Curve Digital Signature Algorithm): Ensures account security and private key signatures.
●SHA-256 Hash Algorithm: Guarantees data immutability.
●Merkle Tree Structure: Enables efficient verification of transactions within a block.
●Peer-to-Peer Network (P2P): Facilitates global value transfers without intermediaries.
These technologies make Bitcoin a robust and unforgeable value transmission network, with infinite scalability potential — laying the groundwork for second-layer expansions like the Lightning Network and future applications. Bitcoin is not only an asset but also a masterpiece of cryptographic engineering. Future quantum-resistance updates are also worth watching.
5. A Challenger to the Global Financial Order: A Non-Sovereign Asset Amidst Dollar Transition
The world is witnessing a wave of de-dollarization, with international settlements shifting toward local currencies, gold, and decentralized assets. With its non-sovereign neutrality, global accessibility, and scarcity, Bitcoin has become a crucial channel for capital transfer and value storage, especially in emerging markets and unstable regions. It offers an alternative financial model coexisting with — yet independent from — the dollar and gold: a neutral system of consensus-based currency. In times when national creditworthiness is questioned, reliance on algorithmic credibility could become a strategic moat. Of course, this will require further regulatory oversight to prevent illegal activities.
6. A Potential Financial Infrastructure for Interplanetary Civilizations (Speculative Idea)
Bitcoin is the only current value protocol not reliant on any country, bank, or internet entity. Its ledger can exist across planetary nodes — as long as electricity and computing power are available, the network can be maintained. This structure makes it naturally suitable for future space exploration scenarios, such as on Mars or the Moon, where fast and direct usage would be advantageous. While human space exploration is still in its infancy, with no major breakthroughs in stable planetary settlement, this idea remains speculative. However, from a 30–50 year perspective, initial interplanetary applications may not be entirely implausible. Bitcoin (or credit-like tokens) could serve as the base-layer token of human digital civilization.
Summary: BTC's Scientific Foundation
●Supply Ceiling (Scarcity) + Consensus Strength (Decentralization)
●Real-World Context: Weakening trust in fiat currency and expanding debt bubbles
●In the face of future uncertainty, Bitcoin's "anchor-like properties" become increasingly prominent.
4. Summary of BTC’s Long-Term Value Trends
Through the analysis of Bitcoin's halving cycles and scientific fundamentals, the following conclusions can be drawn:
Bitcoin’s four halving cycles to date have demonstrated a consistent market rhythm: price rises in anticipation before each halving, followed by short-term consolidation, then a major rally. Post-2024 halving, Bitcoin’s annual inflation rate has dropped to 0.78% — lower than gold for the first time — reinforcing its role as a scarce asset.
Against the backdrop of persistent global fiat inflation, expanding credit, and growing fiscal deficits, Bitcoin’s deflationary model and decentralized structure are attracting increasing attention and allocation from traditional capital.
Although short-term volatility remains and black swan events cannot be ruled out, Bitcoin's long-term value logic is becoming clearer: it is not just a cryptocurrency, but a new type of asset based on cryptographic trust and decentralized consensus. In future cycles, Bitcoin's value potential, inflation-hedging ability, technical uniqueness, and expanding ecosystem will continue to empower it, building the essential value moat of a true “digital gold”.
Disclaimer on Perspectives:
Some people dismiss Bitcoin due to market speculation or scam-like projects. However, equating it entirely with such phenomena is an unobjective approach. Projects that rely solely on hype — such as many memecoins — tend to lack sustainability.
Risk Warning:
This article serves only as educational research and does not constitute investment advice. Readers are encouraged to conduct their own research and make independent judgments. Never blindly follow anyone — DYOR (Do Your Own Research). BINANCE:BTCUSD COINBASE:ETHUSD

Bitcoin: Blood in the Streets – Now is the Time!Once again, there’s blood in the streets—and from this point on I start scaling into spot positions again, slowly but deliberately.
All of these are spot entries with soft stop-losses—not hard exits, but areas I’ll react to if needed.
So why now? For one, we’re sitting right above the 38,2% Fibonacci level for the ending of the wave A. At the same time, we’re about to tap into a daily Fair Value Gap, while trying to hold the range support—two important technical levels lining up on the higher time frame.
Below that, we have an untapped VWAP at $65.5K, which could act as a magnet, as it often does. And yeah—if we go under $62K or even $60K, the classic “time to work at McDonald’s” joke comes back. But seriously: in markets like this, you need to stay calm, have some humor, and most of all, know what’s possible.
So I’m cautiously watching the S&P 500 closely, which plays a big role in this setup for me.
That’s where I stand on BTC right now—careful optimism, grounded in context and reasoning for me.

BTC OutlookPotential Move Toward 140K in the Long-Term Channel Expansion
BTC is currently trading inside an expanding ascending channel.
From my perspective, price is currently pushing toward a new local high, and there’s a strong probability we see continuation toward the 140K region in the mid-to-long term – assuming no major shift in macro or market sentiment.
Note: This is not financial advice. Always manage your risk and trade based on your own strategy.

BTC Overextended: Awaiting the Perfect Pullback for a BuYBTC/USDT Analysis – 1D Timeframe
Bitcoin is currently looking overextended on the daily chart 📈, with price action pushing directly into a well-defined key resistance level 🚧. This area has historically acted as a strong supply zone, and with momentum appearing stretched, I’m anticipating a potential retracement in the near term.
My plan is to wait for BTC to pull back towards previous support zones Around the 61.8 Fibo level🛡️. I have a clear Point of Interest (POI) marked out, where I’ll be watching for price to react. If we see a bullish Break of Structure (BOS) on the pullback—I’ll be looking for a long entry from this area 🎯.
Key Levels to Watch:
Resistance: Current daily highs (where price is overextended) 🚩
Support/POI: Previous consolidation and demand zones below, which have shown strong buying interest in the past 🏦
Trade Plan:
- No FOMO entries at resistance! ❌
- Wait for a clean retrace into my POI
- Look for bullish confirmation (BOS) on lower timeframes before entering long ✅
- Manage risk accordingly and trail stops if the move plays out
Summary:
Patience is key here. I’m not interested in chasing price into resistance. Instead, I’ll let the market come to me and only act if my criteria are met. If BTC gives us the pullback and a bullish BoS, I’ll be ready to take the trade. Until then, I’m on the sidelines and monitoring price action closely 👀.
Disclaimer:
This analysis is for educational purposes only and does not constitute financial advice. Always do your own research and manage your risk appropriately. Trading cryptocurrencies involves significant risk and may not be suitable for all investors. 🚨

Bitcoin 4H Technical Analysis– Bullish Continuation Toward $111KCurrent Price Context:
BTC/USD: $103,696.63
EMA (70): $96,211.07
Trend: Bullish 📈
---
Key Zones & Analysis:
1. RBR Zone (Demand Zone) 💙
Price Range: $95,435.39 – $97,986.81
This area is a bullish support zone where price previously consolidated before the breakout.
Potential entry/buy zone 📍
If price pulls back: Bounce expected here 🔁
🟦 RBR Zone:
🔵 97,986.81
🔵 96,211.07 (EMA support)
🔵 95,435.39
---
2. Resistance / Short-Term Supply 🟥
Small blue box above current price
May cause a minor rejection before a breakout
Keep an eye out for price action signals here 👀
🟥 Resistance:
🟥 ~103,700 – 105,000
---
3. Target Zone 🎯
Main Target Point: $111,415.32
Target Range: $111,281.04 – $112,959.60
If price breaks above resistance, this is the next major target
Take profit zone 💰
🎯 Target Area:
🔵 111,281.04
🔵 111,415.32
🔵 112,959.60
---
Possible Price Path:
1. 🔼 Break above current resistance
2. 🔁 Or pull back to RBR zone
3. 🎯 Final move toward target zone

$BTC Daily Update - Back above $100KCRYPTOCAP:BTC : Well, Hello! $100K!!!😍
$102,280 support in effect currently, $103,093 resistance testing, current 1W candle looking mighty bullish, RSI looking good on 1D and 4H, $104,987 next key resistance, $99,361 current key support.

Bitcoin Breaks Trendline-Is $109k Next?Technical Analysis: Ascending Channel Pattern
The asset is exhibiting an ascending channel pattern, indicative of sustained bullish momentum. Key observations include:
- Channel Boundaries: The price has consistently respected the channel's upper and lower boundaries, forming higher highs and higher lows.
- Breakout and Retest: Following a strong momentum breakout, the price is potentially retesting a key support level, previously acting as resistance.
- Support Zone: If buyers confirm support at this level, it may signal a continuation of the uptrend, targeting the upper boundary of the channel at $109,000.
Key Monitoring Points:
- Bullish Confirmation Signals: Look for bullish engulfing candles, strong wicks rejecting the support zone, or increased buying volume to confirm long positions.
- Risk Management: Failure to hold support could signal a bearish shift, emphasizing the importance of monitoring price action and adjusting strategies accordingly.

$BTC, Bitcoin update: what is going on?🚨 Bitcoin Update: We've just seen a decent correction on CRYPTOCAP:BTC followed by a strong pump.
I’ve warned about this already — this pump is not organic. It's largely driven by institutions and Michael Saylor, using leverage.
📉 A healthy price movement should look like a staircase: move up, consolidate, reset the daily MACD, then push higher again.
Each rally should be followed by a slight pullback — that’s how sustainable trends are built.
❌ But this natural cycle is being disrupted.
Saylor and ETFs keep buying the top to prevent corrections. Some laugh and call it incompetence, but I believe it’s strategic.
These players don’t care about making money on trades.
Their goal is to inflate the value of their companies (or stock value), which are now heavily tied to Bitcoin’s price.
That’s why they don’t want BTC to consolidate.
Every time there's weakness, they step in to buy, preventing any pullback and forcing the price through resistances and fair value gaps.
🤖 The problem? Bots — which represent +80%+ of the trading volume — are not wired this way.
They sell when BTC is overbought and buy when it's oversold.
But with institutions disrupting this cycle, exchanges end up selling BTC, and whales scoop it up — leading to lower supply on exchanges.
Exchanges then have to buy BTC back at higher prices, sometimes even at a loss — often by printing billions in Tether (USDT) to compensate.
🎈 This entire mechanism is inflating Bitcoin’s price, exactly what Bitcoin maximalists want.
But it also kills the chance for an altseason, which usually comes after Bitcoin tops out.
📊 So what’s next?
Ideally, we get a consolidation to around $91K to avoid a major bearish divergence.
If BTC breaks below $90K, we could see GETTEX:82K — but given current conditions, that’s unlikely.
On the chart, RSI is high on daioly, Williams indicator is turning bearish and MACD too. These are all signs of a most needed consolidation. But as I explained, this is cancelled at the moment.
💰 Can institutions push BTC to a new all-time high?
Yes — they basically have unlimited capital and the money printer will turn back on by September.
But once again, altseason is postponed.
#Bitcoin #BTC #CryptoMarkets #MichaelSaylor #ETF #BTCAnalysis #Altseason #CryptoPump #MarketManipulation #BTCUpdate #Tether #CryptoWhales #DailyMACD #TechnicalAnalysis #CryptoInsights #Web3

SPY/QQQ Plan Your Trade for 5-9 : Inside-Breakaway PatternI will be unavailable tomorrow morning to do my normal Plan Your Trade video at 5am. So, I'm delivering this video for all of you tonight to assist you with the SPY cycle pattern tomorrow.
As soon as I get my brother settled in for his surgery, I'll find a Starbucks and settle in to check on the markets.
This is a short video - so please understand the context of the markets may depend on what happens overnight.
Get some.
#trading #research #investing #tradingalgos #tradingsignals #cycles #fibonacci #elliotwave #modelingsystems #stocks #bitcoin #btcusd #cryptos #spy #gold #nq #investing #trading #spytrading #spymarket #tradingmarket #stockmarket #silver

“+$25K Profit & Still Long – Don’t Chase, Trade Smart”Since the drop to 74K, we've seen an incredibly fast and powerful rally over the past month—and I’m currently sitting on a realized profit of over $25,000 during this move.
One of the most bullish signals in this entire structure is that since the reversal in April, we’ve never seen a proper correction or trend-reversing retracement. As I mentioned in previous updates, this shows exceptional strength and suggests the uptrend remains firmly intact.
In fact, we’re climbing without breaking any key lows—what I like to call a “step-by-step” grind upward. On higher time frames, these look like strong bullish candles, meaning more buyers than sellers, and aggressive market orders pushing price higher. That’s a characteristic of strong trends—remember that.
Now, with the historical ATH at $109,000 getting closer, I do not expect an immediate breakout to new highs. Instead, we might see a healthy consolidation—either price-wise or time-wise—around this major supply zone. This is not the time to FOMO in.
The recent surge was fueled by comments from President Trump, and that breakout candle was significant. But sharp moves often bring sharp corrections. If price pulls back to the 96–95K zone and finds support, that could be the base for a new push toward all-time highs.
If you’re not in a position right now:
🚫 Do NOT rush into the market.
We are at a spot where both a breakout and a reversal are possible. Whether you’re using the lower or higher time frame, wait for clear confirmation—a pullback, a base, a proper setup.
Look to long only after strong support is confirmed, or short if price keeps failing to break highs. Either way, keep a tight stop and let your winners run—there’s still opportunity here, but only with proper risk-reward.
I’ll say it again because it’s important:
If you missed this long, it’s okay.
The market will correct—whether sharply or slowly—and your edge is not in chasing, but in being ready. Don’t let impulsive trades erase your capital or your confidence.
Oh, and by the way—I’m still holding my long position.

Bitcoin Short Setup | 30m SMC OB Rejection + Clean RR💣 Bitcoin (BTCUSD) 30-Min SMC Short | May 9, 2025
We just caught BTC’s premium tap into a 30m bearish Order Block, followed by a strong rejection candle. This is a classic Smart Money play, where price fills inefficiency and instantly rejects the institutional footprint.
🔍 KEY CONFLUENCES:
📦 Bearish Order Block tapped at $101,752
📈 Strong bullish impulse followed by hard rejection
🎯 Short from premium into discount zone (~$99,114 target)
🔺 Clean Risk-to-Reward: ~1:5+
💰 High-probability Smart Money setup
📊 Setup Specs:
Timeframe: 30min
Direction: Short
Entry Zone: $101,752
TP: $99,114
SL: ~$102,000
RR: Approx. 1:5+
💡 Trade Logic:
Price made a liquidity grab + FVG fill before tapping a 30min Order Block. The sharp red engulfing candle at the top confirms SMC presence and intention to sell-off. This zone represents premium pricing, ideal for institutional distribution.
🎯 Chart Ninja Note:
“Smart Money never chases price… they wait for the retest where the fear begins.”

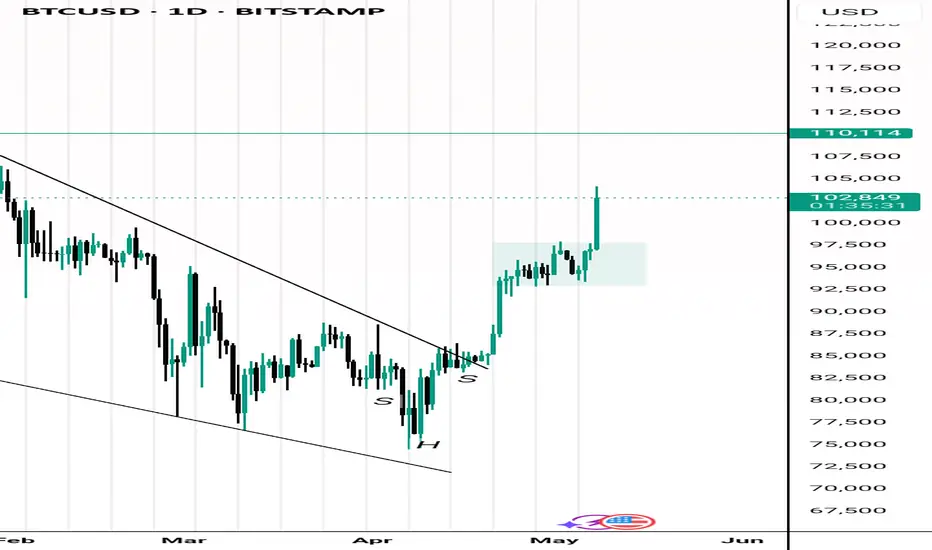
Whether it can be supported and rise at 102429.56 is the key
Hello, traders.
If you "Follow", you can always get new information quickly.
Please also click "Boost".
Have a nice day today.
-------------------------------------
(USDT.D 1M chart)
If USDT dominance is maintained below 4.97 or continues to decline, the coin market is likely to enter an upward trend.
(BTC.D 1M chart)
However, I think that for the altcoin bull market to begin, BTC dominance must be maintained below 55.01 or continue to decline.
If USDT dominance falls and BTC dominance rises, most altcoins are likely to gradually move sideways or show a downward trend.
In other words, it is highly likely that only BTC will continue to rise.
-----------------------------------------
(BTCUSDT 1M chart)
Based on the current position, in order to continue the uptrend, the price must be maintained above the Fibonacci ratio of 1.902 (101784.54).
If not, it is likely to fall to around the Fibonacci ratio of 1.618 (89050.0).
If the uptrend continues, the point to watch is whether it can renew the new high (ATH) this time.
-
(1W chart)
It is rising after touching the 73499.86 area.
It is showing a large increase as it breaks through the HA-High indicator point of 97226.92 on the 1W chart.
Since the StochRSI indicator is expected to enter the overbought zone, it is highly likely that the future rise will be limited.
Therefore, the key is whether the price can be maintained above the left Fibonacci ratio of 1.902 (101784.54).
If it falls, you should check whether it is supported near 97226.92.
If it falls below 97226.92, you should check whether it is supported in the 1st and 2nd sections marked on the chart.
You should check where the StochRSI 80 indicator is formed when the next candle is created.
The StochRSI 80 indicator on the 1M chart is formed at the 102429.56 point.
Therefore, we need to check whether the StochRSI 80 indicator point on the 1W chart is formed around the 102429.56 point.
-
(1D chart)
Since the StochRSI indicator on the 1D chart is located below the midpoint, we need to focus on finding a buying point.
With this rise, the StochRSI indicator is expected to rise above the midpoint.
If the StochRSI indicator is located above the midpoint, we need to focus on finding a selling point.
Therefore, the point of interest is whether the price can be maintained around the right Fibonacci ratio 1.902 (101784.54) as we pass through the next volatility period around May 19.
-
Among the interpretation methods of the OBV indicator, there is an interpretation method that there is a possibility of an increase or decrease when the previous high or low is broken.
This time, it showed an upward break through the upper line of the OBV and broke through the lower line of the previous OBV.
In other words, it showed an upward break through the A section.
If this upward break through the B section is continued, it is expected to renew the ATH.
-
Thank you for reading to the end.
I hope you have a successful transaction.
--------------------------------------------------
- This is an explanation of the big picture.
I used TradingView's INDEX chart to check the entire section of BTC.
I rewrote the previous chart to update it by touching the Fibonacci ratio section of 1.902 (101875.70) ~ 2 (106275.10).
(Previous BTCUSD 12M chart)
Looking at the big picture, it seems to have been following a pattern since 2015.
In other words, it is a pattern that maintains a 3-year bull market and faces a 1-year bear market.
Accordingly, the bull market is expected to continue until 2025.
-
(Current BTCUSD 12M chart)
Based on the currently written Fibonacci ratio, it is displayed up to 3.618 (178910.15).
It is expected that it will not fall again below the Fibonacci ratio of 0.618 (44234.54).
(BTCUSDT 12M chart)
I think it is around 42283.58 when looking at the BTCUSDT chart.
-
I will explain it again with the BTCUSD chart.
The Fibonacci ratio ranges marked in the light green boxes, 1.902 (101875.70) ~ 2 (106275.10) and 3 (151166.97) ~ 3.14 (157451.83), are expected to be important support and resistance ranges.
In other words, it seems likely to act as a volume profile range.
Therefore, in order to break through this section upward, I think the point to watch is whether it can rise with support near the Fibonacci ratios of 1.618 (89126.41) and 2.618 (134018.28).
Therefore, the maximum rising section in 2025 is expected to be the 3 (151166.97) ~ 3.14 (157451.83) section.
To do that, we need to look at whether it can rise with support near 2.618 (134018.28).
If it falls after the bull market in 2025, we don't know how far it will fall, but considering the previous decline, we expect it to fall by about -60% to -70%.
So, if the decline starts near the Fibonacci ratio 3.14 (157451.83), it seems likely that it will fall to around Fibonacci 0.618 (44234.54).
I will explain more details when the downtrend starts.
------------------------------------------------------

SPY/QQQ Plan Your Trade Update : Finding Confirmation & MoreThis video will become the start of more advanced training videos to help all of you understand how to use your own skills/tools/resources to try to find the best opportunities.
As I state in the video, I will never tell you what to trade. EVER!
It is unethical and illegal. I'm not a broker or financial advisor.
I'm a software developer/trader and I like to try to unlock the secrets of the markets using price action and inference models (and more).
This video teaches you how to use my CRASH INDEX and the SuperTrend indicator as a way to develop better allocation and risk protection skills for your own trading.
Let's face it - trading is about developing a process to consistently GET PROFITS. It doesn't really matter if they are 10%, 20%, 30% or more. If you are able to consistently execute good trades and PULL PROFITS - you will grow your account- right?
So stop swinging for the fences. Learn to develop skills that keep you on the right side of these big trends.
It's not that hard.
In this video I try to teach you to use Daily, Weekly, 240 min, 120 min, 60 min, 10 min, and 5 min data using my Crash Index to help you learn to trade the SPY/QQQ.
The Crash Index is suited for the SPY/QQQ in most cases. There are instances where the Crash Index may reflect some type of counter-trend - so remember to use Fibonacci Price Theory on the underlying symbol (SPY or QQQ) as final confirmation.
And, remember to try to understand primary trending (longer-term trending) vs. short-term trending. If you are going to try to trade a "counter-trend" swing - cut your trade allocation down by 50-60% (or more). Counter-trend swings are usually going against the major/primary trend.
Anyway, watch this video once or twice. I hope it helps all of you understand and build your own skills to trade more efficiently.
The trick is to get it down to a process where you know how to allocate your capital and you know how to confirm/invalidate trade setups/triggers.
Once you get to that point - you turn into a trading machine. The only step of the process that is really difficult to handle/manage is the BOOK IT phase. If you book your profits early - you may feel bad about leaving profits out there you could have had. But, a PROFIT is a PROFIT.
And the goal of trading it to PROFIT more than you LOSE - right?
Get some.
#trading #research #investing #tradingalgos #tradingsignals #cycles #fibonacci #elliotwave #modelingsystems #stocks #bitcoin #btcusd #cryptos #spy #gold #nq #investing #trading #spytrading #spymarket #tradingmarket #stockmarket #silver

Ether-Bitcoin Ratio Signals ETH Is 'Extremely Undervalued,' The cryptocurrency market is a realm of intricate signals, complex metrics, and often-conflicting narratives. Among the myriad indicators traders and investors scrutinize, the Ether-Bitcoin (ETH/BTC) ratio holds a prominent place. This metric, a simple division of Ethereum’s price by Bitcoin’s price, serves as a barometer for the relative strength and market sentiment between the two leading crypto assets. Recently, this ratio has dipped to levels that historically signaled significant undervaluation for Ether, sparking debate about a potential upcoming rally. However, a confluence of factors – notably surging ETH supply, stagnant network demand, and a weakened token burn mechanism – casts a considerable shadow over this optimistic outlook, suggesting that past performance may not be a reliable guide in the current, uniquely challenging environment.
Understanding the ETH/BTC Ratio: A Barometer of Relative Strength
At its core, the ETH/BTC ratio reflects the market's perception of Ethereum's value proposition relative to Bitcoin. When the ratio trends upwards, it indicates that ETH is outperforming BTC, suggesting growing investor confidence in Ethereum's ecosystem, technological advancements, or utility. Conversely, a declining ratio signifies BTC's relative strength, potentially due to factors like "digital gold" narratives, safe-haven appeal, or specific Bitcoin-centric catalysts.
A low ETH/BTC ratio, such as those observed in recent times, is often interpreted by analysts as a sign that ETH is "cheap" or "undervalued" compared to Bitcoin. The logic is that, over time, capital flows within the crypto market tend to seek out assets with stronger growth potential or those perceived as lagging behind their fundamental value. If ETH is indeed undervalued, the expectation is that it will eventually catch up, leading to a rally in both its USD price and its value relative to BTC. This potential for "mean reversion" or a "catch-up trade" is what excites many market participants when the ratio hits historical lows.
Historical Precedents: When Undervaluation Sparked Rallies
The argument for an impending ETH rally based on the current low ETH/BTC ratio is not without historical merit. There have been several instances where a depressed ratio preceded substantial upward movements for Ether.
1. Post-2018 Crypto Winter: After the ICO boom and subsequent crash, the ETH/BTC ratio languished for an extended period. However, as the DeFi (Decentralized Finance) ecosystem began to gain traction in 2020 ("DeFi Summer"), ETH, as the foundational layer for most DeFi protocols, experienced a resurgence. The ratio climbed significantly as capital flowed into Ethereum to participate in yield farming, lending, and decentralized exchange activities.
2. The NFT Boom (2021): The explosion of Non-Fungible Tokens (NFTs) in early 2021, predominantly on the Ethereum blockchain, provided another major catalyst. The increased demand for ETH to mint, buy, and sell NFTs pushed its price and the ETH/BTC ratio upwards, as Ethereum's utility as a platform for digital collectibles and art became undeniable.
3. Anticipation of The Merge (2021-2022): As Ethereum moved closer to its pivotal transition from Proof-of-Work (PoW) to Proof-of-Stake (PoS) – "The Merge" – market sentiment turned increasingly bullish. The promise of significantly reduced energy consumption, coupled with the "ultrasound money" narrative (where ETH issuance would drastically decrease and potentially become deflationary due to EIP-1559's burn mechanism), fueled strong buying pressure. The ETH/BTC ratio saw notable gains during periods of heightened Merge anticipation.
In these instances, the low ETH/BTC ratio acted as a tinderbox, and specific fundamental catalysts served as the spark that ignited significant rallies. Investors who recognized the undervaluation signal and anticipated these catalysts were handsomely rewarded. This historical pattern underpins the current optimism among some analysts who see the present low ratio as a similar buying opportunity.
The Complicating Factors: Why This Time Might Be Different
Despite the compelling historical precedents, the current market environment for Ethereum presents a unique set of challenges that complicate the simple "undervalued, therefore rally" thesis. These headwinds stem from fundamental shifts in Ethereum's tokenomics and network dynamics.
1. Surging Supply: The Post-Merge Issuance Reality
While The Merge successfully transitioned Ethereum to a more environmentally friendly PoS consensus mechanism, its impact on ETH supply has been more nuanced than initially portrayed by some bullish narratives.
• Staking Rewards: Under PoS, new ETH is issued as rewards to validators who stake their ETH to secure the network. While the rate of new ETH issuance is significantly lower than it was under PoW, it is still a consistent inflationary pressure. The annual inflation rate from staking rewards is currently in the low single digits.
• Net Issuance vs. Deflation: The "ultrasound money" thesis largely depended on the EIP-1559 burn mechanism (discussed later) consistently burning more ETH than is issued through staking rewards, leading to a net deflationary supply. However, this has not always been the case post-Merge. There have been extended periods where ETH has been net inflationary.
• Unstaking and Liquid Staking Derivatives: The ability for validators to unstake their ETH (enabled by the Shanghai/Capella upgrade) means that previously locked supply can re-enter the market. Furthermore, the proliferation of Liquid Staking Derivatives (LSDs) like Lido's stETH or Rocket Pool's rETH, while enhancing capital efficiency, also means that staked ETH is not entirely removed from liquid circulation, as these derivative tokens can be traded or used in DeFi.
This consistent, albeit reduced, issuance contributes to sell pressure, especially if demand does not keep pace. The narrative of ETH becoming a deflationary asset has been weakened, impacting one of the key bullish arguments that previously supported a higher ETH/BTC ratio.
2. Flat Demand: A Stagnant Network Picture
For ETH's price to appreciate significantly, there needs to be robust demand for the token, driven by network usage and adoption. Currently, several indicators suggest that demand is, at best, flat, and in some areas, declining.
• Network Activity Metrics: Key on-chain metrics such as daily active addresses, transaction counts, and total gas consumed have shown periods of stagnation or even decline. While Layer 2 scaling solutions are processing more transactions, this activity doesn't always translate directly into proportional demand for ETH on the mainnet, especially if Layer 2s manage their own fee markets efficiently.
• Total Value Locked (TVL) in DeFi: While DeFi remains a cornerstone of Ethereum's value proposition, the growth in TVL has slowed considerably compared to the explosive growth seen in 2020-2021. Capital inflows into DeFi protocols on Ethereum have been less aggressive, partly due to macroeconomic conditions, regulatory concerns, and the emergence of competitive DeFi ecosystems on other blockchains.
• Competition from Alternative Layer 1s and Layer 2s: Ethereum faces increasing competition from other Layer 1 blockchains (e.g., Solana, Avalanche, Aptos, Sui) that offer higher throughput and lower transaction fees, attracting users and developers. Moreover, Ethereum's own Layer 2 ecosystem (e.g., Arbitrum, Optimism, Polygon zkEVM, Starknet, zkSync Era), while crucial for its long-term scalability, also fragments user activity and can, in some ways, reduce direct demand pressure on ETH for L1 transactions if users primarily operate within these L2 environments.
• Macroeconomic Headwinds & Regulatory Uncertainty: Broader economic conditions, including inflation, interest rate hikes, and recession fears, have generally dampened risk appetite across financial markets, including crypto. Additionally, the ongoing regulatory uncertainty in key jurisdictions like the United States creates an environment of caution, potentially hindering institutional adoption and large-scale investment in assets like ETH.
• NFT Market Cool-Down: The NFT market, which was a significant driver of ETH demand, has experienced a substantial cool-down from its peak in 2021-2022. While innovation continues, transaction volumes and average sale prices have fallen, reducing the ETH velocity associated with this sector.
Without a significant uptick in genuine network demand – more users transacting, more capital flowing into DeFi, a resurgence in NFT activity, or new killer dApps emerging – it becomes harder for ETH to absorb the ongoing supply issuance and stage a sustainable rally.
3. Weakened Burn Mechanics: The Diminished Impact of EIP-1559
EIP-1559, implemented in August 2021, was a landmark upgrade for Ethereum. It introduced a mechanism where a portion of every transaction fee (the "base fee") is burned, permanently removing that ETH from circulation. This was a key pillar of the "ultrasound money" narrative, as it created a deflationary pressure that could, under conditions of high network demand, outpace new ETH issuance.
However, the effectiveness of this burn mechanism is directly tied to network congestion and the level of the base fee.
• Lower Network Congestion: In periods of lower network activity and congestion (as has been observed more frequently recently), the base fee required to get transactions included in a block decreases. A lower base fee means less ETH is burned per transaction.
• Impact of Layer 2s: As more transaction activity shifts to Layer 2 scaling solutions, which have their own, typically much lower, fee structures, the demand for block space on Ethereum Layer 1 can decrease. While L2s do periodically batch transactions and settle them on L1 (consuming L1 gas and contributing to the burn), the overall L1 gas consumption directly attributable to individual user transactions might be lower than if all those transactions occurred on L1.
• Periods of Low Burn: Consequently, there have been extended periods post-Merge where the amount of ETH burned via EIP-1559 has been insufficient to offset the ETH issued as staking rewards. During these times, ETH's supply becomes net inflationary, undermining the deflationary narrative that was a strong catalyst in previous cycles.
While EIP-1559 remains a crucial and beneficial upgrade for Ethereum's fee market predictability, its power as a consistent deflationary force has been tempered by the current realities of network demand and the evolving Layer 2 landscape.
Synthesizing the Outlook: A Tug-of-War
The current situation for Ethereum is a complex tug-of-war. On one side, the historically low ETH/BTC ratio flashes a compelling "undervaluation" signal, suggesting a potential for significant upside based on past market behavior. This attracts traders looking for relative value plays and those who believe in Ethereum's long-term fundamental strengths.
On the other side, the fundamental picture is clouded by persistent, albeit reduced, supply issuance, a lack of explosive growth in network demand, and a burn mechanism whose deflationary impact is currently muted. These factors create genuine headwinds that could prevent ETH from easily replicating its past ratio-driven rallies.
For ETH to truly capitalize on its apparent undervaluation relative to Bitcoin, several things likely need to occur:
1. A Resurgence in Demand: This could come from a new "killer app" or narrative on Ethereum, a significant rebound in DeFi or NFT activity, increased institutional adoption (perhaps spurred by clearer regulation or new investment products like spot ETH ETFs in more jurisdictions), or a general improvement in macroeconomic conditions that boosts risk appetite.
2. Successful Maturation and Value Accrual from Layer 2s: As Layer 2 solutions mature and gain wider adoption, their success needs to translate into tangible value accrual for ETH itself. This could happen through increased L1 settlement demand, the use of ETH as a primary gas token on L2s, or innovative mechanisms that tie L2 economic activity back to the L1 token. EIP-4844 ("Proto-Danksharding") is a step in this direction by aiming to reduce L2 transaction costs, potentially fostering more L2 activity and, consequently, more L1 settlement.
3. A Shift in Broader Market Sentiment: Often, major altcoin rallies, including for ETH, occur after Bitcoin has established a strong uptrend and market sentiment becomes broadly bullish. A sustained Bitcoin rally could create a "wealth effect" and encourage capital to rotate into ETH and other altcoins.
Conclusion: Caution Warranted Despite Undervaluation Signals
While the ETH/BTC ratio strongly suggests that Ether is trading at a significant discount compared to Bitcoin, historical precedent alone may not be enough to guarantee a rally in the current market. The fundamental challenges posed by ongoing supply, relatively flat demand, and a less potent burn mechanism are significant and cannot be ignored.
Investors and traders eyeing ETH must weigh the allure of its apparent undervaluation against these tangible headwinds. A potential ETH rally is likely contingent not just on the ratio mean-reverting, but on a demonstrable improvement in Ethereum's core demand drivers and a favorable shift in the broader market environment. The "extremely undervalued" signal is a call for attention, but thorough due diligence and a clear understanding of the current complexities are more crucial than ever. Ethereum's long-term vision remains ambitious, but its path to reclaiming relative market dominance against Bitcoin in the near term appears more challenging than in previous cycles.

Beyond The Plan Your Trade Videos - Trading Algos/ConfirmationMany of you follow my morning Plan Your Trade videos - and I thank you for your loyalty and dedication.
The Plan Your Trade videos are specifically deigned to highlight my SPY/GOLD Cycle Patterns and, over the course of the past 9+ months, I've started trying to teach all of you Fibonacci Price Theory and the concept of the Excess Phase Peak pattern (and Cradle Pattern).
My goal is to teach you to learn to understand price structures, setups, and actions as a way to try to advance your technical analysis/trading skills.
There are so many others out there trying to teach you to use indicators and other types of analysis to try to identify trading opportunities/setups. Some work, some don't.
Technical analysis using Indicators, Elliot Wave, or other forms of predictive analysis/AI are only about 50-75% accurate at best (IMO). Nothing is 100% perfect.
After 35+ years of trying to unlock the secrets of price action to devise a 100% accurate trading system, the closest I have come is a system that generates about 65-75% accuracy - but still manages to take some losses.
I do believe I can find that 100% accurate system (hopefully before I die). But the reality is it is almost impossible to accurately predict price movement 10-20+ days in advance with any degree of accuracy.
Over the past few weeks/months, we've seen the SPY/QQQ move through various stages/phases.
Over the past 4+ weeks I've been warning of the broad-consolidation phase that is currently setup on the SPY/QQQ. I believe this huge consolidation range is very dangerous for traders and that extreme volatility will create lots of risk/opportunities for those capable of trading within this range.
But, at the same time, failing to take advantage of tools to help traders hedge, daytrade, or otherwise balance allocation/risk levels is something I really don't talk about much.
I like to say "I do the research - you make all the trading decisions".
This video highlights some of my advanced algos and how I use them, in conjunction with the EPP and other patterns, to try to gauge market opportunities vs. risks.
Trust me. I've learned not to GO BIG on trades over the past 20+ years because I've blown up a few accounts trying to get greedy.
Right now, I focus on trying to be on the right side of trends (if possible) and to balance my portfolio in 10-20% increments.
For example, if I believe GOLD is going to move higher, I may start out with a 5-10% allocation into GLD or UGL (start small). If that trade works and Gold starts to make a move higher, I may try to add a bit more to that initial trade. If it doesn't work out, I may try to add a little bit more at a better entry price level - but I focus on not letting that trade occupy more than 15-20% of my total portfolio.
That way, if I take a loss on the trade, it is a small loss compared to the overall account capital.
If I take a 50% loss on a 20% allocation - that is only a 10% loss on the TOTAL ACCOUNT SIZE.
Get it?
So, the reason for this video is to show you how you can still use technical strategies/indicators to try to confirm you intraday trading and swing trading opportunities. I like to use the SuperTrend strategy on charts to identify general trending.
I'm urging you to consider my Plan Your Trade videos as "one component" of your skillset. You need to use your own skills/techniques/analysis to try to manage risks vs. opportunities as you continue to trade.
I highlight some of my algos because they become another "component" of my analysis when I'm trading. If I don't see broad market capitulation related to Daily trending - then I try to stay VERY CAUTIOUS. If I do see some capitulation within my algos suggesting the markets are starting to trend upward or downward, then I may try to take advantage of that opportunity.
Ideally, the process of trading is to use everything you like and can rely on to help confirm you decision-making. Then, fall back to a efficient trade allocation process that attempts to limit your risk level.
The biggest mistake I see people make is to go ALL IN or TOO HEAVY into a trade thinking they can't lose. Yes, you can lose. So can I.
That's why it is important to contain risks and protect capital at all times.
I'll try to create another video showing you how I use the SuperTrend indicator to help confirm some of my intraday analysis for trades.
Get Some.
#trading #research #investing #tradingalgos #tradingsignals #cycles #fibonacci #elliotwave #modelingsystems #stocks #bitcoin #btcusd #cryptos #spy #gold #nq #investing #trading #spytrading #spymarket #tradingmarket #stockmarket #silver

SPY/QQQ Plan Your Trade For 5-8 : EPP & Cradle Pattern UpdateThis video highlights why I continue to stay very cautious of this upward price move in the US markets.
It also highlights that the current trend is BULLISH - not BEARISH. When I post the videos in the morning, I've been selecting BEARISH as the general trend because I believe the markets are going to roll over into a breakdown phase. Until that happens, though, the markets are in a BULLISH price trend - attempting to possibly break above the current Ultimate High.
This is more of an instructional video - trying to show you why I continue to urge caution related to trends and why I belive we may have many months to go before the US markets really start to make a bigger "exit trend" type of move (exiting this broad consolidation range).
The other thing this video should teach you is how to identify EPP and Cradle patterns more efficiently and how to use them.
Ultimately, everything I share with all of you is designed to help you understand price as the ultimate indicator.
If you can grasp these concepts and understand how each phase of price structure presents opportunities, then you should be able to time and execute your trades very efficiently.
As I've stated in the videos, because of family medical issues over the past 60+ days, I've moved away from daytrading and gone back to a 2-5+ week swing trading style.
Simply put, I'm driving all over the place taking care of my family, seeing doctors, and other stuff - so I can't stare at my PC/Phone while the markets are open.
I'm also taking very low risk trades. If I decide to get into a trade, I'm usually avoiding the SPY/QQQ and selecting some SPDR sector (or other ETF) that allows me to play the move I expect without risking a fortune doing it.
Anyway, I hope you enjoy this video. I'll probably create one more after this video posts.
Get some.
#trading #research #investing #tradingalgos #tradingsignals #cycles #fibonacci #elliotwave #modelingsystems #stocks #bitcoin #btcusd #cryptos #spy #gold #nq #investing #trading #spytrading #spymarket #tradingmarket #stockmarket #silver

Bitcoin Hits $100K: Bull Run IgnitesWhat Tariff Shock? Bitcoin Surges Past $100K as Market Recovery Continues
The cryptocurrency market has been making headlines again as Bitcoin (BTC) surges past the $100,000 mark, signaling a robust recovery and potentially the start of a new bull cycle. In an environment marked by economic uncertainty, geopolitical tensions, and fluctuating central bank policies, Bitcoin’s remarkable resurgence has captured the attention of retail investors, institutional participants, and financial analysts alike.
This article delves into multiple facets of Bitcoin’s ongoing rally, including its recent rebound after a sharp drop, the role of whales in fueling the push toward $100K, the realized cap hitting a record high, and whether aggressive profit-taking by investors signifies a local top. Additionally, we’ll explore the implications of Bitcoin's return to $100K and why it hints at a "significant price move" that could shape the broader financial landscape.
________________________________________
Bitcoin Rebounds After Sharp Decline: The $100K Push
Bitcoin’s journey to $100,000 has been anything but smooth. After experiencing a sharp correction earlier in the year, many market participants feared that the cryptocurrency's bull run was over. However, Bitcoin's ability to rebound from its lows with renewed vigor has defied expectations.
Whales Drive the Rally
One key factor behind Bitcoin’s resurgence is the activity of "whales," large-scale investors who hold significant amounts of BTC. On-chain data reveals that whales have been accumulating Bitcoin during periods of lower prices, effectively acting as a stabilizing force during market downturns. By reducing liquidity in the market and concentrating their holdings, whales have created conditions conducive to a price surge.
In addition, whale wallets have been observed transferring large sums of Bitcoin out of exchanges and into cold storage, signaling a long-term bullish outlook. This withdrawal pattern reduces the supply of Bitcoin available for trading, increasing upward pressure on the price.
________________________________________
Realized Cap Hits Record High: A Bullish Signal
Another notable development supporting Bitcoin's rally is its realized capitalization (realized cap) hitting an all-time high. Unlike market capitalization, which multiplies the total supply of Bitcoin by the current price, the realized cap calculates the value of each Bitcoin at the price it was last moved. This metric provides a clearer picture of the aggregate cost basis of Bitcoin holders.
The realized cap reaching a record high indicates that a significant portion of Bitcoin has changed hands at higher price levels, reflecting increased investor confidence. This metric aligns with the narrative of accumulation, as both retail and institutional investors appear to be buying Bitcoin at higher prices in anticipation of future gains.
Accumulation Continues
On-chain analytics reveal that accumulation trends have persisted throughout Bitcoin's recovery. Wallet addresses holding between 1 and 10 BTC have grown substantially, showing that smaller investors are also entering the market. This broad-based accumulation not only adds to Bitcoin's bullish momentum but also reduces volatility by distributing supply across a wider range of participants.
________________________________________
Profit-Taking and Local Top Concerns
While Bitcoin's surge past $100,000 has been met with enthusiasm, some analysts caution that aggressive profit-taking by investors could signal a local top. Short-term holders, in particular, have been selling their Bitcoin to lock in gains, as evidenced by the increasing Spent Output Profit Ratio (SOPR).
Signs of a Local Top?
A high SOPR indicates that investors are realizing profits at a significant rate, which often coincides with price corrections. However, it’s important to note that profit-taking is a natural part of any market cycle and does not necessarily signal the end of a bull run. In fact, periods of consolidation and minor corrections can strengthen the foundation for a more sustainable rally.
Market sentiment, as measured by the Fear & Greed Index, has also entered the "Greed" zone, suggesting that bullish enthusiasm may be running high. Historically, extreme greed has preceded short-term pullbacks, making it crucial for investors to remain cautious.
________________________________________
New Bull Cycle? Bitcoin’s Return to $100K Hints at Significant Price Move
Bitcoin’s return to the $100,000 milestone has rekindled hopes of a new bull cycle, with analysts pointing to several factors that support this narrative. The cryptocurrency market has historically moved in cycles, driven by supply-demand dynamics, macroeconomic conditions, and technological advancements. The current environment appears to align with the early stages of a new bull phase.
Institutional Adoption and Macro Tailwinds
Institutional interest in Bitcoin has grown exponentially over the past few years. Major financial institutions, including hedge funds, pension funds, and publicly traded companies, have embraced Bitcoin as a hedge against inflation and a store of value. This influx of institutional capital has not only validated Bitcoin’s role as a legitimate asset class but also provided a steady source of demand.
Moreover, macroeconomic tailwinds such as high inflation, declining confidence in fiat currencies, and geopolitical instability have enhanced Bitcoin's appeal as a decentralized, non-sovereign asset. Central banks’ monetary policies, including quantitative easing and low interest rates, have further eroded the purchasing power of traditional currencies, driving investors toward Bitcoin.
Supply Shock and Halving Cycles
Bitcoin’s fixed supply of 21 million coins and its halving cycles play a crucial role in its price dynamics. The most recent halving in 2024 reduced the block reward for miners, effectively decreasing the rate at which new Bitcoin enters circulation. This supply shock, coupled with growing demand, has historically preceded significant price rallies.
On-chain data shows that long-term holders, who typically accumulate Bitcoin during bear markets, are now distributing their holdings during this bull phase. This redistribution of supply suggests that a new wave of investors is entering the market, further fueling the rally.
________________________________________
What’s Next for Bitcoin?
As Bitcoin continues to defy expectations, the question on everyone’s mind is: What’s next? While predicting Bitcoin’s price movements with precision is challenging, several scenarios could play out in the near term.
Scenario 1: Sustained Bull Run
If accumulation trends persist and institutional interest continues to grow, Bitcoin could maintain its upward trajectory, potentially reaching new all-time highs. Key resistance levels to watch include $120,000 and $150,000, which could serve as psychological barriers for further price appreciation.
Scenario 2: Short-Term Correction
A short-term correction is always a possibility, especially given the aggressive profit-taking observed in recent weeks. However, such corrections are often healthy for the market, allowing for consolidation and setting the stage for more sustainable growth.
Scenario 3: Macro-Driven Volatility
External factors, such as changes in monetary policy, regulatory developments, or geopolitical events, could introduce volatility to the market. While Bitcoin has shown resilience in the face of macroeconomic challenges, it remains sensitive to major news events.
________________________________________
Conclusion
Bitcoin’s surge past $100,000 marks a pivotal moment for the cryptocurrency market, signaling a robust recovery and the potential start of a new bull cycle. Driven by whale activity, record-high realized capitalization, and persistent accumulation, Bitcoin has defied skeptics and reasserted its dominance as the leading digital asset.
While concerns about a local top and profit-taking are valid, the broader trends suggest that Bitcoin is preparing for a significant price move. Whether this rally leads to sustained growth or faces temporary setbacks, one thing is clear: Bitcoin remains a transformative force in the financial world, offering a decentralized, inflation-resistant alternative to traditional assets.
As we look ahead, the combination of institutional adoption, macroeconomic tailwinds, and Bitcoin’s unique monetary policy positions it for continued success. For investors and enthusiasts, the journey to $100,000 and beyond is more than just a milestone—it’s a testament to the enduring promise of blockchain technology and the future of decentralized finance.

BTCUSD: Reclaimed 100k after 3 months! Next wave to $190k.Bitcoin has turned overbought on its 1D technical outlook (RSI = 73.178, MACD = 2904.000, ADX = 30.769) as it reclaimed the $100,000 marke after exactly 3 months. This is a very structured bullish pattern that consists of a Bullish Wave that peaks and leads to a Megaphone consolidation, which in turn starts the next Bullish Wave. Both waves so far have been around +16.30%. As the 8H MA50 perfectly held Tuesday's low, the pattern has already started the new Bullish Wave, which technically aims for yet another +16.30% rally (TP = 109,000).
## If you like our free content follow our profile to get more daily ideas. ##
## Comments and likes are greatly appreciated. ##

BITCOIN BULLISH TO $114,000 - $116,000 (UPDATE)In my Q1 2025 market breakdown report I said that BTC would drop down towards $78,000 which is exactly what happened. Then in my Q2 report, I said that Bitcoin would start recovering (Wave 4) & flying towards $116-$120,000 which is currently happening. Nice profits.
Call live in front of my investors🤝

BTCUSD – 30m Precision Entry from FVG & Fib Discount Zone🚀 BTCUSD BUY SETUP | May 8, 2025 | Smart Money Precision Execution
This 30-minute chart screams Smart Money accumulation with a golden entry aligned at the 70.5–78.6% Fib levels AND a bullish Fair Value Gap (FVG) just below.
Here’s the confluence breakdown you need to study:
🔍 KEY CONFLUENCES:
🟣 Fair Value Gap (FVG) between $97,800 and $98,550 – prime liquidity zone
📉 Deep Discount Entry at 70.5%–78.6% Fib retracement ($97,797 – $97,200)
🔁 Breaker Block + Internal BOS confirming upside intent
📈 Target: -27% Extension Zone around $100,920
✅ RR: 1:4+ with tight risk below swing low
🧠 Execution Strategy:
Enter near $97,797 – inside the FVG
SL: Below 100% Fib (~$96,800)
TP: -27% Fib (~$100,920) or scale partials at 0% / -10%
Break-even management once price closes above $99,500
📊 Setup Summary:
Timeframe: 30m
Bias: Bullish
Entry: FVG + Deep Discount
TP: -27% extension
SL: Below 100% Fib
RR: 1:4
Structure: Smart Money Reversal
💡 Chart Ninja Insight:
“Smart money enters where retail panic sells. The FVG is the highway—they’re just waiting to get on.”
