BUY MARKET!!!Hello dears
If you are risk-averse, this analysis is for you...
Given the decline we had, you can see that the price was supported within the specified support range and a range was formed that can be purchased with risk and capital management and moved to the specified ranges...
*Trade safely with us*
1-BTCUSD

PEPE BUY ...Hello friends
Due to the price drop, good conditions have been created to buy with risk and capital management and move towards the specified goals...
If you are risk-averse, this signal is for you...
*Trade safely with us*

SOL LIVE TRADEHello dears
Given the price support by buyers and the formation of higher ceilings and floors, we can open a trade with risk and capital management.
*Trade safely with us*

Bullish Continuation SetupThe price of Bitcoin fluctuated sharply on May 7 and showed an upward trend, once approaching $98,000. The overall market is in a strong bullish state, but potential risks brought by a top divergence need to be watched out for. In terms of capital flow, although there is a lack of a large amount of new capital inflow, the increase in holdings by existing holders has driven the price up. If the price can hold firm at $96,000 and continue to rise, the bulls will keep pushing up, and there is hope for further upward space. If it fails to break through the pressure level of the middle band of the Bollinger Bands at $97,650, the bulls may consider taking profits, and the price is likely to return to the trading range for adjustment. The key support level below is in the range of $94,000 - $94,500. If this range is broken, there may be a further decline to $93,000 or even lower.
you are currently struggling with losses, or are unsure which of the numerous trading strategies to follow, at this moment, you can choose to observe the operations within our channel.

Bitcoin Analysis - 7 MayThe price continues to move within the range of $91,700 - $100,400.
In approximately 3 hours, the FED will announce its interest rate decision.
The expectation is for it to remain unchanged.
If it remains unchanged;
there could be a horizontal consolidation between 94,990 – 97,500.
If a breakout occurs, the upward movement will accelerate; otherwise, there could be a pullback to the 91,781 – 94,990 levels.
If the interest rate is reduced;
the psychological resistance at 100,400 USDT may be tested, and if surpassed, the target of 109,605 (ATH) comes into play.
If the interest rate is increased;
the supports at 94,990 USDT and below could be tested quickly.
The levels of 91,781 and 85,085 USDT become potential targets.
With stronger selling, the support zone at the 2024 ATH level of 73,776 USDT may come into play.

"New Hampshire Launches First State Crypto Reserve"On May 7, 2025, the state of New Hampshire made history by becoming the first U.S. state to legally establish a cryptocurrency reserve. This groundbreaking move allows up to 5% of the state’s treasury funds to be allocated to digital assets, starting with Bitcoin and other cryptocurrencies boasting a market capitalization exceeding $500 billion.
Why Is This Important?
Until now, even the most crypto-friendly states in the U.S. have limited themselves to business incentives and relaxed mining regulations. New Hampshire has taken a much bolder step by equating cryptocurrencies to traditional reserve assets like gold and treasury bonds. By doing so, it is effectively recognizing crypto as a long-term financial instrument and a hedge against macroeconomic volatility.
This means the state can use cryptocurrency holdings to diversify its financial base, preserve value, and potentially improve budget flexibility during economic shifts.
Security and Storage
The newly passed legislation specifies that crypto assets must be held either in certified custodial wallets or via regulated exchange-traded products (ETPs) approved by the Securities and Exchange Commission (SEC). This ensures a high level of security and regulatory compliance. In addition, the law mandates that crypto assets must be held for a minimum of 24 months to discourage short-term speculation.
Federal Context and Reactions
While President Trump has proposed the creation of a federal “Strategic Bitcoin Reserve,” the initiative has yet to be implemented. New Hampshire’s move places it ahead of the federal government and presents a model of state-level innovation in fiscal policy.
Many analysts believe this decision could lead to a wave of similar measures in other states, particularly those already supportive of blockchain technology, such as Texas, Wyoming, and Florida.
Potential Benefits
Economists say that integrating digital assets into the public financial system could help protect state funds against inflation, foster technological innovation, and attract new businesses and investors.
The move also sends a message to private sector players: New Hampshire is ready to embrace the future of finance. This could accelerate the migration of blockchain startups, fintechs, and institutional capital to the state.
Criticism and Concerns
As expected, not everyone supports the initiative. Critics argue that investing public money in such volatile assets is premature and risky, especially given the lack of federal regulation and the possibility of sharp market downturns. Some fear political fallout if the investment underperforms.
There are also concerns about transparency and the mechanisms for evaluating which digital assets qualify under the new framework, as only tokens with extremely high market caps are currently eligible.
Conclusion
By creating a cryptocurrency reserve, New Hampshire has taken a bold and symbolic step toward modernizing state finance. It may be too early to gauge the long-term outcome, but the state has clearly positioned itself as a leader in government-level crypto adoption. What began as a local initiative could soon become a national trend.

BTC going up again as I expectedI'm trading BITO and BITI as paired. I want the BITO dividends. I sold my BITI early today.
I don't like to bet on a direction on these over night or on weekends so I will have equal $$
in both. Ill be only in BITO before ex div for that big dividend
btc on bullish#BTCUSD now above the third pattern, price is expected to continue bullish from 98150.
Above and 2 times breakout at 97326 will take the price above 98150, stop loss 96781.
Above 98150 have bullish formation which will target 100k, any reverse below 96781 will retrace bullish back.

BITCOIN BULLISH TO $114,000 - $116,000 (UPDATE)Bitcoin buy's running 1,200 PIPS in profit since I posted this analysis. You'll be in higher profits if you bought when I first posted it on our quarterly report🚀
We've seen Wave 4 bottom form, followed by a BOS showing BTC is now in an uptrend. 1,200 PIPS profit & counting. $116 incoming📈

Bitcoin is Overbought, but $100,000 Target is Still at HandFenzoFx—Bitcoin is overbought at $97,000, a signal indicated by the Stochastic Oscillator. The price is expected to consolidate before the uptrend resumes. In this scenario, a dip toward $93,565 may provide a favorable entry point into the bull market.
Watch this level, followed by $91,720, for bullish signals such as candlestick patterns.
>>> Prop Trading
>>> No Deposit Bonus
>>> %100 Deposit Bonus
>>> Forex Analysis Contest
All at FenzoFx Decentralized Forex Broker

SPY/QQQ Plan Your Trade Video For 5-7 : Breakaway In CounterToday's Breakaway In Counter Trend mode suggests the markets will likely attempt to break downward before the end of trading, today. Why do I state the downward trend direction?
Because the LT/ST trends are BULLISH and the general upward price trend in the SPY over the past 5-10+ days.
Counter-trend patterns are typically inverted compared to the general 5-8 day price trend. If we can't clearly identify a 5-8 day price trend, then the counter-trend patterns should be determined based on the ST/LT and BIAS trend information on the SPY Cycle Patterns data window.
Today, being a FOMC comment day, should stay rather muted/sideways in early trading. Normally, on FOMC days, the markets tend to stay paused ahead of the FOMC comments.
I believe the FED will not raise or lower rates - meaning NO CHANGE. I don't believe the US Fed has any reason to be concerned with US economic performance right now.
Gold and Silver should move into a rally phase today - but that will likely come near the end of the day as the FED comments drive the markets.
BTCUSD has moved into an early FLAGGING formation. This could be very interesting as BTCUSD has been leading the SPY/QQQ by about 4-6 trading days over the past few weeks.
If BTCUSD continues to lead the SPY/QQQ - that means the SPY/QQQ would be in the early breakdown phase right now - moving into a FLAGGING formation possibly next week.
Get some.
#trading #research #investing #tradingalgos #tradingsignals #cycles #fibonacci #elliotwave #modelingsystems #stocks #bitcoin #btcusd #cryptos #spy #gold #nq #investing #trading #spytrading #spymarket #tradingmarket #stockmarket #silver

Market Overview (May 7, 2025)📊 Key Metrics
1. Funding Rate: ~0.018% (on Binance)
— positive rate indicates long position dominance and bullish sentiment
2. Open Interest (OI): GETTEX:29B , up ~ SEED_TVCODER77_ETHBTCDATA:7B in recent days
— rising OI suggests new positions are opening, increasing volatility risk
3. ETF Inflows: +$420.9M (May 6)
— strong institutional demand, especially into BlackRock’s IBIT
4. Fear & Greed Index: 67 (Greed)
— rising greed may signal potential for a short-term correction
⸻
📈 Market Movement Probability
• Upward: 60%
(supported by ETF inflows and positive funding)
• Downward: 40%
(high greed and rising OI could trigger a correction)
⸻
Disclaimer: This is not financial advice. Always do your own research.
Bitcoin Dominance - the two scenarios!Bitcoin dominance continues to rise after breaking out of a rising wedge pattern on the weekly chart. It has now also broken through the 0.786 Fibonacci level.
Next stop is Rectangle 1, where Bitcoin dominance is expected to reach 68% — and most likely, this will mark the top of dominance before it starts to drop, triggering a historic altcoin season.
Scenario 2:
Dominance keeps pushing higher toward Rectangle 2, potentially surpassing 70%. At that point, many altcoins may form new lows, and weak projects could get wiped out.
Fear in the market will hit extreme levels —
but that could signal the beginning of an altseason and the collapse of BTC dominance.
Best regards Ceciliones 🎯

BITCOIN Mirror fractal from the past calls for massive rally!Bitcoin (BTCUSD) appears to be repeating almost the exact same price action as mid-late 2020 as it has broken above the Pivot trend-line that separates the recent distribution from the 2nd Accumulation phase and has successfully re-tested it while the MA50 (blue trend-line) is holding as Support.
If the latter continues to hold, then it might fuel a massive rally similar to October 2020 - April 2021. As you can see both fractals started of with a 1st Accumulation Phase (blue Rectangle) being supported always by their respective MA200 (orange trend-line), which led to the eventual Distribution Phase (red Arc). Even their RSI sequences are identical.
Is this another pattern supporting that BTC will reach at least $150k next? Feel free to let us know in the comments section below!
-------------------------------------------------------------------------------
** Please LIKE 👍, FOLLOW ✅, SHARE 🙌 and COMMENT ✍ if you enjoy this idea! Also share your ideas and charts in the comments section below! This is best way to keep it relevant, support us, keep the content here free and allow the idea to reach as many people as possible. **
-------------------------------------------------------------------------------
💸💸💸💸💸💸
👇 👇 👇 👇 👇 👇

BTC/USD) bullish trend analysis Read The ChaptianSMC Trading point update
Technical(BTC/USDT) analysis outlines a bullish outlook with key technical levels and scenarios. Here's a breakdown of the idea:
Key Observations:
1. Trend Break and CHoCH (Change of Character):
The chart shows a clear break of the downtrend, confirmed by the CHoCH label — a common Smart Money Concept (SMC) signal indicating a potential trend reversal from bearish to bullish.
2. Key Zones Highlighted:
EVC-Buying Zone: Around 86,000 – 88,000 (aligned with EMA 200), marked as a strong accumulation area.
New Support Level: Around 92,000 – 93,000, potentially forming a bullish support after the recent rally.
Resistance Levels: Two major resistance zones near:
99,600 (intermediate resistance and target)
106,400 (final target)
3. RSI Indicator:
RSI is near 64, indicating strong momentum but not yet overbought — a potential sign of further upside.
4. Two Bullish Scenarios:
Scenario 1 (Aggressive Bullish): BTC continues upward from the current level and breaks above resistance toward the 106,447 target.
Scenario 2 (Retracement Bullish): BTC dips to the new support or even into the buying zone (86–88k), then rebounds to reach the same targets.
Mr SMC Trading point
---
Idea Summary:
The chart suggests bullish continuation, with potential pullbacks into strong demand zones. It supports both breakout and retracement entries, with targets at 99,632 and 106,447. If price holds above EMA 200 and RSI remains supportive, the upside thesis remains valid.
Pales support boost 🚀 analysis follow)

May 2 Bitcoin Bybit chart analysisHello
It's a Bitcoinguide.
If you have a "follower"
You can receive comment notifications on real-time travel routes and major sections.
If my analysis is helpful,
Please would like one booster button at the bottom.
Here is the Bitcoin 30-minute chart.
There will be an indicator announcement at 9:30 in a little while.
Unlike Nasdaq, Bitcoin touched the upper Bollinger Band first and is on the verge of an upward trend.
Since there is a possibility of missing the entry point at the current position,
I set the stop loss price short and proceeded aggressively.
*One-way long position strategy when the red finger moves
1. Pursuit purchase at $96,835.6 / When the purple support line is broken,
or when the bottom section is touched, stop loss price
2. Long position target price at $98,766.4 -> Good 2nd target -> Great 3rd target
If the Great section is broken at the top,
the probability of a new high price is high.
From the bottom touch, the mid-term pattern will be broken
(currently 6+12 in progress)
When looking at the candle shape, from the green support line bottom breakout
It can break out strongly, so please refer to the bottom 2, 3 times up to 93016.7 dollars, and if 93K breaks, a downward trend can be connected again, so
You should be careful.
I left the analysis article up to May 6th
and the main points and the drawing section on one page, so it's hard
Please just refer to and use my analysis article up to here
I will see you next week after the holiday.
Thank you.

Bitcoin vs. Saylor: The Power and Danger of fanatical promotionToday I want to talk about Michael Saylor and his influence on many crypto minds and, to some extent, the movement of Bitcoin’s price.
It’s very important to understand who we’re listening to, who we’re following, and whether this person has hidden motives we don’t see due to lack of information or unwillingness to get it — due to our stubborn desire to see only what confirms our own fantasies and thoughts and serves our expectations.
Let’s turn on our reason and objectivity and face the facts.
Michael Saylor is a well-known figure in the crypto world. He promotes the idea of eternal Bitcoin growth and actively buys it to support his words. When the price drops, he even suggests his readers sell their organs, which, to me, is too much.
Let’s move to the facts — everything is Googleable, and promptable.
Facts:
📈 Hype of 2000
In 2000, he rode the dot-com hype with his company MicroStrategy. MicroStrategy was promoted as a pioneer in business analytics and data management software, and he saw himself solely as a visionary of the new economy.
The boom was sky-high — just read about the dot-com era. Stocks of new tech companies were soaring, and it was enough to say “software” and “I see the future.”
In 1998, MicroStrategy successfully held an IPO. In 2000, at the peak of the dot-com boom, the company’s stock reached an incredible $333 per share in March.
He skillfully used the hype, and here was his 2000 narrative:
Digital transformation: Saylor claimed the world was entering a new era where data would become the main asset of companies, and MicroStrategy — the key tool for processing and analyzing it.
Unlimited growth: In the dot-com era, Saylor pushed the idea that tech companies like MicroStrategy would grow exponentially, ignoring traditional financial constraints.
The future is now: Saylor created the feeling that MicroStrategy wasn’t just following trends but shaping them, offering solutions that would define the future of business.
At the same time, he was building a cult around himself, cultivating the image of a genius entrepreneur.
⚠️ Financial reporting scandal
The U.S. Securities and Exchange Commission (SEC) launched an investigation into MicroStrategy. The company overstated revenues, which led to a stock crash (from $333 to $86 in one day) and a loss of investor trust. The stock kept falling and dropped to $0.4 (–100%!).
The SEC filed charges against Michael Saylor personally (CEO), as well as CFO Mark Lynch and the chief accountant. They were accused of intentionally misrepresenting financials to keep stock prices high.
SEC investigation results:
In December 2000, the SEC concluded the investigation, and MicroStrategy agreed to settle without admitting guilt:
* The company paid a $10M fine.
* Saylor, Lynch, and other executives paid personal fines.
* Saylor agreed to pay $8.28M in “disgorgement” (unjust enrichment) and a $350K fine — a total of about $8.63M.
* MicroStrategy committed to revising its reporting and implementing stricter internal controls.
In addition to the SEC settlement ($11M from leadership, including $8.63M from Saylor), MicroStrategy faced shareholder class-action lawsuits, which were settled for $10M.
No executives were criminally charged, but the company’s and Saylor’s reputations suffered greatly.
In other words, Michael didn’t have any moral hesitation about faking company profits during losses. But investors and journalists started asking questions — and the SEC came knocking.
Let’s call it what it is: Saylor committed fraud, using hype, promising endless growth, and creating a cult around himself as a “financial genius and visionary.”
Michael went quiet, and the media tone shifted quickly — from super-visionary to one of the biggest losers and scammers.
To give him credit, he managed to keep the company alive and kept a low profile until 2020, like a mouse. 20 years — a generation change and a new hype cycle.
And what does a tech visionary do? Of course — jump into the new wave. A chance to restore his image — probably more important to him than money.
🟠 Bitcoin Era, 2020
Before 2020, Saylor was a Bitcoin skeptic. In 2013, he even tweeted that “Bitcoin’s days are numbered” and compared it to gambling.
But in 2020, he changed his position after deeply studying crypto. His mission: to protect capital and restore his image as a prophet — and he decided to buy Bitcoin.
But his own money seemed insufficient, so he turned to borrowing.
Here’s how the scheme works:
1.MicroStrategy issues stocks and bonds
📈 They sell new MSTR shares → get cash.
💵 They issue bonds (debt papers) → investors give them money at interest.
2. They use that money to buy Bitcoin
🟧 All the raised funds go into BTC purchases.
They don’t sell. Just hold. Never lock in profit.
3. If BTC rises → MSTR stock price rises
MSTR becomes a kind of "BTC ETF."
📊 BTC growth = MicroStrategy’s market cap growth.
🔁 Then they repeat the cycle.
Stock price up → issue more shares/bonds → buy more BTC → repeat.
📌 The catch:
They use other people’s money (debt) to buy BTC.
They sell almost nothing.
They bet BTC will grow faster than interest on the debt.
So as long as the price goes up — everything is fine.
Let’s admit: his fanaticism, aggressive marketing, and bold statements have helped Bitcoin.
But the main question: will the inevitable market correction wipe out this belief in endless growth?
🔍 His personality
It’s crucial for us as traders and investors to understand who really runs the company or project. The personal traits of leaders are useful information that gives us insight and a behavioral map.
We need to research not only products and financials, but also the psychological types of those making the decisions.
Saylor’s aggressive marketing and loud statements are part of his personality.
He fed off the hype around his persona more than any growing bank balance.
And there’s nothing wrong with that — until you start deceiving people to keep attention on yourself.
For example, in the 2000s, *Forbes* noted that Saylor “sold the dream” of a new economy where traditional profit metrics didn’t matter.
It attracted investors — but didn’t reflect reality. Forbes hinted that his desire to maintain the genius image may have led to accounting manipulation.
Saylor created an "expectations bubble" that burst.
His desire to prove he’s a genius led to a disconnection from reality.
He often talks about himself as a genius and visionary (sounds like a grandiose ego).
He positions himself as the savior of capital through BTC (messiah complex).
He publicly mocks “weak hands” and traditional investors (shows superiority).
He never admits mistakes, even after losing billions (denial and overconfidence).
He repeats his ideas again and again (manic fixation on being right).
His speech is like a manifesto, not a dialogue. He doesn’t converse — he proclaims.
I don’t sense greed in him. I sense emptiness that demands a cult.
He doesn’t live for money — he is obsessed with the idea.
And that’s the problem — there’s no objectivity here. It feels more like revenge after the humiliation and downfall of 20 years ago.
He’s smart — no doubt. But it’s not just intelligence. It’s cold messianism.
Obsession, not passion.
Psychotype: Grand strategist with a humiliation trauma
Trait Behavior
Narcissistic core “I’m special, my vision is above all.”
Obsession with greatness “I must be the truth, not just be right.”
Hyper-rationality “I survive through logic, not feelings.”
Psychological armor “I won’t show weakness. If I break, I disappear.”
Fanatical visionary “My idea is supreme. I don’t need to be humble.”
💸 More facts:
In 2024, Michael paid a FWB:40M fine for tax evasion.
The accusation:
He didn’t pay income tax in D.C., while actively living there — yachts, property, planes, frequent visits.
His tax returns didn’t reflect reality, and the investigation used GPS, Instagram, flight data, banking, and other digital traces.
Saylor didn’t admit guilt but agreed to settle for around $40M.
His personal wealth is mostly in MicroStrategy shares (9.9% or ~$8.74B by end of 2024).
Theoretically, he can sell them — but he must file a report within two days.
Current status:
MicroStrategy owns 555,450 BTC
Average purchase price: ~$68,550
Total purchase cost: ~$38.08B
Unrealized profit: ~$14.7B
And remember — Saylor’s slogan: Forever HODL.
📉 But the key point:
The company’s current debt is $7.24B.
All is good — as long as the price rises.
Analysts estimate BTC would have to fall to ~$20K before MSTR is forced to liquidate.
But if BTC nears the break-even zone, fear might hit shareholders first — triggering stock sell-offs.
If MSTR shares fall — which is likely during a BTC crash — bondholders, especially those with convertible bonds (which make up most of the debt), might demand repayment.
That could force Saylor to sell BTC.
Because in a crypto winter, buyers for MSTR stock or bonds may disappear.
So BTC could fall — not because of actual sales, but from fear of those sales.
This is my main concern with Saylor’s oversized influence on the market.
🐍 A bit of “reptilian” theory
What if BlackRock *planned* to use Saylor’s hands to push Bitcoin and concentrate large amounts in one basket — then take it from him?
Among the main bondholders are big institutions:
* Allianz Global Investors
* Voya Investment Management
* Calamos Investments
* State Street
These bonds are usually unsecured and non-convertible, making them attractive to investors who want Bitcoin exposure without direct ownership.
In case of default, bondholders have priority over the company’s assets — including BTC reserves.
🏛 State Street Corporation
Public company traded on NYSE.
Its biggest shareholders: Vanguard Group and BlackRock .
If so — they could end up holding as much BTC as Satoshi.
BlackRock’s IBIT holds ~500K BTC.
MicroStrategy holds ~500K BTC.
🤔 Questions to reflect on:
* Is industry leader fanaticism good for the development of crypto?
* What is Michael Saylor really doing? Avenging the past? Or truly in love with the technology?
* What risks does a whale with media influence and fanaticism and pockets full of Bitcoin and debt pose to the market?
Waiting for your thoughts in the comments, dear traders! Hugs! 🤗

BTCUSDTHello Traders! 👋
What are your thoughts on BITCOIN?
Bitcoin is currently testing a major resistance zone between $98,000 and $100,000, which also aligns with the 0.707 Fibonacci retracement. This area has previously acted as a strong supply zone, raising the possibility of a short-term rejection.
Scenario 1 – Bullish Breakout:
If price breaks and closes above $100,000, we could see a strong continuation toward $106,000 → $112,000, driven by momentum and possible FOMO.
Scenario 2 – Deeper Pullback Before Continuation:
If Bitcoin gets rejected at resistance, a retest of the lower support zone (previous demand area) may follow.
A successful bounce from that support could reignite bullish momentum in the medium term.
Trading Strategy:
Wait for a confirmed breakout and candle close above $100K for a high-conviction long entry.
Alternatively, look for buy setups on a pullback toward the support zone for a better risk-reward entry.
How are you planning to trade this setup? Breakout or dip-buy? Share your strategy below! 👇
Don’t forget to like and share your thoughts in the comments! ❤️

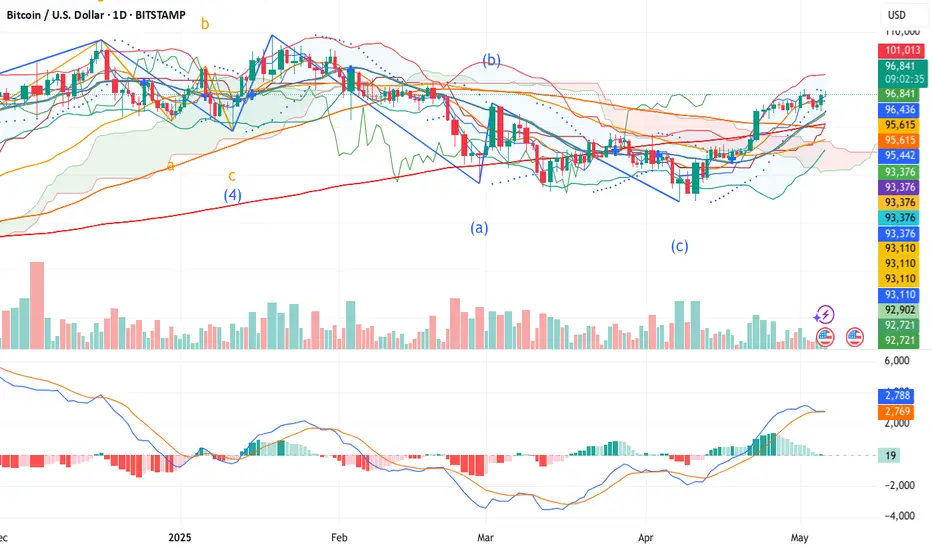
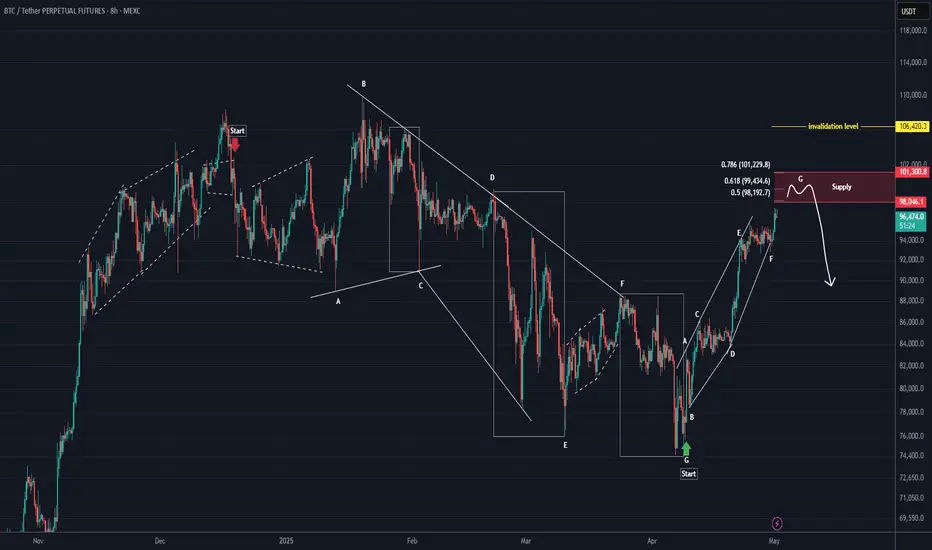
BTC New Update (8H)This analysis is an update of the analysis you see in the "Related publications" section
In the previous scenario, we considered that Bitcoin was in a diametric where wave E had extended. However, after reviewing the charts and analyzing various scenarios, we decided to revise the wave count as shown in this update, since wave E of the previous diametric scenario became overly extended.
You can see the complete wave count of the chart in this update. The correction in Bitcoin started from the point where we placed the red arrow on the chart. This correction was a diametric and ended where the green arrow is placed.
From the point where the green arrow is shown on the chart, Bitcoin's bullish wave has started, which is either wave A or W.
According to this scenario, the expected rejection zone should be between 98K and 103K.
The lowest-risk area for price rejection is the red box.
A daily candle close above the invalidation level will invalidate this analysis.
Let’s see what happens.
For risk management, please don't forget stop loss and capital management
Comment if you have any questions
Thank You
Bitcoin H1 | Potential bullish bounce off a pullback supportBitcoin (BTC/USD) is falling towards a pullback support and could potentially bounce off this level to climb higher.
Buy entry is at 95,480.50 which is a pullback support that aligns with the 50.0% Fibonacci retracement.
Stop loss is at 93,200.00 which is a level that lies underneath a multi-swing-low support.
Take profit is at 97,770.35 which is a swing-high resistance.
High Risk Investment Warning
Trading Forex/CFDs on margin carries a high level of risk and may not be suitable for all investors. Leverage can work against you.
Stratos Markets Limited (tradu.com):
CFDs are complex instruments and come with a high risk of losing money rapidly due to leverage. 63% of retail investor accounts lose money when trading CFDs with this provider. You should consider whether you understand how CFDs work and whether you can afford to take the high risk of losing your money.
Stratos Europe Ltd (tradu.com):
CFDs are complex instruments and come with a high risk of losing money rapidly due to leverage. 63% of retail investor accounts lose money when trading CFDs with this provider. You should consider whether you understand how CFDs work and whether you can afford to take the high risk of losing your money.
Stratos Global LLC (tradu.com):
Losses can exceed deposits.
Please be advised that the information presented on TradingView is provided to Tradu (‘Company’, ‘we’) by a third-party provider (‘TFA Global Pte Ltd’). Please be reminded that you are solely responsible for the trading decisions on your account. There is a very high degree of risk involved in trading. Any information and/or content is intended entirely for research, educational and informational purposes only and does not constitute investment or consultation advice or investment strategy. The information is not tailored to the investment needs of any specific person and therefore does not involve a consideration of any of the investment objectives, financial situation or needs of any viewer that may receive it. Kindly also note that past performance is not a reliable indicator of future results. Actual results may differ materially from those anticipated in forward-looking or past performance statements. We assume no liability as to the accuracy or completeness of any of the information and/or content provided herein and the Company cannot be held responsible for any omission, mistake nor for any loss or damage including without limitation to any loss of profit which may arise from reliance on any information supplied by TFA Global Pte Ltd.
The speaker(s) is neither an employee, agent nor representative of Tradu and is therefore acting independently. The opinions given are their own, constitute general market commentary, and do not constitute the opinion or advice of Tradu or any form of personal or investment advice. Tradu neither endorses nor guarantees offerings of third-party speakers, nor is Tradu responsible for the content, veracity or opinions of third-party speakers, presenters or participants.

DeGRAM | BTCUSD Holds the Accumulation Zone📊 Technical Analysis
● BTC rebounded off rising‐channel boundary and has formed a base in the $93K–95.3K accumulation zone. A decisive break above ~$95,700 would confirm a fresh leg to $98,000.
● Higher lows and tightening range signal building bullish pressure for an impulsive move toward the channel top.
💡 Fundamental Analysis
● Spot BTC ETFs logged ~$675 M of net inflows on May 2.
✨ Summary
Rising‐channel support + sustained ETF demand favor a short‐term long bias: targets GETTEX:98K → $100K; view invalidated below $91,500.
-------------------
Share your opinion in the comments and support the idea with a like. Thanks for your support!

BITCOIN UPDATE TOTALLY BULISHSO
correction endedearlier, now is totally up
Buy Level @ 96.400
Targets @ 98.400 / 99.400 / 101.800 / 106.600 and Further

GbpAud now the “buyers” are within!Good day traders, we back with GBPAUD but before I go into it. Last week I took loss because I was buying GBPAUD but I lately found out I was way too early and my narrative has not changed at all.
1D- Daily TF we have a bearish structure and we know that once price shifts structure we want price to retest Atleast till the 0.705 of the OTE fib level to later continue to the Sellside liquidity.
4H- On this respective TF we are also in a bearish structure but I believe not for long because on the lower TF the shift higher has materialised, giving confirmation that we can start positioning ourselves for the up movement.
1H- ICT has a entry model(F.PFVG), on the hourly we saw prices giving back all of yesterday’s gains till it reach that level of first presented FVG and that’s what we gonna use as the level of interest.
