AMD BULLISH MAY6TH 2025AMD has its earnings today & I am bullish as per the price action. I have managed my risk, and I am long irrespective of any news. I have discussed in depth analysis of AMD. If you have any questions, feel free to leave a comment below.
NOTE: I AM LONG ONLY WITH STOCKS
1-BTCUSD

PENGUUSDTA risky analysis of a popular meme coin..
Based on this analysis, we are in wave 4 and it is expected to end soon and enter wave 5..
Around 0.091 to 0.085, if the price reaches it, it will be suitable for a short swing to the target of 0.0163 and 0.0175..
Ideal time zones are also marked with low tolerance..
This analysis can be easily filled..

XRP : ETF...Hello dears
Considering the good growth we had, you can see that the price is stuck in a long-term range and has not managed to break it yet...
We must be prepared for any scenario, so the best thing to do is to buy stepwise, of course with capital and risk management.
Note that this analysis is on a daily time frame and may take a while, so if you are not patient, do not enter.
*Trade safely with us*

Analysis of the Latest SignalsThe advancement of the Bitcoin Reserve Bill in many US states, such as Arizona's plan to allocate 10% of state assets to BTC, combined with the discussion on the regulatory framework at the White House Crypto Summit, may make policy clarity a catalyst for future market conditions. The market is watching this week's FOMC decision. If the rate - cut expectation heats up, it may promote the recovery of Bitcoin liquidity.
you are currently struggling with losses, or are unsure which of the numerous trading strategies to follow, at this moment, you can choose to observe the operations within our channel.
Trading Strategy:
buy@93500-94000
TP:95500-96000

Bitcoin is likely to rise after its declineFrom the perspective of historical trends and technical indicators, when the short-term moving averages show a bullish arrangement, it is usually a relatively strong signal. However, the previously mentioned signs of a bearish divergence in the MACD indicator imply the risk of a pullback. If Bitcoin can break through the recent resistance level, such as $95,000, it may trigger a new round of upward trend. Conversely, if it fails to break through and the selling pressure continues to increase, there may be a certain degree of decline.👉👉👉
From the demand side, although the inflow of ETF funds is still lower than the level in 2024, the apparent demand has turned positive since the end of February, indicating a certain purchasing power. If this kind of demand continues to grow, it will provide support for the price of Bitcoin. On the supply side, the total amount of Bitcoin is fixed, and the increase in mining difficulty has slowed down the growth rate of new currency supply, which is conducive to price stability or increase to a certain extent.
BTCUSD Trading Strategy
buy @ 93500-9370
sl 925000
tp 94800-95000
If you approve of my analysis, you can give it a thumbs-up as support. If you have different opinions, you can leave your thoughts in the comments.Thank you!👉👉👉

Here's a simply analysis on BTC.BTC Update:
BTC faced rejection after reaching $97.8k, and with the current price at $94.4k, it is now in Retest Range 1 between $92.5k and $94.5k. This range has previously shown multiple rebounds, but when compared with the RSI, the chances of further rejection appear higher.
In another scenario, if BTC fails to hold Retest Range 1, we may see it pulling back or retesting levels around $87k.
Be cautious with multiple long positions for now and always trade with a proper stop-loss.
Regards,
Dexter

2 out of 2? gBPcAd..iT’s tIMe yET?1D- Daily timeframe we saw price break structure lower but after the break price did not move lower in fact we saw it retracing.
4H- Here price agreed with the daily by breaking structure higher to go take the liquidity(Internal) resting higher, if we take a closer look at the leg that broke structure higher we can than identify imbalances in price and as ICT mentions price looks for two things 1. liquidity and 2. Imbalances. Right now our focus is price balancing before going for the buyside.

BTCUSD INTRADAY sideways consolidationThe BTC/USD pair maintains a bullish overall sentiment, underpinned by a sustained upward trend. However, recent intraday price action suggests a phase of sideways consolidation, indicating a potential buildup before the next directional move.
Key Levels:
Support: 90,880 (primary), followed by 88,800 and 87,070
Resistance: 98,940, with extended targets at 101,030 and 101,100
A corrective dip toward the key support zone at 90,880 could offer a bullish rebound opportunity. A successful bounce from this level would reinforce the uptrend and pave the way for a test of the 98,940 resistance. A breakout above this level may open the door to further gains toward 101,030 and 101,100 over the longer term.
Conversely, a decisive break and daily close below 90,880 would invalidate the bullish setup, potentially triggering a deeper pullback toward the 88,800 and 87,070 support levels.
Conclusion:
While the broader trend remains bullish, BTC/USD is currently consolidating. Traders should watch the 90,880 support closely—its defence may confirm trend continuation, while a breakdown could signal a short-term bearish reversal.
This communication is for informational purposes only and should not be viewed as any form of recommendation as to a particular course of action or as investment advice. It is not intended as an offer or solicitation for the purchase or sale of any financial instrument or as an official confirmation of any transaction. Opinions, estimates and assumptions expressed herein are made as of the date of this communication and are subject to change without notice. This communication has been prepared based upon information, including market prices, data and other information, believed to be reliable; however, Trade Nation does not warrant its completeness or accuracy. All market prices and market data contained in or attached to this communication are indicative and subject to change without notice.

SPY/QQQ Plan Your Trade For 5-6 : GAP Breakaway patternToday's pattern suggests a morning GAP will take place and price will continue to break away from yesterday's body range.
Given the fact that the markets are already almost 0.8-0.9% lower than yesterday's closing price level, this suggests the markets will continue to trend downward today.
Is this it? Is this the breakdown for May 2-5, seeking the Major Bottom I've talked about for the past 3+ weeks?
We'll find out over the next 5-10+ days.
Ultimately, the EPP patterns have aligned across multiple instruments/symbols to present a very clear opportunity to the downside. Now, we need to watch and wait as the markets should be moving into the early FLAGGING stage of the downward EPP pattern.
After the FLAGGING pattern, we should get the breakdown into consolidation, which is where I believe big profits can be made. That breakdown into the consolidation phase is usually very aggressive and can often be after the FLAGGING range.
Gold and Silver are making a move higher. I suggested this would be the case over the past 5-10+ days - but, boy, was it frustrating to watch Gold and Silver consolidate over the past few weeks.
At this point, I'm looking for Gold to rally above $3500 and for Silver to attempt to rally above $34.00.
Bitcoin seems to be leading the SPY/QQQ (again) and appears to be about 2-3 days ahead of the major US indexes, attempting to move into a downward FLAGGING formation.
This could be very interesting if BTCUSD continues to lead the SPY/QQQ. Meaning, we may be able to rely on the structures/setups in BTCUSD as a 2-3 day early window of that the SPY/QQQ may be doing (for a while). I'm sure it won't continue to align at some point in the future.
Again, I'm getting great comments from followers and subscribers. Thank you.
I'm doing my best to deliver the best research I can within these 15 to 20-min videos.
Get some.
#trading #research #investing #tradingalgos #tradingsignals #cycles #fibonacci #elliotwave #modelingsystems #stocks #bitcoin #btcusd #cryptos #spy #gold #nq #investing #trading #spytrading #spymarket #tradingmarket #stockmarket #silver

Usdcad PWL?!Good day traders, we back with USDCAD on the 4h TF. Well for this setup I am looking for price to take out out previous week low, previous week we had a candle stick pattern recognition after we saw price move lower but failing to close lower told a different story that price is not yet ready to start moving higher which honestly speaking was my bias last week. For the rest of the day I believe we can expect lower prices to close the day.

Bitcoin: The Robot Taxi Driver We Didn’t NeedWhy Blockchain Is Driving the Future Without It
In the 1990 sci-fi classic Total Recall, Arnold Schwarzenegger’s character hails a futuristic taxi only to be greeted by “Johnny Cab”—a creepy, clunky robot driver that awkwardly talks while struggling to navigate.
Back then, audiences imagined a future where robotic taxi drivers would be commonplace. But instead, we got something far superior: fully autonomous, self-driving cars that render robot drivers unnecessary.
The same is happening with Bitcoin. It was revolutionary, sure—but much like Johnny Cab, it’s outdated, inefficient, and rapidly becoming irrelevant in a world driven by advanced blockchain technology.
Bitcoin: The Nostalgic First Step
When Bitcoin burst onto the scene, it felt groundbreaking—just like the idea of robot taxi drivers in the Total Recall era. It gave us a new way to transact, free from centralized banks. People were thrilled, seeing it as the future of money.
But here’s the problem: Bitcoin was never the endgame. It was merely the proof-of-concept—like Johnny Cab showing that, yes, you can put a robot behind the wheel… but does that mean we should?
As financial systems evolved, Bitcoin’s shortcomings became glaringly obvious:
✅ Slow transaction speeds
✅ High fees
✅ Lack of scalability
✅ Energy inefficiency
Meanwhile, blockchain technology—the real revolution—kept advancing, proving that we don’t actually need Bitcoin any more than we needed Johnny Cab.
Enter Blockchain: The Self-Driving System
Self-driving cars didn’t need robot taxi drivers, and blockchain doesn’t need Bitcoin.
Blockchain is the foundation—an autonomous, self-sustaining system that underpins everything from finance to supply chains to digital assets.
In fact, precious metals, equities, and commodities are all moving toward digitization—but not through Bitcoin. Instead, they’re being integrated directly into blockchain-based ecosystems that offer seamless, smart contract-driven transactions.
The result?
💨 Faster
💡 More efficient
🛠️ Scalable & adaptable
Bitcoin, on the other hand, is stuck in the past. It’s clunky, expensive, and increasingly unnecessary—just like a robot taxi driver frantically punching buttons while self-driving cars smoothly navigate the streets.
Why Bitcoin Will Be Left Behind
Much like how we skipped the “robot taxi driver phase” and went straight to autonomous vehicles, the financial world will soon skip Bitcoin entirely as blockchain technology takes over.
Everything digital is moving toward streamlined, automated systems—systems that don’t require Bitcoin as an intermediary.
So the real question isn’t, “Will Bitcoin survive?”
It’s: “Why would we even need it?”
Just like Johnny Cab in Total Recall, Bitcoin might be fun to look back on—but it’s not the future.
Blockchain is the self-driving car. Bitcoin is the unnecessary robot driver.
And in a world that values efficiency, guess which one we’re leaving behind? 🚗💨
INDEX:BTCUSD CRYPTO:BTCUSD NASDAQ:COIN NASDAQ:MSTR NASDAQ:MARA TVC:GOLD TVC:SILVER TVC:DXY SP:SPX NYSE:BLK NASDAQ:TSLA NYSE:GME INDEX:ETHUSD CRYPTO:XRPUSD CRYPTO:ADAUSD

BTCUSD Possible Move May 6th 2025🔻 BTC/USD – SHORT SIGNAL & ANALYSIS
📉 Signal:
Sell BTC/USD below 94,000 after a confirmed break and retest of the ascending trendline.
Target: 93,000 liquidity zone
Stop Loss: Above 94,400 (or structure high after retest)
Risk/Reward: Approx. 1:2+
📊 Analysis:
Price has been in a descending channel, followed by a corrective structure forming higher lows.
Currently testing a rising trendline, suggesting weakening bullish momentum.
Clean liquidity pool rests around 93,000, likely to be targeted if structure breaks.
Expected flow:
Break below 94,000 trendline
Retest the trendline as resistance
Continuation to 93,000 demand/imbalance area
🧠 Trade Idea Summary:
This setup aligns with bearish market structure and liquidity concepts. A breakdown from the trendline would confirm bearish intent, with 93,000 as the next logical draw on price.

BITCOIN Climbing the Fibonacci Staircase..Bitcoin (BTCUSD) has come into the Fed Rate Decision week stronger that ever, having staged an impressive rebound from the early-April Low. The consolidation of the last few days is of course a market reaction in anticipation of the big interest rate news.
Regardless of that, the Channel Up that is the underlying pattern from the start of this Bull Cycle has been filling on an impressive symmetrical scale all .382 Fibonacci extensions one by one. The most recent has been the 4.382 and naturally the next in line is the 5.382 Fibonacci extension.
Since the last one (4.382) was almost hit before the price pull-back, it would be more fitting to assume the next peak slightly below the 5.382 Fib ext as well as $170000.
This may very well be the final High i.e. the Cycle's Top before the next Bear Cycle begins, depending on the time it hits it.
Do you think that would be the case? Feel free to let us know in the comments section below!
-------------------------------------------------------------------------------
** Please LIKE 👍, FOLLOW ✅, SHARE 🙌 and COMMENT ✍ if you enjoy this idea! Also share your ideas and charts in the comments section below! This is best way to keep it relevant, support us, keep the content here free and allow the idea to reach as many people as possible. **
-------------------------------------------------------------------------------
💸💸💸💸💸💸
👇 👇 👇 👇 👇 👇

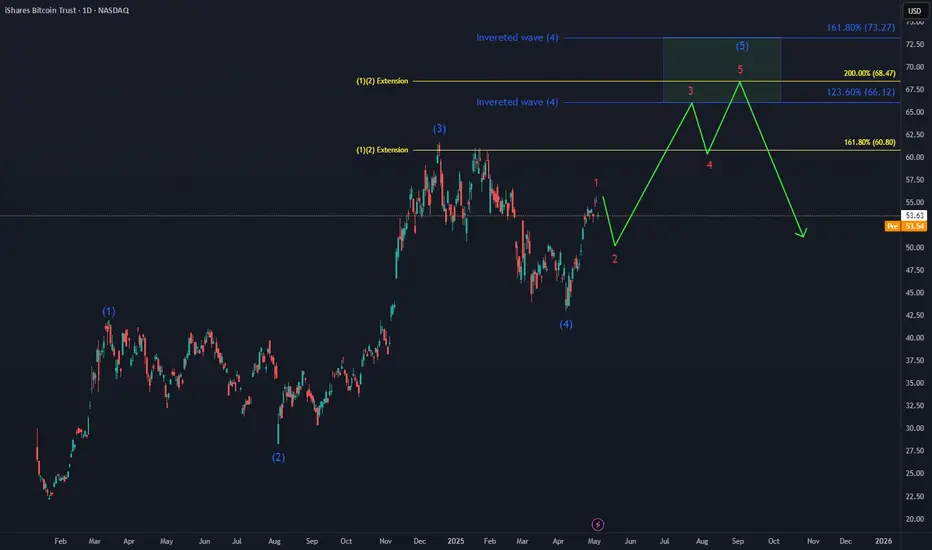
Bitcoin ETF IBIT Next TargetThe Bitcoin INDEX:BTCUSD ETF NASDAQ:IBIT is shaping a 5-wave move toward a new ATH, set to complete its cycle within a regular impulse.
Key technical area for the next move higher:
🔵 Inverted wave (4) target : $66 - $73
🟡 Wave (1)(2) extension : $68
BITCOIN/GOLD BITCOIN/GOLD 🌊
Physical gold vs. Digital gold
2010: 1 BTC 0.0001 GOLD
2025: 1 BTC 27.9 GOLD

BTC testing support or more downside?After breaking out of last week's range, BTC failed to flip R to S. Currently testing potential support, if price fails to hold it current price range between $93.k, we could see a retest of GETTEX:92K or the 1D 200MA around $90k.

Will risk-on sentiment continue to fuel Bitcoin's rally?
President Trump stated that he is open to reducing tariffs on China and that negotiations with key partner countries are progressing smoothly. However, he also revealed via social media that he has ordered a 100% tariff on certain foreign-produced films, signaling that tariff risks remain.
The ISM Services PMI for April came in at 51.6. New orders rose to 52.3, marking the highest level this year, while prices paid continued to climb for a fifth consecutive month, reaching the highest level since January 2023.
BTCUSD is consolidating between the two EMAs after breaking below the lower boundary of the ascending channel. The price is awaiting a fresh trigger to resume its uptrend. If BTCUSD falls below the EMA78, the price may decline further toward the support at 91000. Conversely, if BTCUSD re-enters the ascending channel, the price could gain upward momentum toward the resistance at 98500.

Bitcoin has a strong bullish momentum, could it rise further?The price is falling towards the pivot which is a pullback support and could bounce to the pullback resistance.
Pivot: 92,947.86
1st Support: 88,510.65
1st Resistance: 99,514.34
Risk Warning:
Trading Forex and CFDs carries a high level of risk to your capital and you should only trade with money you can afford to lose. Trading Forex and CFDs may not be suitable for all investors, so please ensure that you fully understand the risks involved and seek independent advice if necessary.
Disclaimer:
The above opinions given constitute general market commentary, and do not constitute the opinion or advice of IC Markets or any form of personal or investment advice.
Any opinions, news, research, analyses, prices, other information, or links to third-party sites contained on this website are provided on an "as-is" basis, are intended only to be informative, is not an advice nor a recommendation, nor research, or a record of our trading prices, or an offer of, or solicitation for a transaction in any financial instrument and thus should not be treated as such. The information provided does not involve any specific investment objectives, financial situation and needs of any specific person who may receive it. Please be aware, that past performance is not a reliable indicator of future performance and/or results. Past Performance or Forward-looking scenarios based upon the reasonable beliefs of the third-party provider are not a guarantee of future performance. Actual results may differ materially from those anticipated in forward-looking or past performance statements. IC Markets makes no representation or warranty and assumes no liability as to the accuracy or completeness of the information provided, nor any loss arising from any investment based on a recommendation, forecast or any information supplied by any third-party.

BTCUSD: 1H Death Cross might be dangerous but expect $100k if inBitcoin remains bullish on its 1D technical outlook (RSI = 61.614, MACD = 2557.800, ADX = 37.923) despite the correction since Friday's high. This is because the underlying pattern is a Bullish Megaphone which just bottomed. On the other hand, the 1H timeframe just formed a Death Cross. If this is invalidated and the price remains inside the Bullish Megaphone (also see that the 1H RSI is on a Bullish Divergence), we can see $100k on the next leg up (1.5 Fib extension like the 2 HH before). If the Bullish Megaphone breaks, testing the 1D MA200 at least, is veyr likely.
## If you like our free content follow our profile to get more daily ideas. ##
## Comments and likes are greatly appreciated. ##

BTCUSD Price ActionHello traders!
If you look closely at the left side of the chart, you’ll notice multiple rejections from the same zone — forming a head-and-shoulders-style distribution. This area has now become a strong supply zone.
Key Observations:
Price respected the trendline and formed a base just beneath the supply zone.
We saw a base breakout followed by a liquidity grab, which likely cleared out early buyers.
Price is now heading back into the supply zone with imbalance, aligning with the trendline and previous rejection area.
📌 What to Expect:
This is a high-probability short setup. If price taps into the supply zone again, it could trigger a strong move down, especially with liquidity already swept.
🎯 Idea: Wait for confirmation around the supply zone and consider shorting with a target near the support level below.

BTC SHORT TERM FOLLOW UP BE SURE TO BUY AT 89-91k"Last alert for the dip — this is a follow-up to my initial analysis on the short-term period."

MINA : Is the shedding over ?Hello friends
Given the heavy fall of this and the prolonged price correction, you can now see that the price is supported within the specified support range, which is a good sign...
We have identified important support areas for you, where you can buy in steps and with risk and capital management.
We have also identified targets.
*Trade safely with us*

ENA : The largest token release...Hello dears
Given the long-term price decline that we have witnessed, it has now been announced that this currency is going to do a token release, which will naturally cause the price to fall, so be careful.
In case of a fall, we have identified important supports for you so that you can buy with risk and capital management.
The target has also been identified.
*Trade safely with us*
