1-BTCUSD

JTO : Price at a critical point: Falling or rising?Hello friends
Given the long-term range that this currency has made, the price has now reached the bottom of the range, which is very sensitive, and this currency also has a token release, which can be a warning.
In case of a drop, we have identified important supports for you, so that you can buy with risk and capital management.
*Trade safely with us*

MOVE : Where to buy ?Hello friends
Given the upcoming token release, the price is expected to continue to fall, so be careful.
In case of a fall, we have identified important support levels for you, where you can buy with capital and risk management.
*Trade safely with us*

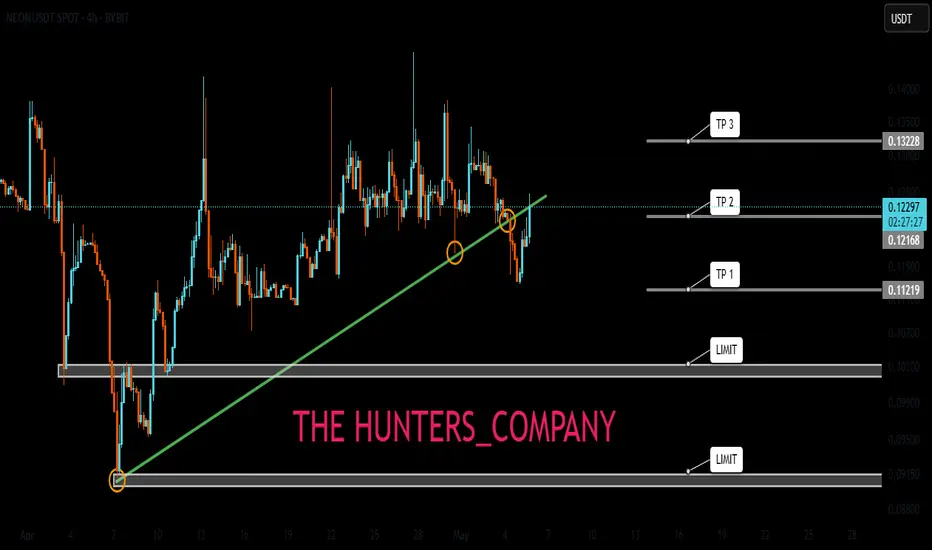
NEON : How long does the decline last?Hello friends
If you are a holder of this currency or have bought it, you should know that the token release is coming and this will cause the price to drop, so be careful.
We have identified good buying ranges for you, where you can buy in case of a drop, with risk and capital management.
*Trade safely with us*
AGI : The fall is comingHello friends
As the price has reached a strong resistance area, you can see that the price has been corrected and lower lows have been made. Now, given the token release that this currency has, there is a possibility of further decline, so we can buy at lower points with capital and risk management and move with it to the specified targets.
*Trade safely with us*
SUI SIGNAL...Hello friends
As you can see, buyers entered the price correction and a reversal pattern is being built...
Due to the buying pressure and the entry of buyers, we can buy within the specified ranges and move towards the set targets, of course with capital and risk management.
*Trade safely with us*

NOT SELLHello friends
Due to the sharp drop in price, we can open a trade in the direction of the trend, of course with capital and risk management.
*Trade safely with us*

TRB SELLHello friends
Due to the sharp drop in price, we can open a trade in the direction of the trend, of course with capital and risk management.
*Trade safely with us*

Bullish sentiment is favorable.Bitcoin is currently in a crucial stage of the battle between bulls and bears. There is both short-term pullback pressure and technical support. The movements of institutional funds and policies remain the dominant factors.
The single-day net inflow of BlackRock's IBIT Bitcoin ETF reached a record of $1 billion. The continuous inflow of institutional funds provides support for the price.
The resistance levels have recently concentrated in the range of $97,800 - $98,000. Once broken through, it may challenge the $100,000 mark.
you are currently struggling with losses, or are unsure which of the numerous trading strategies to follow, at this moment, you can choose to observe the operations within our channel.

BTC | WHY Bitcoin is BULLISH | 2021 Fractal5 reasons why I say BTC is on it's way to a new ATH (All Time High) :
✅1️⃣ Support zone reclaimed
BTC has successfully reclaimed the support zone ABOVE the neckline resistance, a topic that I've been discussing over the past two weeks. If you'll recall, I pointed out either 70k or 90k. We have our answer:
✅2️⃣ Trendlines
Trendlines are BULLISH as BTC continues to make highger lows, a key indication of bullish sentiment even when a pullback is present:
✅3️⃣ Moving Averages
BTC has reclaimed ALL moving averages in the daily, a bullish indication:
✅4️⃣ Trend Based Indicators
A bullish flash in the weekly is a strong sign:
✅5️⃣ Fractal
It's possible that BTC plays out similarly to the previous ATH fractal from 2021:
________________________
BINANCE:BTCUSDT

Support to be testedIf that green box of support is any indicator, we will see if bulls hold strong between 91.5k and 92.8k
If support is broken, next level of support could be 88.3k to 89.5k
Share your thoughts -- are we still in a bear market or to the moon from here?

BITCOIN Support Ahead! Buy!
Hello,Traders!
BITCOIN is trading in an
Uptrend but is making a
Local bearish correction
However, a horizontal
Support level is ahead
Around 92,191$ so after
The retest we will be expecting
A local bullish rebound
And a move up
Buy!
Comment and subscribe to help us grow!
Check out other forecasts below too!
Disclosure: I am part of Trade Nation's Influencer program and receive a monthly fee for using their TradingView charts in my analysis.

BTC - Bullish Momentum To Continue!INDEX:BTCUSD has broken the lower highs and resistance trend line on the daily chart after forming bullish divergence on RSI.
RSI divergence signals reversals and in BTC's case, it has led to the break of lower highs (bullish reversal) and continuation of the overall bullish trend on higher timeframes.
I am expecting BTC to create a higher low around the support zone and continue its upward momentum!

Bitcoin: $94K and Climbing!Price Movement and Technical Patterns
Bitcoin (BTC) is currently trading at $94,075 on the 4-hour timeframe, marking its highest level in over two months. This surge comes after a clean breakout above a key trendline, a move that often signals the start of a strong upward trend. Over the past few weeks, BTC has climbed 28% from its five-month low of below $75,000, hit on April 9, 2025. Right now, it’s testing a major resistance level near $95,000. On the 4-hour chart, you’ll notice a clear pattern of higher highs and higher lows, a textbook bullish setup. The price has also broken out of a falling wedge pattern, which is typically a reversal signal that points to more gains ahead. Support is holding strong around $80,000, while the price seems to be coiling between $82,000 and $86,000, hinting at a possible explosive move toward $100,000 if it breaks out of this range.
Market Context and External Influences
What’s driving this rally? A big part of it is the broader economic picture. With trade tensions and tariffs stirring up global markets, Bitcoin is stepping up as a safe-haven asset, much like gold, which has also been on a tear lately. Investors seem to be turning to BTC to hedge against uncertainty, and that’s pushing prices higher. On top of that, there’s some positive news in the crypto space: the Maldives just signed a $9 billion deal to build a crypto hub, which could spark more mainstream adoption and boost market sentiment. There’s also chatter about the U.S. possibly pausing tariffs, which might ease economic pressure and give Bitcoin more room to run. These factors combined are creating a pretty supportive backdrop for this price action.
On-Chain Data and Investor Behavior
Digging into the data, there’s more evidence that big players are betting on Bitcoin. Large investors, often called "whales," have been scooping up BTC at a rate three times higher than what miners are producing daily. This kind of accumulation mirrors what we saw during the 2020 bull run, right before prices took off. It’s a sign that these heavy hitters are gearing up for something big. The 4-hour chart backs this up with steady buying pressure and no major sell-offs yet. If this trend holds, and Bitcoin stays above its key support levels, we could see a push toward new all-time highs sooner rather than later. Keep an eye on that $95,000 resistance, it’s the next big test.
What to Watch For
So, where does Bitcoin go from here? The technicals are screaming bullish: the breakout, the higher highs, and the wedge pattern all point up. But it’s not just about the chart, external factors like economic shifts and crypto news will play a role too. If BTC can smash through $95,000 with solid volume, $100,000 comes into view fast. On the flip side, a drop below $80,000 could cool things off, though the whale buying makes that less likely for now. For traders, this is a spot to watch for a breakout or a pullback to scoop up a dip. Either way, Bitcoin’s got momentum, and the market’s buzzing with potential.

btc on bullish#BTCUSD price have been declined and now forming to reverse above 95915 for sell retrace.
Above 94463 holds a strong bullish which will reach 95915, stop loss at 93725.
Below 93725 holds another bearish confirmation which will drop 93k-92500.

BTCUSD – Discount Zone Play | Long Setup Loading📉 BTCUSD – 15-Minute SMC Breakdown | May 3, 2025
Bitcoin is cooking up something spicy inside this discount zone. All the ingredients are there for a bullish reversal — we just need the final confirmation to execute the long.
🧠 SMC Breakdown:
POI Identified: Price has broken into a key OB discount zone (61.8%–79%), tapping 70.5% and chilling near the 79% fib retracement.
Weak High: Noted above at ~96,950 – a liquidity target ready to get swept.
Price Structure: Series of lower highs and lows forming bearish structure, but no momentum break yet. We're in accumulation range.
🎯 Entry Criteria (Potential):
Wait for CHoCH (Change of Character) on lower timeframes (e.g., 1min or 5min) to confirm reversal intent.
Ideal entry = bullish engulfing or BOS from within the 70–79% zone
SL = below 95,900 (clear invalidation level)
TP = Weak High → 96,950+
RR Potential = ~1:5+
📌 Why This Matters:
Price is deep in premium vs. discount logic.
Smart Money loves entries in the 70–79% retracement zones — it’s the sniper's nest.
That Weak High = unfinished business. Expecting bullish expansion if this zone holds.
📊 Pro Tips:
Wait for confirmation, don’t blindly buy in the zone.
Look for signs of absorption or bullish reaction candles.
Always map invalidation level BEFORE entering.
🔥 Final Note:
This is the “load-the-clip” zone for Smart Money. No hype, just structure. If BTC reacts here, we could see a clean 1:5 RR into that Weak High.
💬 What do YOU think happens next?
💾 Save this setup – it’s textbook.
🔁 Share this with your trading squad & don’t miss the next wave.

SPY/QQQ Plan Your Trade For 5-5-25 : GAP Reversal PatternToday's pattern suggests the SPY will open with a GAP range from yesterday's candle Body and attempt to reverse the trend we saw last week.
I believe this move will resolve to the downside, as I've been warning of the May 2-5 Major Bottom for many weeks.
I believe the extended uptrend over the last few weeks was pure speculation related to Q1 US earnings. It is hard to argue that traders playing into the Q1 earnings boost didn't play the right side of the trend after watching the markets rally over the past 2+ weeks. But, I still believe the markets will consolidate and attempt to move downward over the next 10- 20+ days.
The one thing that we have to understand is Q1 was almost on auto-pilot from Biden's economy/spending until Trump threw a curveball at the global markets with tariffs.
I don't believe the US & global markets have truly priced in a global -25% to -45% economic contraction because of the ongoing tariff negotiations. It has been reported that shipping rates are down 60% in China. I believe we still need another 30-60+ days to work out the tariff issues and to allow the markets to settle into proper expectations for future economic output/growth.
Because of this, I continue to urge traders to stay cautious.
Sitting on CASH right now (only trading 20% of your total capital) is probably the smartest thing you can do at the moment.
I still expect the July and October 2025 lows to be the base/bottom of the markets, leading to a stronger upward price trend.
Right now, I've very cautious we've just seen a "dead-cat bounce" off recent lows because of Q1 earnings expectations.
Now that we've passed most of the Q1 data - we are staring at Q2 & Q3. What comes next.
I believe Gold/Silver will continue to price in extreme risk factors - resulting in a strong rally through May and into June.
I believe Bitcoin will stall and move back down to the lower consolidation range.
Let's see how things play out this week.
Get some.
#trading #research #investing #tradingalgos #tradingsignals #cycles #fibonacci #elliotwave #modelingsystems #stocks #bitcoin #btcusd #cryptos #spy #gold #nq #investing #trading #spytrading #spymarket #tradingmarket #stockmarket #silver

BTCUSDT - near to his resistance ? What's next??#BTCUSDT - market just placed his resistance area and now market trade below that.
Keep close that and if market holds current high then we can expect a drop from here.
Good luck
Trade wisely

BTC/USDT 1H Chart: Channel Breakdown Alert!Hey Bitcoin traders! Let’s dive into this 1-hour BTC/USDT chart. Bitcoin has made a decisive move, and it’s not looking good for the bulls!
BTC was trading within a well-defined ascending channel, with key levels at $95,800 (upper resistance) and $88,000 (last higher high). The price recently tested the support around $95,800 but failed to rebound, and now it’s crashed below the channel’s support, currently sitting at $94,300. This breakdown signals potential bearish momentum!
The next critical support to watch is $92,000, and if that fails, we could see BTC slide toward the previous resistance at $84,400. On the flip side, a recovery above $93,000 might bring some relief, with resistance at $98,000 and a potential retest of $100,000.
Key Levels to Watch:
Resistance: $95,800, $98,000
Support: $92,000
Breakdown Target: $86,000
Recovery Target: $98,000+
The bears are in control — where do you think BTC is headed next? Let’s hear your thoughts below!

05/05/25 Weekly OutlookLast weeks high: $97,941.18
Last weeks low: $92,845.16
Midpoint: $95,393.17
FOMC week returns once again on Wednesday, the forecast suggests no change to the interest rate is expected with 4.5% staying as is. The tariff acceleration we saw last month brought into question the timing of rate cuts and if they would be brought forward, it looks like this FOMC is too early to see a cut but it is coming in the future if president Trump gets his way.
The chart is an interesting one but one that isn't too surprising. The orderblock that sent Bitcoins price to $74,500 was at ~$97,000, naturally that area would be major resistance and so a huge amount of Stop Losses were placed there, price swept that supply zone wiping out SL and SFP back under the resistance zone, a textbook move.
An accumulation under the resistance area would be a sign that the bulls are building to flip the zone, however a gradual sell-off from here would then look like a HTF lower high, a very bearish pattern.
Going into the FED interest rate decision there is usually a lot of de-risking/ sidelining from traders until the decision is made, therefor the second half of the week would give us more directional information.

Bitcoin (BTC) Analysis – Will the Rally Continue or Is a CorrectBitcoin is currently trading at $94,500 💰, but statistical studies and mathematical models indicate a potential downward movement 📉 that could push the price toward $93,800, with a strong likelihood of testing the $89,900 zone.
🛡️ Critical Support at $89,000
To maintain the long-term bullish trend, it is crucial that Bitcoin holds above the $89,000 support level. If the price closes below this level for an entire week, it would be a clear negative signal ❌ and could suggest a trend reversal to the downside for a longer period before any renewed upward movement.
✅ When Does the Correction End?
According to statistical studies and mathematical models, the clearest signal that the current correction has ended would be a break above $97,650 followed by three consecutive daily closes above this level 📈.
If this scenario plays out, we could see a strong and rapid surge toward the following targets:
🎯 Target 1: $104,900
🎯 Target 2: $112,900
💡 Investor Advice
If the breakout occurs, it is advisable to take profits 💸 at the mentioned targets and avoid entering new positions until further notice. The market could experience dramatic and swift movements ⚡, so caution is essential.
📢 The analysis will be updated upon reaching these levels to provide a clearer outlook based on price behavior at that time.
Would you like this version formatted for social media, blog post, or perhaps exported as a PDF or presentation slide?

Bitcoin MAsAfter a good rally bitcoin had 2 weeks age, now still managing and staying above 20MA for weekly, which is really bullish to me

Bitcoin - Bitcoin on the Road to $100,000?!Bitcoin is in its descending channel on the four-hour timeframe, between EMA50 and EMA200. If Bitcoin moves downward towards the specified demand zone, we can look for its next buying opportunities.
It should be noted that there is a possibility of heavy fluctuations and shadows due to the movement of whales in the market and compliance with capital management in the cryptocurrency market will be more important. If the downward trend continues, we can buy in the demand range.
In April, Bitcoin recorded a growth of 14.7%, successfully rebounding from a sharp early-month decline that had dragged its price down to $74,901. This level marks Bitcoin’s lowest price point in 2025 so far.
U.S. President Donald Trump, in an interview with NBC News, responded to growing concerns about a possible economic recession by saying that everything would be “fine.” He referred to the current phase as a “transitional period” and expressed confidence that the U.S. economy would perform “extraordinarily well.” When asked directly if he feared a recession, Trump replied, “No,” though he added, “Anything is possible, but I believe we are headed toward having the greatest economy in our nation’s history.”
On the other hand, Ethereum ended April with a 1.58% decline—marking its fifth consecutive month of losses. Over the past year, Ethereum has only seen gains in three months, and it is currently down 36.7% compared to the same period last year.
Strategy, formerly known as MicroStrategy, announced its intention to invest up to $84 billion in Bitcoin. The funds will be raised evenly through stock issuance ($42 billion) and debt securities ($42 billion).
In the first quarter of 2025, Strategy reported a profit of $5.8 billion from its Bitcoin investments, achieving a return of 13.7%. The company has also raised its annual targets, increasing its projected Bitcoin return from 15% to 25% and its dollar profit goal from $10 billion to $15 billion.Meanwhile, the short-term holder profit/loss ratio for Bitcoin has returned to a neutral level of 1.0, indicating balance between coins held at a profit and those at a loss. Historically, this level has often served as resistance during bearish phases. If prices remain above this point, it could signal strengthening momentum and a potential market recovery.
Elsewhere, reports indicate that Apple has violated a previous antitrust ruling by continuing to restrict users from accessing alternative payment methods outside of the App Store. The decision, issued by Judge Yvonne Gonzalez Rogers, now requires Apple to allow apps—including those related to crypto and NFTs—to operate without paying fees or seeking special approval. This ruling immediately strips Apple of its ability to collect commissions on out-of-app purchases and prohibits the company from monitoring or tracking such transactions.
