Bitcoin H4 | Potential bullish bounceBitcoin (BTC/USD) is falling towards a swing-low support and could potentially bounce off this level to climb higher.
Buy entry is at 91,933.60 which is a swing-low support that aligns close to the 23.6% Fibonacci retracement.
Stop loss is at 87,400.00 which is a level that lies underneath a pullback support.
Take profit is at 99,342.60 which is a swing-high resistance.
High Risk Investment Warning
Trading Forex/CFDs on margin carries a high level of risk and may not be suitable for all investors. Leverage can work against you.
Stratos Markets Limited (tradu.com):
CFDs are complex instruments and come with a high risk of losing money rapidly due to leverage. 63% of retail investor accounts lose money when trading CFDs with this provider. You should consider whether you understand how CFDs work and whether you can afford to take the high risk of losing your money.
Stratos Europe Ltd (tradu.com):
CFDs are complex instruments and come with a high risk of losing money rapidly due to leverage. 63% of retail investor accounts lose money when trading CFDs with this provider. You should consider whether you understand how CFDs work and whether you can afford to take the high risk of losing your money.
Stratos Global LLC (tradu.com):
Losses can exceed deposits.
Please be advised that the information presented on TradingView is provided to Tradu (‘Company’, ‘we’) by a third-party provider (‘TFA Global Pte Ltd’). Please be reminded that you are solely responsible for the trading decisions on your account. There is a very high degree of risk involved in trading. Any information and/or content is intended entirely for research, educational and informational purposes only and does not constitute investment or consultation advice or investment strategy. The information is not tailored to the investment needs of any specific person and therefore does not involve a consideration of any of the investment objectives, financial situation or needs of any viewer that may receive it. Kindly also note that past performance is not a reliable indicator of future results. Actual results may differ materially from those anticipated in forward-looking or past performance statements. We assume no liability as to the accuracy or completeness of any of the information and/or content provided herein and the Company cannot be held responsible for any omission, mistake nor for any loss or damage including without limitation to any loss of profit which may arise from reliance on any information supplied by TFA Global Pte Ltd.
The speaker(s) is neither an employee, agent nor representative of Tradu and is therefore acting independently. The opinions given are their own, constitute general market commentary, and do not constitute the opinion or advice of Tradu or any form of personal or investment advice. Tradu neither endorses nor guarantees offerings of third-party speakers, nor is Tradu responsible for the content, veracity or opinions of third-party speakers, presenters or participants.
1-BTCUSD

BTC on high time frame
"Hello, focusing on BTC on high time frames, the price has pulled back to a significant zone around $75,000 and is currently showing bullish momentum. The next target appears to be the 4-hour order block located at $98,000."
If you need further assistance or have any specific questions, feel free to ask!

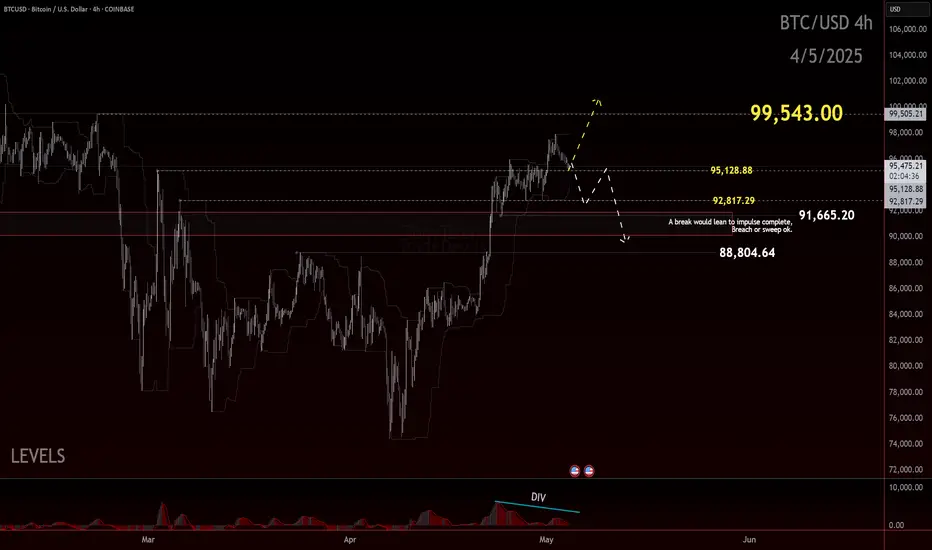
Bitcoin Technical AnalysisFenzoFx— Bitcoin began consolidating after peaking at $98,000, dipping toward the $93,565 support and now trading slightly above it. The Stochastic Oscillator sits below 25, suggesting BTC is oversold and may rebound.
Immediate support lies at $92,565. If this level holds, the uptrend could resume, targeting $98,000, with potential to push toward the $99,560 resistance if buying pressure increases.
Bearish Scenario: A drop below $91,720 would invalidate the bullish outlook, potentially extending the decline to $88,830.
>>> Prop Trading
>>> No Deposit Bonus
>>> %100 Deposit Bonus
>>> Forex Analysis Contest
All at FenzoFx Decentralized Forex Broker

Bitcoin: holds, but slowing downThere are two major events which marked the previous week. One is related to the Chinese government, which openly noted that they are considering entering into negotiations with the US Administration regarding the ongoing “trade war”, noting the absurdity of the currently imposed tax of 145% on Chinese goods and 125% on goods imported from the US. The other news was related to the US macro data and stronger than expected jobs data posted during the previous week. The market was relieved that the US economy is obviously not entering into recession, which was their worst fear during the previous period. All these, currently positive news supported optimism on financial markets, including the riskier assets, like BTC.
The price of BTC continues to move toward the higher grounds during the week. The highest weekly level was reached on Friday, after the jobs report, at the level of $97,8K. The price eased a bit during the Saturdays trading session, currently trading around $96,2K. The RSI continues to move close to the overbought market side, ending the week around the level of 67. This would be usually a clear signal in technical analysis that the potential reversal is coming, however, at this moment it might happen only if strong demand is put on a halt. Moving averages of 50 and 200 days are currently moving as two parallel lines with an uptrend.
The volatility might continue also during the week ahead. It should be strongly considered that the FOMC meeting is scheduled for May 6-7, where Fed officials will decide on the course on interest rates. What the market is currently expecting to hear from Fed Chair Powell is the Fed's view on the potential negative consequences of imposed trade tariffs. This might have a strong implication on investors sentiment and bring back volatility on the market. At this point, BTC is slowing down. Whether this is only temporary, will be much clearer during the week ahead. As per current charts, the level of $ 98K is the next historically significant resistance line. There is some potential that the BTC might try to test this level in the coming period. However, if the market turns to the down side, then the $95K might be the next level, on its road toward the $92K.

Bitcoin Price Action Analysis – Bearish Correction Toward DemandHello Guys!
Let's analyze btc!
Rising Trendline Break: The bullish structure has broken down as the price failed to hold above the key support region around $96,000–$96,200.
Targeted Demand Zone: The highlighted purple box between $94,200 and $94,700 represents a demand zone that has previously shown strong buyer interest. The current structure suggests Bitcoin may revisit this zone for a potential bounce.
Bearish Momentum: A large arrow indicates the directional bias toward the downside, aligning with the correction and market sentiment.
Fake RSI Divergence: The RSI panel indicates a “Fake Divergence” pattern, which may have misled early bulls. RSI has since dropped and currently hovers in the neutral zone, with no strong bullish signals yet.
_____________________________
Conclusion:
Unless a strong bounce occurs around current levels, Bitcoin looks poised to correct further toward the $94,200–$94,700 demand zone. Traders should watch for reactionary price action and bullish reversal patterns before considering long entries.

Market Overview (May 5, 2025)
📊 Key Metrics
1. Funding Rate: -0.0024% (on Binance)
— traders are paying to hold short positions, signaling bearish pressure
2. Open Interest (OI): $27.5B, down –3.13% in 24h
— positions are closing, possibly due to liquidations or profit-taking
3. ETF Inflows: +$674.9M (on May 2)
— strong institutional demand, especially into BlackRock’s IBIT
4. Fear & Greed Index: 52 (Neutral)
— sentiment has stabilized after a period of greed
⸻
📈 Market Movement Probability
• Upward: 55%
(potential short squeeze fueled by ETF inflows)
• Downward: 45%
(OI is dropping, market losing momentum)
⸻
Disclaimer: This information is not financial advice and should not be used as the sole basis for investment decisions.

BTCUSD/BITCOIN | M30 | SELL LIMIT ORDERHey There,
I'm currently waiting for the level I've targeted to enter a sell position on Bitcoin.
I've shared the exact entry level with you below.
Just a heads-up:
This trade carries high risk due to potential market manipulation.
Please trade cautiously and avoid taking on too much risk.
SIGNAL ALERT
SELL LIMIT ORDER (BTCUSD/BITCOIN) 97,000/97,500
🟢TP1:96,850
🟢TP2:96,654
🟢TP3:96,100
🔴SL: 98,390
Traders, your likes are always my biggest source of motivation for me to share analysis. For this reason, I would like to ask each and every one of my followers; please do not miss your likes.
I sincerely thank everyone who supports me with their likes.

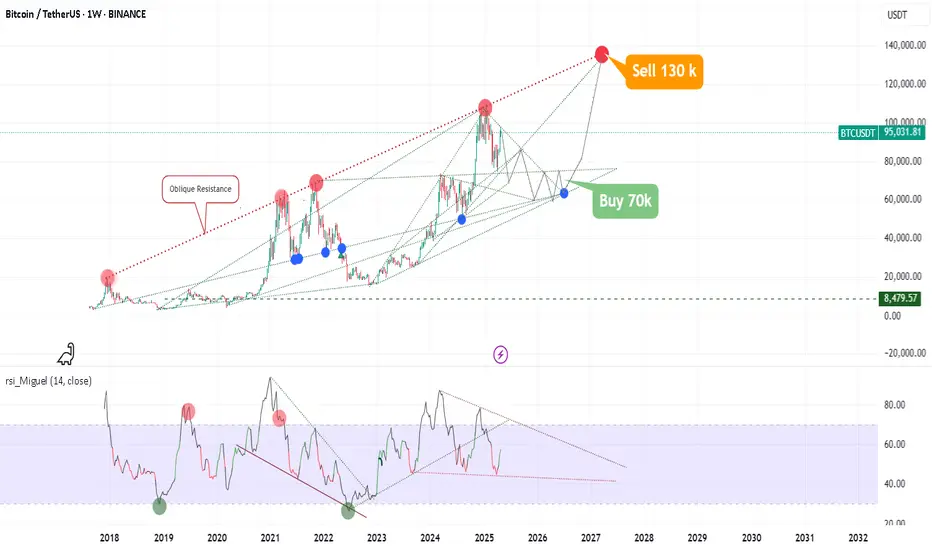
The worst-case scenario for Bitcoin📉 Potential Dip to $70,000 in 2026
Some analysts suggest that Bitcoin could experience a correction to around $70,000 in 2026. This potential downturn may be influenced by:
Market Cycles: Bitcoin's price has historically followed cyclical patterns, with periods of rapid growth followed by corrections.
Regulatory Changes: Shifts in global regulatory stances toward cryptocurrencies could impact investor sentiment and market dynamics.
Macroeconomic Factors: Economic events, such as changes in interest rates or geopolitical tensions, could influence risk appetite among investors.
It's important to note that while a dip to $70,000 is within the realm of possibility, other forecasts for 2026 are more optimistic. For instance, CoinCodex projects Bitcoin trading between $94,836 and $160,074 in 2026, with an average price of $119,743 .
🚀 Surge to Over $130,000 in 2027
Looking ahead to 2027, several factors could contribute to a significant increase in Bitcoin's price:
Institutional Adoption: Growing interest from institutional investors could drive demand.
Technological Advancements: Improvements in blockchain technology and scalability solutions may enhance Bitcoin's utility.
Global Economic Conditions: In times of economic uncertainty, Bitcoin is often viewed as a hedge against inflation.
Analysts have provided various projections for 2027:
Binance forecasts a price range between $140,491 and $216,738, with an average of $170,100 .
Bittime estimates an average price of $138,000, with potential highs up to $150,000
Ratio Charts in TradingView and IAAbove you can see the Bitcoin to Ethereum ratio chart. Ratio analysis between two or more symbols is a critical method for comparing the strength and weakness of assets relative to each other. TradingView offers basic capabilities for this task, but with the help of artificial intelligence (AI) and custom scripts, much more advanced and creative analyses can be conducted.
Here are some practical ideas:
1. Creating Conditional Ratio Scripts
2. Comparing Relative Averages and Issuing Smart Signals
3. Calculating Composite Ratios of Multiple Assets
4. Smart Alerts Based on Price Pattern Breakouts
For more information, search Google for "How to Use Ratio Charts in TradingView: A Hidden Gem for Traders."

2 options but both are bullish!CRYPTOCAP:BTC is consolidating but wants to make a next leg next week. Or we break out out of the falling wedge or after some more consolidation in the ascending wedge.
either way bullish!!!

BTC: Balancing on the EdgeBitcoin held the $90.5K level and managed to flip prior resistance into support—an encouraging development, especially given how close price was hovering to the so-called danger zone. That flip marked a technical win for bulls, signaling potential strength in the short-term structure.
However, we’re not entirely out of the woods just yet.
While price is holding above support and showing some resilience, we’re still trading uncomfortably close to the edge of the recent consolidation zone. For now, $91.5K stands as the ideal level to hold.
The concern? If price starts slipping back below this newly established support, especially with conviction, that could be a signal of deeper retracement on the table. The bullish narrative would weaken significantly if we revisit and fail to defend those levels, potentially opening the door for a more sustained correction.
So, while the short-term structure remains cautiously optimistic, this isn’t the time for complacency. The market’s still in a precarious spot, and clarity will only come with either continued strength—or a confirmed break below support.
Eyes on $91.5K for now. Hold that, and the momentum favors the bulls. Lose it, and the deeper pullback scenario comes back into play.
Trade Safe, Trade Clarity.
multiple positive factorsDriven by multiple positive factors, including institutional funds inflow, the halving cycle, and the development of the Middle East market, as well as a breakthrough in the technical aspects, Bitcoin has a relatively high probability of surging towards the $100,000 mark in May.
Trading Strategy:
buy@94500-95500
TP:97500-98500

AI BTC Prediction Next 24–48 Hours !May 3, 2025, 11:13 pm. BTC/USD. BTC/USD Trading Plan
Timeframe: Next 24–48 Hours
Long Scenario
- Entry: 96,550 (confirmed close above 96,500 with rising volume + RSI > 50).
- SL: 95,700 (below immediate support 95,800).
- TP: 96,800 (below resistance 97,000).
- Trailing Stop: 1.5x ATR (~162 pips) after surpassing 96,800.
- Confirmation: MACD histogram reversal + Bollinger Band breakout above midline.
Short Scenario
- Entry: 95,750 (confirmed close below 95,800 with rising volume + RSI < 40).
- SL: 96,600 (above resistance 96,500).
- TP: 95,200 (above support 95,000).
- Trailing Stop: 1x ATR (~108 pips) after breaking 95,500.
- Confirmation: Supertrend remains bearish + EMA crossover downward.

“BTC 4H Chart: Eye on $91,247 Support After Local Resistance”The BTCUSDT 4H chart shows a strong uptrend, but price is now facing resistance. If the trendline breaks, the $91,000 support zone becomes a key level to watch. Is this just a pullback or the start of a bigger correction?
🔍 Key Levels:
Resistance: $97,000
Support Zones: $95,000 & $91,000
Trendline Decision: Watch the 4H candle close for confirmation.
🧠 Strategy:
Wait for a pullback or go long on a confirmed bounce — both setups are possible. Follow price action closely and trade smart.

Eyes Fresh Upside Within Ascending Channel 📈🟢 BTCUSD Eyes Fresh Upside Within Ascending Channel 🚀💰
No time to wait for the open – this dip might already be the setup! 🔍
Bitcoin continues to respect the ascending channel, with the latest touch on the lower boundary lining up perfectly with the 95,568 zone. Historically, each visit to this trendline has produced a strong bounce – and we can see it clearly through the green arrows across the chart.
As of now, price is holding just above the key support at 95,120, and unless we see a strong break below that level (with confirmation below 94,806), this looks like another textbook “buy the dip” scenario. 🛒
Upside targets remain:
🔹 97,432 – mid-channel resistance
🔹 99,161 – channel top, potential exhaustion zone
I’ll be watching for a minor pullback or consolidation (as shown), but I’m not waiting on the sidelines for the open – structure supports continuation. Don’t fight the trend when the channel is this clean. 📊
Key support levels to monitor on downside invalidation:
⚠️ 94,806
⚠️ 94,120
⚠️ 93,806
⚠️ 92,709 (channel invalidation below here)
Stick to structure, trust the levels, and respect the momentum. And if we end up under the channel remember it becomes resistance. Long ONLY over 95600 here.
One Love,
The FXPROFESSOR 💙

BTCUSD: Expecting Bearish Continuation! Here is Why:
Looking at the chart of BTCUSD right now we are seeing some interesting price action on the lower timeframes. Thus a local move down seems to be quite likely.
Disclosure: I am part of Trade Nation's Influencer program and receive a monthly fee for using their TradingView charts in my analysis.
❤️ Please, support our work with like & comment! ❤️
