BTC v DXY📊 Updated Analysis: BTC vs DXY
🔺 BTC Chart (Top Panel)
Price is near previous ATH resistance (~$110k).
Momentum is slowing as shown by the bearish divergence on RSI (RSI trending lower while price stays flat or rises).
However, BTC has not broken down; it’s still in consolidation near highs — not rejection.
🔻 DXY Chart (Bottom Panel)
DXY had a mini rally from ~100 to ~110 but is now pulling back slightly.
If DXY forms a lower high and breaks down, that would typically support a BTC rally.
If DXY resumes strength, BTC may consolidate longer or correct.
🧠 Can BTC Sustain a Multi-Year Bull Run with DXY in View?
Yes — if DXY weakens.
🟢 Bull Run Case:
If DXY breaks below 100, this could trigger a major capital rotation into risk assets, including BTC.
BTC above $112k with falling DXY = probable start of a parabolic rally (think $150k+).
🔴 Bearish Risk:
If DXY finds strong support (~98–100) and begins rallying again, especially beyond 110–112, BTC could enter a mid-cycle correction.
🔭 Watch These Levels:
BTC: Break/close above $112k = bull continuation. Breakdown below ~$85k = caution.
DXY: Close below 100 = major BTC bullish signal. Close above 112 = danger zone for crypto.
1-BTCUSD

TESLA PRICE ACTION JUNE 5TH 2025Welcome to Tesla weekly &there is a news about Elon going against the bill from trump.
I will never buy their news as they are manipulating retailers.
I am buying & I have discussed all the important levels here,
If you have any doubts, feel free to leave your comments here.

Bitcoin Breaks below $102,500 Support : Watch For RejectionIf you have been following my research on Bitcoin, you already know I published a prediction of a Double-Top pattern and a potential breakdown in Bitcoin on May 20, 2025.
TradingView selected this video as an Editor's Pick and it received thousands of views.
Thank you for all the great comments and questions from everyone.
Now, after about 3+ Weeks, we are starting to see BTCUSD move below my $102,500 support level (my breakdown level) and this could be the start of a broad downward price phase for BTCUSD and US/Global assets.
If you have followed any of my longer-term research, you'll quickly understand why I believe the US markets will struggle through most of 2025 as the world attempts to adjust to Trump leadership. This uncertainty will likely result in a sideways-consolidation phase in many global markets and a disruption of hard and soft assets.
In this regard, you can read the content of my original post (May 20).
Right now, I want to warn you that an immediate price rejection of the breakdown move is likely - possibly targeting $105k or higher.
This type of rejection is very common before price makes a much bigger move. So, be prepared for BTCUSD to attempt to reject and move back above $105k, then stall and break downward very hard - trying to move below $80k in an initial downward price phase.
It's going to be very interesting to see how this plays out with my broad cycle research. I'm still expecting a July 2025 and October 2025 MAJOR LOW cycle phase to play out.
Buckle up.
Get some
#trading #research #investing #tradingalgos #tradingsignals #cycles #fibonacci #elliotwave #modelingsystems #stocks #bitcoin #btcusd #cryptos #spy #gold #nq #investing #trading #spytrading #spymarket #tradingmarket #stockmarket #silver

Bitcoin H4 | Bearish downtrend to extend deeper?Bitcoin (BTC/USD) is rising towards a pullback resistance and could potentially reverse off this level to drop lower.
Sell entry is at 103,881.70 which is a pullback resistance that aligns close to the 38.2% Fibonacci retracement.
Stop loss is at 107,800.00 which is a level that sits above the 61.8% Fibonacci retracement and a pullback resistance.
Take profit is at 97,490.00 which is a pullback support that aligns with the 78.6% Fibonacci retracement.
High Risk Investment Warning
Trading Forex/CFDs on margin carries a high level of risk and may not be suitable for all investors. Leverage can work against you.
Stratos Markets Limited (tradu.com ):
CFDs are complex instruments and come with a high risk of losing money rapidly due to leverage. 63% of retail investor accounts lose money when trading CFDs with this provider. You should consider whether you understand how CFDs work and whether you can afford to take the high risk of losing your money.
Stratos Europe Ltd (tradu.com ):
CFDs are complex instruments and come with a high risk of losing money rapidly due to leverage. 63% of retail investor accounts lose money when trading CFDs with this provider. You should consider whether you understand how CFDs work and whether you can afford to take the high risk of losing your money.
Stratos Global LLC (tradu.com ):
Losses can exceed deposits.
Please be advised that the information presented on TradingView is provided to Tradu (‘Company’, ‘we’) by a third-party provider (‘TFA Global Pte Ltd’). Please be reminded that you are solely responsible for the trading decisions on your account. There is a very high degree of risk involved in trading. Any information and/or content is intended entirely for research, educational and informational purposes only and does not constitute investment or consultation advice or investment strategy. The information is not tailored to the investment needs of any specific person and therefore does not involve a consideration of any of the investment objectives, financial situation or needs of any viewer that may receive it. Kindly also note that past performance is not a reliable indicator of future results. Actual results may differ materially from those anticipated in forward-looking or past performance statements. We assume no liability as to the accuracy or completeness of any of the information and/or content provided herein and the Company cannot be held responsible for any omission, mistake nor for any loss or damage including without limitation to any loss of profit which may arise from reliance on any information supplied by TFA Global Pte Ltd.
The speaker(s) is neither an employee, agent nor representative of Tradu and is therefore acting independently. The opinions given are their own, constitute general market commentary, and do not constitute the opinion or advice of Tradu or any form of personal or investment advice. Tradu neither endorses nor guarantees offerings of third-party speakers, nor is Tradu responsible for the content, veracity or opinions of third-party speakers, presenters or participants.

Current Bitcoin Analysis! What Can Investors Expect in the CominBitcoin is trying to find support at 103K levels. We are likely to see a move until our previous support is now in the green. As long as 103K is maintained, 105.8. - It will want to rise up to the 105K range.
If a short confirmation structure is formed when it reaches the specified green area, the short idea can be evaluated up to 100K levels. When it comes to the green area in the analysis, it should be monitored closely. If the price moves to the red zone, short confirmation structures can be evaluated.
If Bitcoin resumes its downward movement from the red zone, the bearish target will be the blue lines in the analysis.
Not Investment Advice.

BTCUSD CRACKing Everywhere!As I have been warning for a while now. See previous post.
I first warned to wait for the CRACK!
Then we got the 2nd CRACK!, very normal.
Then a nice M pattern with a lower high.
Then another CRACK!
And now a right Shoulder.
MAGIC!
Now we wait for the H&S to break down.
Click boost, follow, and subscribe for more. Let's get to 5,000 followers. ))

TOTAL Crypto Market. Games with the 800-Pound Gorilla. Series IIOver the 4 months since Donald Trump’s inauguration in January 2025, his administration’s policies have had a complex and in many ways negative impact on cryptocurrency markets, despite the overall pro-crypto agenda.
Short-Term Market Volatility Due to Tariff Policy
One of the most significant negative impacts has been caused by Trump’s aggressive tariff policy. The announcement and subsequent implementation of new tariffs sent shock waves through global financial markets, including cryptocurrencies.
The immediate effect has been increased volatility, with Bitcoin down a third from its highs, Ethereum and many other major coins also falling by more than half, and crypto futures seeing liquidations of over $450 million in a single day.
This turbulence was not isolated — experts noted that broader “risk aversion,” in which investors flee volatile assets for safer havens like gold, led to sharp declines in both the stock and crypto markets.
Uncertainty around tariffs — particularly reciprocal tariffs affecting up to 25 countries — created short-term headwinds for cryptocurrencies. As institutional and foreign investors pulled billions out of U.S. stocks, the resulting market volatility spilled over to cryptocurrency, which remains closely tied to tech indexes like the NASDAQ. This risk aversion delayed potential rallies and led to a volatile, unpredictable trading environment.
Regulatory Rollbacks and Market Integrity Concerns
The Trump administration has aggressively rolled back regulatory oversight in an attempt to create a more crypto-friendly environment. Key steps include disbanding the Justice Department’s National Cryptocurrency Enforcement Team (NCET), appointing pro-crypto officials to regulatory bodies, and directing agencies to streamline or repeal existing crypto regulations. While these actions have reduced the compliance burden on crypto businesses and spurred innovation, they have also raised serious concerns about the integrity of the market.
Critics argue that loosening oversight increases the risks of money laundering, fraud, and illegal transactions, which could undermine investor protections and the overall reputation of U.S. crypto markets.
Consumer advocacy groups warn that rapid deregulation could encourage abuse and undermine trust, especially since the Trump administration has also banned the development of a U.S. central bank digital currency (CBDC), setting the U.S. apart from other major economies pursuing digital currency initiatives.
Conflicts of Interest and Ethical Controversies
Another negative impact has been the perception — if not the reality — of conflicts of interest and ethical dilemmas. The Trump family’s direct involvement in crypto projects, including the launch of a stablecoin and investments in mining, has fueled suspicions of market manipulation and blurred the lines between personal and presidential interests.
Such controversies have further undermined investor confidence and contributed to a sense of unpredictability in regulatory and market outcomes.
Summary Table: Key Negative Impacts
Policy/Action =>> Negative impact on crypto markets
Rising Tariffs and Trade Uncertainty =>> Increased volatility, risk aversion, falling prices.
Regulatory Rollbacks/NCET Dissolution =>> Weakened oversight, higher risk of fraud and abuse.
CBDC Development Ban =>> US Lagging Global Digital Currency Innovation
Trump Family’s Direct Involvement in Crypto =>> Alleged Conflicts of Interest, Market Manipulation Concerns.
Technical Challenge
The technical picture in the main crypto market cap chart CRYPTOCAP:TOTAL points to the end of the recovery period, reaching a key resistance near the $3.5 trillion mark.
Conclusion
While the Trump administration has promoted a more liberal environment for crypto innovation, the last four months have seen significant negative effects: increased market volatility due to tariff policy, increased risk due to deregulation, and growing concerns about conflicts of interest.
These factors have combined to create an atmosphere of uncertainty and skepticism, which is undermining the stability and trust in the US crypto markets in the short term.
--
Best wishes,
@PandorraResearch Team 😎

BITCOIN Risky Long! Buy!
Hello,Traders!
BITCOIN keeps falling down
And the coin is almost 9%
Down from the recent highs
So BTC is oversold and
After it hits a horizontal
Support of 100,800$
We will be expecting a
Local rebound and a move up
Buy!
Comment and subscribe to help us grow!
Check out other forecasts below too!
Disclosure: I am part of Trade Nation's Influencer program and receive a monthly fee for using their TradingView charts in my analysis.

BTC: Facing Resistance?Bitcoin recently encountered renewed selling pressure, stalling the anticipated continuation of green wave B. Under the primary scenario, this corrective upward movement should still extend into the upper blue Target Zone between $117,553 and $130,891, where the price is expected to reverse and initiate green wave C. That move should complete with a low in the lower blue Target Zone between $62,395 and $51,323, thereby finalizing orange wave a. Following a corrective advance in wave b, the larger wave (ii) should reach its conclusion. There remains a 30% probability for the alternative scenario, in which BTC pushes above the upper blue Target Zone, establishing a new high in blue wave alt.(i)— which would delay the expected pullback.
📈 Over 190 precise analyses, clear entry points, and defined Target Zones - that's what we do.

BTC/USDTThe only re-entry I would consider as great in terms of risk reward is the region of 99-100k if market allows to visit. Orders are placed accordingly. In the meantime holding all positions since 77k re-entry.

BTCUSD in a consolidation phase!BTCUSD is moving in a range between 104K- 107K approximately. It is well above bull market support band and could get some correction before another rally.
BTCUSD Longs on a weekly time frame are going down which means that chances of BTCUSDT going up are good. Currently BTCUSD Longs are on a support level and I'd wait till it breaks the level of 46372.
USDT.D is overall in a bearish trend but retracing a little bit. A bullish divergence was formed but later a hidden bearish divergence also formed. So now we should wait till it confirms its bearish trend again.
BTCUSD once it gets a little bit of further correction by looking at BTCUSD Longs and USDT.D charts analysis, and retraces to a fib level of 0.5 at 102615, I would enter in a long position with half of the risk and once it retraces back to 0.618 at 100452, I would enter in a long position with rest of the half for DCA.
Initial target levels would be based on trend based fib-extension levels of 0.786 at 119049.

BTC USDTBitcoin is testing key support around $103K. A breakdown below this zone could open the door to sub-$100K levels. Watch closely!

BTC/USDT.P Rejection Confirmed? Eyeing Breakdown Toward 50% FibBitcoin just lost two critical levels in rapid succession:
1️⃣ Value Area High ($106,331)
2️⃣ Previous Monthly High ($105,000)
We’re now closing candles back inside prior structure, showing signs of weakness and potential distribution at the highs.
📉 The Bearish Setup
Price is hovering above the 0.236 retracement. A break and daily close below this level could complete what looks to be the right shoulder of a developing head and shoulders pattern. The distance from head to neckline lines up with a projected move down toward the 50% Fibonacci level ($91,500) — which also aligns closely with the POC ($96,888) as an intermediate stop.
🎯 Targets:
• Neckline/Break Level: $102,800
• Mid-Target (POC): $96,888
• Main Target (0.5 Fib): $91,500
• Confluence zone lower: 0.618 to 0.68 (watch for reversals)
🧠 Context Notes:
• The current 2-leg rejection (~8% each) gives symmetry to the pattern
• High volume nodes around POC could act as reaction areas
• This short setup remains valid while price is closing below ~105k and failing to reclaim VAH
If this structure plays out, it’s a classic example of a failed breakout turning into a strong breakdown — the kind of move that catches late bulls off guard.

HolderStat┆BTCUSD pennant pauseCRYPTOCAP:BTC cools under 106 k inside a narrowing pennant pinned to its long-term rising rail. Successive ascending consolidation triangles hint at continuation, projecting a thrust toward the 111 k resistance shelf. Holding the pattern’s base keeps breakout odds tilted north.

btc on selling#BTCUSD price have recorrect above 105600 showing bullish range, now we need price to fall to cover the projection.
Sell Below 105545, take profit 103555, Stop loss 106360.
Possible closure on current H1 above 106360 will break the next zone 106900-107200.

SPY/QQQ Plan Your Trade For 6-5 : Inside BreakawayToday's SPY Cycle Pattern is an Inside Breakaway pattern - which indicates the markets want to try to break away from the sideways range I've been sharing with you.
Gold and Silver are making a very big move higher this morning - which may be indicative of some crisis or military conflict move throughout the world.
I see this move in Metals as a bit of a warning to the global markets. Metals hedge global risk levels. A rise in metals suggests traders fear some crisis event and are banking on Silver/Gold as an efficient hedge.
BTCUSD is still trading within the sideways channel as well. I see BTCUSD less as a hedge and more as a technology/Block-chain asset. No matter how you slice it, BTCUSD is not really an alternate currency, it is a Technology asset.
We could see some big moves over the next 2-5+ days because of how the markets are setting up and how Gold/Silver are reacting.
Buckle Up.
Get Some.
#trading #research #investing #tradingalgos #tradingsignals #cycles #fibonacci #elliotwave #modelingsystems #stocks #bitcoin #btcusd #cryptos #spy #gold #nq #investing #trading #spytrading #spymarket #tradingmarket #stockmarket #silver

BITCOIN under brutal 4H squeeze. Buyers or sellers will prevail?Bitcoin (BTCUSD) is currently under the strongest squeeze we've seen this year as it's being compressed between the 4H MA50 (blue trend-line) and 4H MA200 (orange trend-line). Such tight price action usual precedes explosive moves.
Technically two patterns prevail: a long-term Channel Up and a short-term Head and Shoulders (H&S). Naturally, as long as the Channel Up holds (and is still valid), the pattern will attempt to push the price to he 2.0 Fibonacci extension at $121500 (and higher). If on the other hand it breaks (4H MA200 would be an early signal), the H&S may push the price to the -1.0 Fibonacci extension at $95000.
So what do you think? Which pattern will prevail? Feel free to let us know in the comments section below!
-------------------------------------------------------------------------------
** Please LIKE 👍, FOLLOW ✅, SHARE 🙌 and COMMENT ✍ if you enjoy this idea! Also share your ideas and charts in the comments section below! This is best way to keep it relevant, support us, keep the content here free and allow the idea to reach as many people as possible. **
-------------------------------------------------------------------------------
💸💸💸💸💸💸
👇 👇 👇 👇 👇 👇

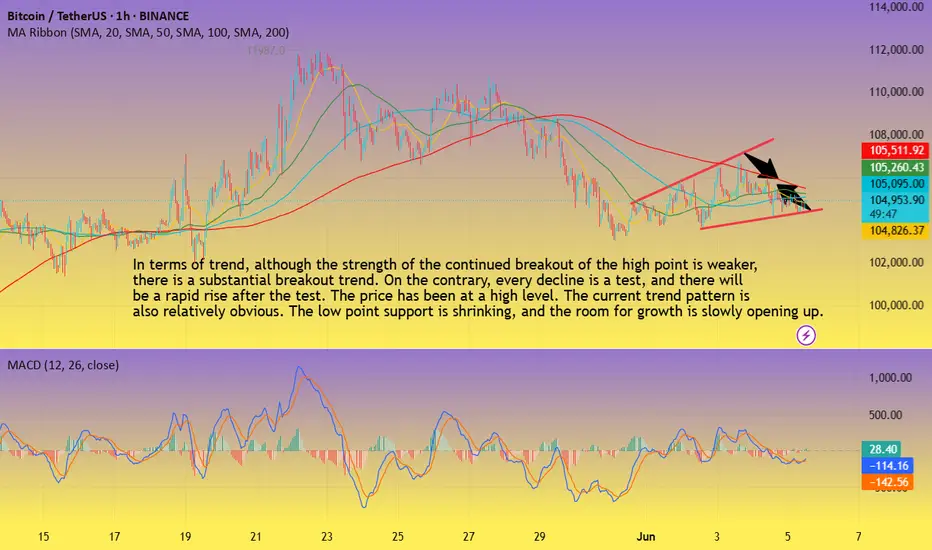
BTC-----Buy around 104800, target 106000 areaTechnical analysis of BTC contract on June 5:
Today, the large-cycle daily line level closed with a small positive line yesterday. The K-line pattern has continuous positive and negative lines, but if we look carefully, we will find that the price has been at a high level, and every retracement trend is testing support, and the rise is breaking the high, although it has not continued, so in this case, it is still very easy to pull up and break; the short-cycle hourly chart price is oscillating in a small range, and the upward channel is slowly opening in the trend pattern, and the support for the decline is moving up. This is relatively clear. The current K-line pattern is continuous positive, and the attached indicator is golden fork, so there is a high probability of rising during the day. Whether the European session can break the high is to focus on.
BTC short-term contract trading strategy:
The current price is more in the 1048000 area, the stop loss is in the 1043000 area, and the target is in the 106000 area;
$BTC 2025: The road to $444,000As predicted by @JoshMandell6 on X earlier this year, this chart is an entirely theoretical exercise (a pure hopium mind-burp if you will) to explore the remote possibility that a CRYPTOCAP:BTC price of $444K might even be achievable in any scenario. I simply drew a line from the Pi Cycle top in 2017/18, to the top in March 2021 and projected on to now (June 2025). I then marked off the $444K prediction made earlier this year by @JoshMandell6 (the yellow horizontal, dashed line). I then checked prior BTC cycles to see there are any examples where BTC was able to climb this distance within 2 monthly candles. Interestingly, if you take the last 2 monthly candles from the 2017/18 cycle (before and including the topping candle), it does line up pretty well. This suggests it is theoretically possible for BTC to reach $444k by August 1st 2025 - I know this is highly unlikely of course; but interesting all the same.
For additional context to this theory: the specific post I'm referring to was made by Josh Mandell (@JoshMandell6) on X (formerly Twitter) on November 5, 2024. In this post, Mandell presented a poetic prediction stating that Bitcoin would reach $84,000 on March 14, 2025, and subsequently surge to approximately $444,000. The prediction included symbolic phrases like “three four, times a thousand,” suggesting a target price of $444,000.
Mandell's forecast gained significant attention when Bitcoin indeed closed near $84,000 on March 14, 2025, aligning with his prediction. This accuracy bolstered his reputation, especially considering his background as a former trader at Salomon Brothers and Caxton Associates. He has also been transparent about his trading activities, publicly sharing his portfolio, which reportedly grew from $2.1 million to over $22 million by March 2025.
en.bitcoinsistemi.com
For a more in-depth understanding of Mandell's prediction and its implications, you might find this video insightful: youtu.be

DeGRAM | BTCUSD retesting the $105k📊 Technical Analysis
● Triple bounce at 104.8 k-105 k and the violet trend-line created fresh higher-lows while keeping price above the May demand block.
● A two-week falling trend-line has just been cleared and retested, unlocking the next pivot at 108 k; flag depth from 105 k projects to the 111.7 k supply/upper channel rail.
💡 Fundamental Analysis
● FXStreet highlights US job openings at a 3-yr low, pressuring yields, while CoinShares tracks another $450 m spot-ETF inflow and exchange balances at a 4-yr trough, signalling a tightening float.
✨ Summary
Buy 104.8-106 k; clearance of 107 k aims for 111 k, stretch 115 k. Long thesis void on a 2 h close < 103 k.
-------------------
Share your opinion in the comments and support the idea with a like. Thanks for your support!

STRAXUSDT Forming Falling Wedge STRAXUSDT is displaying a textbook falling wedge pattern on the daily chart, a formation widely recognized for its bullish reversal potential. After an explosive move upward earlier this quarter, the price has been consolidating in a downward-sloping wedge, tightening near a crucial support level. This type of market structure typically precedes a breakout, and the chart currently projects a potential move of 90% to 100% or more to the upside. This setup is attracting growing interest from traders and investors who understand the significance of wedge breakouts in crypto price action.
What adds conviction to this technical setup is the presence of solid volume activity. Despite the correction phase, there has been no major sell-off panic, which often suggests accumulation by smart money. As the pattern tightens and price volatility compresses, a breakout becomes increasingly likely. Once this breakout is confirmed with volume, STRAXUSDT could rally sharply, targeting the projected zone around $0.067 and beyond.
STRAX is not just any low-cap altcoin—it is backed by a strong legacy in blockchain infrastructure. As more developers and blockchain-based platforms seek scalability and integration, the utility of projects like STRAX may resurface with renewed momentum. With this kind of structural bullish setup and an improving sentiment across altcoins, STRAXUSDT presents a compelling case for a breakout trader or a short-term investor.
Traders watching STRAXUSDT should keep a close eye on breakout confirmation candles and volume spikes in the coming days. Risk-reward is highly favorable at this point in the wedge, making it a timely opportunity in the altcoin segment. The technicals align well with broader market optimism, setting the stage for a possible trend reversal and extended move higher.
✅ Show your support by hitting the like button and
✅ Leaving a comment below! (What is You opinion about this Coin)
Your feedback and engagement keep me inspired to share more insightful market analysis with you!

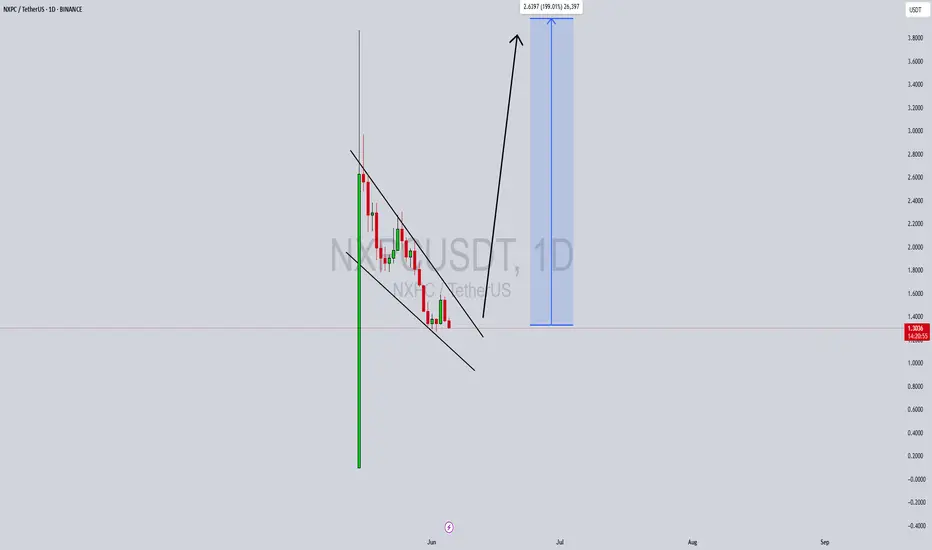
NXPCUSDT Forming Falling Wedge NXPCUSDT is currently exhibiting a classic falling wedge pattern on the daily timeframe—a pattern known for its bullish breakout potential. After a massive upward surge that brought strong attention to the pair, the price began a structured pullback within converging trendlines. This healthy correction, coupled with consistent buying interest, indicates a potential setup for another explosive move. The technical breakout projection signals a possible 190% to 200% upside from the current levels, making it one of the most promising altcoin setups in the short term.
The volume profile supports the bullish scenario, with a gradual reduction in sell pressure suggesting that sellers are exhausting. This kind of price action following a parabolic move is often seen as a base-building phase before another leg higher. The convergence near a key support zone only strengthens the likelihood of a breakout, attracting smart money and swing traders looking for early entries into high-reward positions.
NXPC has recently gained visibility due to its innovative approach and unique use cases in decentralized applications. As investor sentiment grows around low-cap, high-potential tokens, NXPC is becoming a serious contender among emerging altcoins. Coupled with its Binance listing, the project is attracting not only retail attention but also speculative volume from more experienced traders who recognize wedge breakouts as lucrative opportunities.
This chart setup, combined with rising fundamentals, makes NXPCUSDT one to watch very closely. If the wedge breaks out with strong volume confirmation, a rapid move toward the projected target range could unfold quickly. Timing the breakout with proper risk management can lead to exceptional gains in this type of market environment.
✅ Show your support by hitting the like button and
✅ Leaving a comment below! (What is You opinion about this Coin)
Your feedback and engagement keep me inspired to share more insightful market analysis with you!
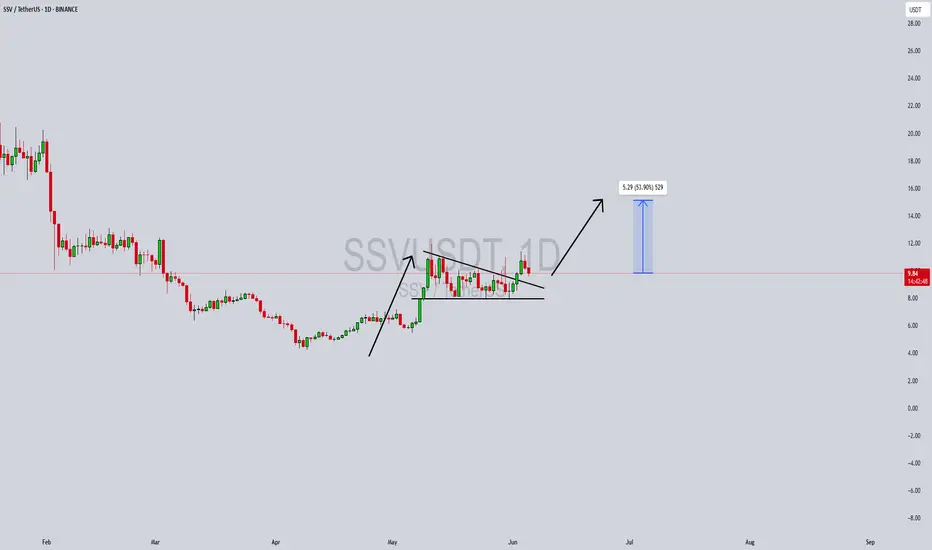
SSVUSDT Forming a Bullish PennantSSVUSDT is currently forming a bullish pennant pattern, which is typically a continuation formation that appears after a strong upward impulse. The pair recently experienced a significant breakout to the upside, followed by a consolidation phase forming a symmetrical triangle or pennant structure. With good volume maintaining support and bulls defending key levels, this setup is signaling that a strong breakout could be imminent.
SSV Network (SSV) plays a vital role in the Ethereum ecosystem by enabling decentralized staking infrastructure. As Ethereum’s staking market continues to grow, projects like SSV are drawing significant interest from investors due to their utility and real-world staking applications. With more ETH validators looking for secure and decentralized staking solutions, SSV is well-positioned for organic growth in the coming months.
The technicals support the bullish bias, with the chart projecting a potential 40% to 50% gain once price breaks out from the current consolidation zone. The bullish momentum building over the last few weeks, combined with strong investor sentiment and healthy volume, adds confidence to this projection. The breakout target aligns with prior resistance zones, making this a high-conviction setup for swing traders.
This pattern, in conjunction with the underlying fundamental strength of the SSV protocol, presents a compelling opportunity for traders watching altcoins with real utility. A successful breakout could attract more retail and institutional attention, especially as staking continues to trend in the broader crypto narrative.
✅ Show your support by hitting the like button and
✅ Leaving a comment below! (What is You opinion about this Coin)
Your feedback and engagement keep me inspired to share more insightful market analysis with you!