$PNUT/USDT Breakout Trade Setup$PNUT / USDT - Breakout Trade Setup.
Entry: $0.2963 - $0.3002
Stop Loss: $0.2682
Targets: $0.3603 / $0.4305 / $0.4891
Breakout & retest of descending trendline
60 %+ upside potential
DYOR | NFA
1-BTCUSD

Potential bearish drop?The Bitcoin (BTC/USD) is rising towards the pivot and could drop to the 61.8% Fibonacci support.
Pivot: 107,000.93
1st Support: 104,300.41
1st Resistance: 108,341.47
Risk Warning:
Trading Forex and CFDs carries a high level of risk to your capital and you should only trade with money you can afford to lose. Trading Forex and CFDs may not be suitable for all investors, so please ensure that you fully understand the risks involved and seek independent advice if necessary.
Disclaimer:
The above opinions given constitute general market commentary, and do not constitute the opinion or advice of IC Markets or any form of personal or investment advice.
Any opinions, news, research, analyses, prices, other information, or links to third-party sites contained on this website are provided on an "as-is" basis, are intended only to be informative, is not an advice nor a recommendation, nor research, or a record of our trading prices, or an offer of, or solicitation for a transaction in any financial instrument and thus should not be treated as such. The information provided does not involve any specific investment objectives, financial situation and needs of any specific person who may receive it. Please be aware, that past performance is not a reliable indicator of future performance and/or results. Past Performance or Forward-looking scenarios based upon the reasonable beliefs of the third-party provider are not a guarantee of future performance. Actual results may differ materially from those anticipated in forward-looking or past performance statements. IC Markets makes no representation or warranty and assumes no liability as to the accuracy or completeness of the information provided, nor any loss arising from any investment based on a recommendation, forecast or any information supplied by any third-party.

BTCUSD CRACKing Everywhere!As I have been warning for a while now. See previous post.
I first warned to wait for the CRACK!
Then we got the 2nd CRACK!, very normal.
Then a nice M pattern with a lower high.
Then another CRACK!
And now a right Shoulder.
MAGIC!
Now we wait for the H&S to break down.
Click boost, follow, and subscribe for more. Let's get to 5,000 followers. ))

BTCUSD: Can it repeat the U.S. elections rally?Bitcoin is on a slight pullback, being only marginally bullish on its 1D technical outlook (RSI = 56.024, MACD = 1611.500, ADX = 23.439). Based on the 1W RSI we may be on the October 30th - November 4th 2024 pullback that preceded the U.S. elections. The decisive test will be on the 1D MA50 again, but as long as the S1 level holds, chances are we will see a similar +106.40% rally. We remain bullish on BTC, TP = 150,000.
## If you like our free content follow our profile to get more daily ideas. ##
## Comments and likes are greatly appreciated. ##

BTCUSD: 4H Golden Cross kickstarting $119,000 rally.Bitcoin remains bullish on its 1D technical outlook (RSI = 58.982, MACD = 1643.700, ADX = 1643.700) despite today's high volatility. This volatility displays similar attributes to the Accumulation Phases that were formed since the April 7th bottom. If it follows the symmetry of the first two bullish waves around the first Accumulation Phase, expect a +10% rise from the Phase's bottom. Assuming today is the bottom, the next target of this pattern is 119,000.
## If you like our free content follow our profile to get more daily ideas. ##
## Comments and likes are greatly appreciated. ##


50x leverage no brainer short trade (easy profits)
Keep in mind:
With a big daily bearish engulfing candlestick we are most likely to continue the downtrend for the coming days. Looking at the RSI (daily timeframe) it is clear that we now are in a downtrend from previously being in overbought territory. We are most likely to go from overbought to oversold on the RSI and are now looking for a big downward movement! The MACD is showing weakness on the buy signal it has printed on the daily timeframe and is showing a strong sell signal on the 4 hourly timeframe.
Most important information:
Price action is the most important information you can get and trading on price action is what the pros do!
What we can see is that the price of BTC now is inside a strong key resistance area. Combining this with the huge rising wedge we are most likely to fall back down to the 75k area. Keep in mind that we didn’t really get a good backtest of the 69k-75k support zone so we could be looking to make a good backtest of this zone before continuing the macro uptrend.
I can also identify a failed bullish ascending triangle followed by a trend with lower highs. When the second lower high formed on the hourly I entered the 50x leverage trade at 108528,7 and placed the stop loss above that lower high. Keep in mind that the trend is your friend and that we most likely wont hit the SL. At least not before moving the SL into the profit zone (preferably above a lower high that will form). I have currently put my TP at 75950 (a long way down) because I want to ride this short as long as I possibly can. I also think that we are most likely to keep consolidating (until proven otherwise) between the given ranges (from 69k all the way up to 112k).
What about the news?
I think what president Trump does is the most important news we have to consider while trading. At the time of writing it is still unclear if the Musk VS Trump drama will continue. Bringing negativity into the market. The latest trade agreement with China was also not in favor of the United States (The relation between the two countries can strengthen but at a core financial view this ain’t good). Trump also kind of acted like a dictator in the Los Angeles event (this could bring negative energy into the markets). All in all I think that the news is a bit unstable and this strengthens the hypothesis that the price of BTC will consolidate until better times is around.
Conclusion:
I can always be wrong with either my complete analysis or parts of it. But I think that we at least is going to see a 1,65% move to the downside from my entry point. This move is extrapolated from the failed ascending triangle and seeing this move will give me the opportunity to make the trade risk free (I will keep you updated when this happens)!

BTC/USDTDo you think Bitcoin has just formed a double top, or is it showing a different pattern? Personally, I think we might range a bit from here and then possibly continue the uptrend. I'm not really into pattern trading—so you tell me, are we bullish or bearish?"

While they panic at 0.618, I loadThis is the type of setup that filters out noise traders. Four-hour price delivered into a stacked FVG zone — aligned with equilibrium, and structured to reprice.
Here’s the logic:
After taking out short-term highs near 111.9k, price repriced sharply — not randomly, but with algorithmic precision — into a series of untouched 240min FVGs.
Price tapped the upper imbalance, hovered at the 0.618 fib retrace (107.3k), and held. That’s not weakness. That’s orderflow.
Below this sits the final FVG + golden 0.786 (106.4k) and round number zone near 105.2k. That’s your invalidation layer. Anything inside it? Still Smart Money accumulation.
Above? The draw remains clear: inefficiency fill to 110.6k and liquidity resting above 111.9k.
My framework:
Bias: Bullish unless 105.2k gets violated with intent
Entry: 107.3k–106.4k
TP1: 108.5k (fib 0.382)
TP2: 110.6k (inefficiency fill)
Final objective: 111.9k raid
Volume confirms the handoff — sellers are trapped chasing the leg, Smart Money has already shifted to accumulation.
Final thought:
I don’t wait for signals. I wait for price to make sense. And here, it’s giving every reason to load.
“Fear at 0.618 is the edge of amateurs. Patience at imbalance is where precision lives.”

BITCOIN (BTCUSD): Pullback From Support
Bitcoin nicely respected a key horizontal support.
A breakout of a resistance line of a falling wedge pattern
provides a strong bullish confirmation.
I think that the price will go up and reach at least 108.320 level.
❤️Please, support my work with like, thank you!❤️

BTCUSDOKAY DEGENS
BTC is on a growth cycle not an innovation cycle which means slower growth, extended top, hypercycle on the backside and no double top BS like last time. The market will act like it did in 2017 going parabolic in LATE OCT/EARLY NOV. My low end target is 140k but it works on a time fractal for a November exit, so if we ain't at 140k by AUG that will probably be the top in NOV. So readjust, but I am a degen so I will shoot for 180k unlike the tards going for 240k thinking this is 2017 expect 1000% gains, we are at the top of the stock to flow model... This means adoption is slower and at the price action we are at now it is more difficult to "make number go up." Muhammad can't through a 60$ 100x trade anymore on swaps to push the price. Imagine that 240k for fake internet money, WILD, anyway don't make your greed translate into stupidity. Trust me I know, alright then... going to hang out with my second ex-wife's boyfriend Tyrone, see ya fellas.
I would be happy to share my thoughts on growth models vs innovation models in the BTC market.
"Where are my kids?"
-KewlKat

SPY/QQQ Plan Your Trade For 6-12: BaseRally In Trend ModeToday's pattern suggests the markets may attempt to identify a base and move higher (rally) off that base level.
Given the overnight price activity, I suggest the process of identifying the base level could prompt a deeper early decline in price - possibly attempting to retest 595-597 lows before finding support and attempting to rally.
As I've been warning over the past few weeks/months, I'm still seeing the Excess Phase Peak pattern playing out as a Flag Termination - rolling into a downtrend and attempting to move back towards the $480 lows as a real possibility. I've been warning and watching for the breakdown in trend - but we've not seen it yet.
Thus, we are still BULLISH until we get a confirmation of a solid breakdown. That would be a move below the 580-585 level at this point. We need to see some type of solid breakdown in price, breaking away from the FLAG setup and moving downward, before I could confidently suggest the Flag Breakdown has happened.
Gold and Silver are making a big move higher. Gold is finally starting to move back above $3400 and I believe watching Silver, Gold, & Platinum rally suggests FEAR is elevating as we move into the end of June.
I still believe Gold has a chance to rally above $4k before the end of June. We'll see if it happens.
BTCUSD is moving into a DUAL-EPP pattern. This is very interesting. Watch the video as I highlight why this could prompt a dual-stage EPP breakdown in Bitcoin over the next 20 to 50+ days.
Get some.
#trading #research #investing #tradingalgos #tradingsignals #cycles #fibonacci #elliotwave #modelingsystems #stocks #bitcoin #btcusd #cryptos #spy #gold #nq #investing #trading #spytrading #spymarket #tradingmarket #stockmarket #silver

BTCUSDT – Ready for the Next Leg Up?Bitcoin is currently consolidating around $107,000 after a strong rally from the ~$73,000 region. I'm using Fibonacci extensions and key support/resistance levels to anticipate potential continuation targets and pullback zones.
Technical Analysis:
Fibonacci retracement levels from previous move:
0.786 – ~$102,359 → strong local support
0.618 – ~$96,382
0.5 – ~$92,185
Current price: ~$106,990
Key resistance: ~$109,971 (Fib 1.0 level)
Potential bullish targets:
1.618 extension → ~$131,956 (medium-term target)
2.618 extension → ~$167,530 (long-term projection)
Bullish Scenario:
If BTC holds above the $102K–$104K area, we could see continuation towards $110K, followed by a breakout toward $132K (1.618 Fib). The structure remains bullish as long as higher lows are maintained.
Bearish Scenario:
A break below $102K opens the door for a deeper retracement toward $96K or even $92K, which aligns with 0.618 and 0.5 Fib levels, respectively.
Conclusion:
Bitcoin is sitting at a critical point. A short-term dip might offer a strong buy-the-dip opportunity. The market structure still favors the bulls unless key support levels are broken.

Bitcoin New ATH - Where now?After Bitcoin makes new all time highs, the next steps are very important. Where price goes now can be tricky to predict as there is the rare factor of price.
One of the only ways to predict where BTC may find resistance during price discovery is to use Fibonacci levels, using Fib extensions the first target for me would be between $117,500-$120,000. This area would be between the fib extension and the big even level, RSI would also be overbought on the daily time frame.
For the bearish scenario I think it's a much simpler play from a TA standpoint, lose the trend channel and get back under the old ATH level and I think we see a pullback towards $97,000. After such an extreme rally over the last 2 months with little to no rest a 10% correction would not be out of the ordinary despite such bullish ETF inflows. I have mapped a second target area should $97,000 fail, a SFP of the range can lead to a retest of the midpoint, this correction path would be much more severe with a more than 15% move lower.
To sum it all up Bitcoin has been on a great run in the last 2 months and has reached most traders common target of making a new ATH. Now there must be a new objective... Continue the move into price discovery or a corrective move? Price discovery has no previous selling history and so Fib levels along with big even levels are used to predict resistance levels. Corrective move would mean dropping out of the bullish trend channel and falling into a place of support, in my mind that would be ~$97,000 or failing that ~$91,000 (range midpoint).

BTC/USD: More Bullish MOVE Ahead? (READ THE CAPTION)By analyzing the #Bitcoin chart on the weekly timeframe, we can see that the price has finally reached our expected level of $111,880, setting a new all-time high.
Currently, Bitcoin is trading around $110,800, and if it manages to hold above this key level, we could expect further bullish movement.
The next potential targets are $130,000 and $163,000, respectively.
Please support me with your likes and comments to motivate me to share more analysis with you and share your opinion about the possible trend of this chart with me !
Best Regards , Arman Shaban

BTC is reviving for a new bull runBTCUSD is correcting to 108000 as it hits the sell zone at 101200. At 108000 it is quite clear to set up BUY signals. Another area to watch for BUY is 106500. BUY SL points are not above 700 price for BTC. Currently the uptrend is still going to continue so any pullback to support is considered a buying opportunity.

BITCOIN Megaphone is the last step before $150k.Bitcoin (BTCUSD) is repeating almost to the exact point the 2023/ 2024 uptrend, as right now it is in the process of forming a Megaphone pattern similar to the one during December 2023 - January 2024.
Before that, both patterns started the uptrend when a 1D Death Cross formed the bottom. After the 1st Bullish Leg, a Channel Up on a 1D Golden Cross marked the transition to the 2nd Bullish Leg that eventually led to the Megaphone.
In 2024, when BTC broke above the Megaphone, it started the final Bullish Leg that peaked a little above the 1.786 Fibonacci extension from the bottom. During that process, the 1D RSI sequences among the two fractals have been similar.
As result, aiming for the $150000, which is marginally below the 1.786 Fib ext, is a solid target.
Do you think the pattern will continue to be repeated? Feel free to let us know in the comments section below!
-------------------------------------------------------------------------------
** Please LIKE 👍, FOLLOW ✅, SHARE 🙌 and COMMENT ✍ if you enjoy this idea! Also share your ideas and charts in the comments section below! This is best way to keep it relevant, support us, keep the content here free and allow the idea to reach as many people as possible. **
-------------------------------------------------------------------------------
💸💸💸💸💸💸
👇 👇 👇 👇 👇 👇

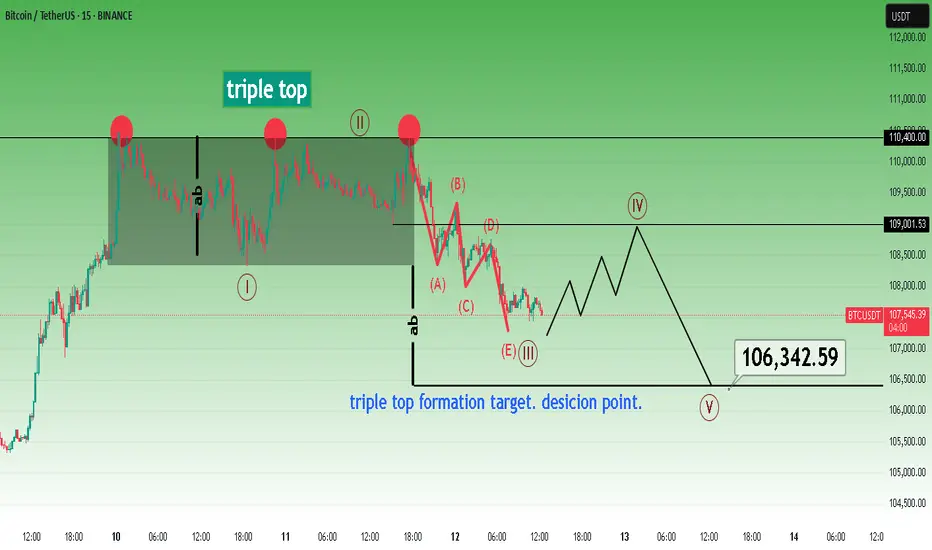
Bitcoin short term triple top pattern target.The most likely scenario in my opinion.
* The purpose of my graphic drawings is purely educational.
* What i write here is not an investment advice. Please do your own research before investing in any asset.
* Never take my personal opinions as investment advice, you may lose your money.
$BTC/USDT MAJOR PUMP? or MAJOR DUMP?BTC, the worlds biggest and fastest growing coin. With a market cap in the Trillions, we are facing a major moment.
Will price dump? or will it pump and go above and beyond.
Lets find out in this analysis!
1. Trend Overview
HTF Bullish:
Price remains above the long-term bullish trendline, showing strong macro support.
Recent price action is consolidating within a major supply zone and liquidity cluster — signaling indecision before a breakout or breakdown.
📈 2. OBV (On-Balance Volume) Analysis
OBV is coiling in a symmetrical triangle, indicating a volume squeeze.
This tightening range typically precedes a major breakout or breakdown, matching the price consolidation near resistance.
🔄 Market Structure
Price has formed a potential top just under the supply/liquidity zone (~$110,000–$112,000).
Swing High is defined just below $112K.
Key structure zones are:
Resistance zone at current levels.
Support zones:
1D FVG ($97K) and Weekly FVG ($87K–$93K)
🟪 Supply & Demand Zones
Supply Zone: $100k - $112k — multiple rejections here indicate this is a key short-term ceiling.
Demand Zone: Deep support between $50-$57K, aligns with trendline and historical value area.
🔵 Fair Value Gaps (FVGs)
1D FVG: $97K area — may act as magnet if price breaks below resistance.
1W FVG: $87K–$93K — stronger structural level to watch.
If both are filled, price may meet the bullish trendline around $90K.
🧠 Liquidity Zones
Above current price: ~$112K is marked as a liquidity grab area — stop hunts may occur before major reversal.
Below: FVG zones could trigger a liquidity sweep downwards before reversal.
🔴 Volume Profile
Strong high-volume node (HVN) around $80K–$97K: acceptance zone, likely to act as magnetic support.
Above $110K is a low-volume node (LVN): if broken cleanly, price may accelerate quickly toward $120K+.
✅ Bullish Scenario
Break above $112K → sweep liquidity → continuation toward $120K–$125K. (Price Discovery)
OBV breakout upwards would confirm.
Hold above FVG 1D if retested = healthy bullish continuation structure.
❌ Bearish Scenario
Rejection at supply → drop to FVG 1D ($97K), then potentially Weekly FVG (~$93K).
If OBV breaks downward, it confirms bearish volume divergence.
Breakdown below trendline could target deeper into demand zone (~$70K+).
📌 Summary
Bias: Neutral-bullish short term, bullish macro (above trendline).
Key Breakout Level: $112K.
Critical Support: $91K–$97K (FVG cluster).
Confirmation: OBV breakout + clean structure break.
Invalidation: Weekly close below long-term trendline and FVG zones.

ETHUSDT.P H1 : Short-Term CorrectionBy analyzing the 1-hour timeframe, we can see that the price may drop from the 2780–2820 zone down to 2600

Bitcoin H1 | Falling toward an overlap supportBitcoin (BTC/USD) is falling towards an overlap support and could potentially bounce off this level to climb higher.
Buy entry is at 106,873.50 which is an overlap support that aligns with the 38.2% Fibonacci retracement.
Stop loss is at 105,200.00 which is a level that lies underneath an overlap support and the 50% Fibonacci retracement.
Take profit is at 109,219.00 which is an overlap resistance.
High Risk Investment Warning
Trading Forex/CFDs on margin carries a high level of risk and may not be suitable for all investors. Leverage can work against you.
Stratos Markets Limited (tradu.com ):
CFDs are complex instruments and come with a high risk of losing money rapidly due to leverage. 63% of retail investor accounts lose money when trading CFDs with this provider. You should consider whether you understand how CFDs work and whether you can afford to take the high risk of losing your money.
Stratos Europe Ltd (tradu.com ):
CFDs are complex instruments and come with a high risk of losing money rapidly due to leverage. 63% of retail investor accounts lose money when trading CFDs with this provider. You should consider whether you understand how CFDs work and whether you can afford to take the high risk of losing your money.
Stratos Global LLC (tradu.com ):
Losses can exceed deposits.
Please be advised that the information presented on TradingView is provided to Tradu (‘Company’, ‘we’) by a third-party provider (‘TFA Global Pte Ltd’). Please be reminded that you are solely responsible for the trading decisions on your account. There is a very high degree of risk involved in trading. Any information and/or content is intended entirely for research, educational and informational purposes only and does not constitute investment or consultation advice or investment strategy. The information is not tailored to the investment needs of any specific person and therefore does not involve a consideration of any of the investment objectives, financial situation or needs of any viewer that may receive it. Kindly also note that past performance is not a reliable indicator of future results. Actual results may differ materially from those anticipated in forward-looking or past performance statements. We assume no liability as to the accuracy or completeness of any of the information and/or content provided herein and the Company cannot be held responsible for any omission, mistake nor for any loss or damage including without limitation to any loss of profit which may arise from reliance on any information supplied by TFA Global Pte Ltd.
The speaker(s) is neither an employee, agent nor representative of Tradu and is therefore acting independently. The opinions given are their own, constitute general market commentary, and do not constitute the opinion or advice of Tradu or any form of personal or investment advice. Tradu neither endorses nor guarantees offerings of third-party speakers, nor is Tradu responsible for the content, veracity or opinions of third-party speakers, presenters or participants.

BTC/USD 4H Trade Setup – Demand Zone Reversal Play🔵 1. Demand Zone 🧲💎
📍 Range: 100,418.83 – 102,253.51
🟦 Strong support zone
💡 This is where buyers are expected to step in
📉 Price is currently testing this zone — potential reversal area
🚀 2. Entry Point 🎯
📍 Zone: 102,232.52 – 102,264.33
✅ Just above demand zone for safe entry
🧘♂️ Wait for bullish confirmation (wick rejections, engulfing candles)
🛑 3. Stop Loss 🔻
📍 Zone: 100,498.77 – 100,538.74
🔒 Below demand zone — protects you from false breakouts
⛔ Invalidates setup if price breaks below this level
🎯 4. Target Point 💰
📍 Target: 108,800.00
🧱 Major resistance zone
📈 Offers a solid Risk/Reward setup (approx. 1:4)
🪜 Possible take-profit scaling around 108,656.78 – 109,256.50
🔁 5. CHoCH – Change of Character 🔄
📍 Confirmed structural break above a lower high
🕵️♂️ Indicates shift from bearish to bullish
🔁 Needs confirmation with higher low near demand zone
📏 6. EMA 70 (Exponential Moving Average) 📉
📍 Level: 106,849.30
🔴 Price is currently below EMA = short-term bearish
🧗♂️ Reclaiming the EMA will strengthen the bullish bias
✅ Quick Summary with Emojis
📌 Plan:
🔵 Buy near: 102,250
🛑 Stop Loss: 100,500
🎯 Take Profit: 108,800
📊 Trend:
🔻 Bearish short-term (below EMA)
🔁 Potential reversal from demand zone
⚠️ Watch For:
🔍 Bullish confirmation at demand zone
🔄 Reclaim of EMA (106.8k)
🧱 Resistance near 108.8k

BTC/USD Analysis – 4H Interval (Sample Workflow)BTC/USD Analysis – 4H Interval (Sample Workflow)
Note: I do not have access to the exact 4H chart from your screenshot, so I will perform the analysis based on the current market situation and typical price zones and setups that are worth following (you can apply them to your chart in TradingView).
📊1. Support and resistance zones
Resistance: 110,000 USD
(the last local peak and the place where a strong supply reaction was visible)
Support: 105,000 USD
(the place of the highest volumes and previous bounces, supported by POC levels from your screenshot)
Next support: 103,000 USD
(important level resulting from previous consolidations)
🔍2. Trend & Price Action
Direction: In the short term, the uptrend dominates (a series of higher lows and highs), but a stronger supply wick has appeared - a local pullback is possible.
Observe: Possible correction to the nearest support zones, rebound from POC/VAL/VAH levels.
Price channels: You can draw a rectangle (channel) between 107,000 and 110,000 as the current volatility range.
📌3. Indicators
Stochastic Oscillator: Close to the overbought zone (above 75) - a signal of a possible short-term pullback.
CHOP (Choppiness Index): Low - suggests that the market has just moved from consolidation to a trend (another strong movement after the correction may develop).
📊4. Candlestick structures
Last H4 candle: Long upper shadow (a possible signal of demand exhaustion).
Watch:
Reversal patterns (e.g. pinbar, engulfing) on support/resistance zones.
🧠5. Scenarios and levels to watch
Bull scenario
Breakout of resistance 110,000 USD → possible quick move to 112,000–114,000 USD.
Condition: Increased volume and closing of 4H candle above resistance.
Bearish scenario
Bounce from 110,000 USD and drop to 107,000 or 105,000 USD.
If 105,000 USD is broken, possible retest of 103,000 USD.

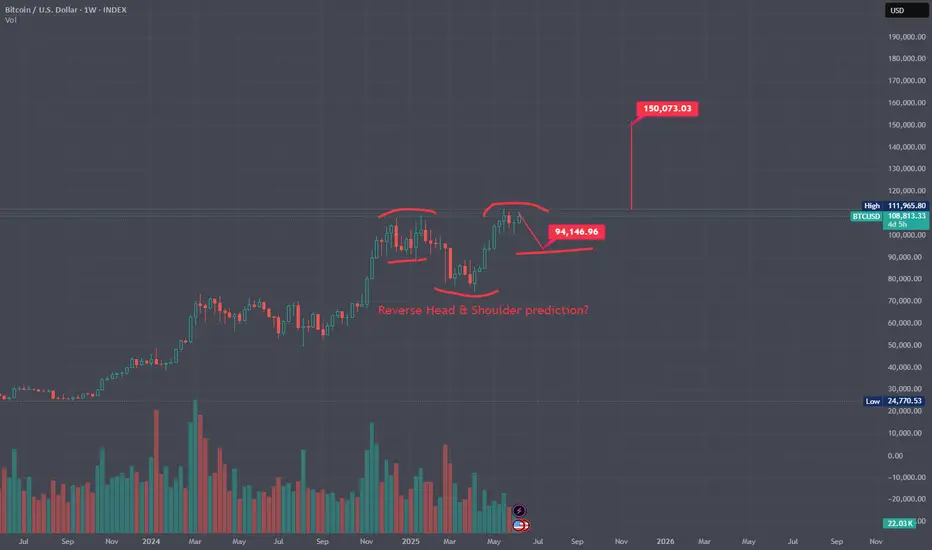
Reverse head & shoulder pattern setup for $BTC ?Potential movements in the charts for Bitcoin the next few weeks.
Will be exciting to see if this potential reverse head & shoulder plays out or if it does...
Fingers Crossed!