DXY Update..PWL takenGood day traders I’m back yet again with another update but this this it’s DXY(dollarindex)).
Price has taken previous week’s low, and for me that’s the manipulation phase in the power of 3 because my bias is bullish on the dollar and bearish on foreign currencies. Price has taken the PWL in a zone/area where we saw price react higher in that BPR zone/area. For the rest of the week I personally believe we can expect higher prices on DXY, Atleast till the midpoint of that gap above price. ICT teaches more on the importance of that halfway/midpoint of gaps and other PD arrays.
Since we are in a discount zone we can expect price to move higher into the premium range of the daily TF dealing range and our first liquidity (internal) is also inside the premium zone.
1-BTCUSD

BTCUSD Breakdown Incoming? 4H Chart Flags Key Bearish Entry🔵 Entry Point (Sell Limit / Market Entry)
• Around $104,600 – $104,700
This area aligns with the retest of the descending trend line and a weak resistance zone. Price is reacting negatively after hitting this level.
🟥 Stop Loss
• $107,060
Placed just above the weak resistance. This protects the trade in case price breaks structure and invalidates the bearish setup.
🟩 Take Profit Targets
1. TP1: $101,818 (Support 1)
o First major support zone; price has bounced here previously.
2. TP2: $98,020 (Support 2)
o Deeper support and more aggressive target. Aligned with previous wick lows.
🔺 Chart Observations
• Trend Line: Still intact and respected. Price rejected it on the latest retest.
• Structure: Lower highs and lower lows show bearish momentum.
• Volume/Volatility: Tapering candles around resistance indicate weakening bullish attempts.
• Risk-to-Reward
o TP1 R:R ≈ 1.3:1
o TP2 R:R ≈ 2.5:1+
⚠️ Scalper Note
If you’re trading this as a scalp, consider securing partial profits at TP1 and moving SL to breakeven to protect gains. Volatility around macro events or news (like the red event icons near June 3–5) could trigger wicks.
Would you like me to add RSI, MACD, or EMA confluence to strengthen the setup further?

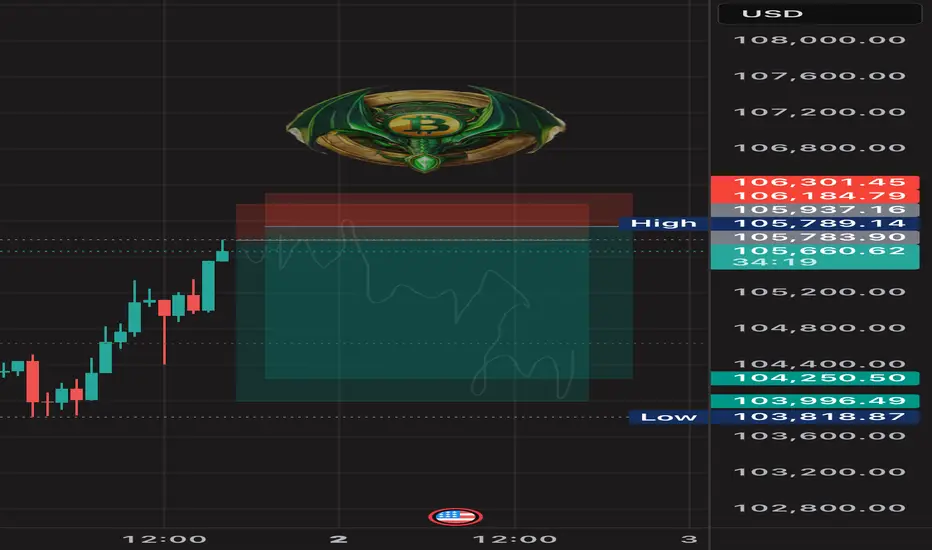
BTC didn’t dump — it tapped.BTC reached into the 1H FVG and wicked just above the OB at 104,204 — delivering premium liquidity and then reversing.
Most are staring at red candles, but the real story is the reaction zone:
Price tagged the 0.618 level (104,559) with precision and reversed with displacement.
Now what?
We're mid-delivery. If BTC can reclaim 104,800–105,000 (mid OB/FVG confluence), a strong move into 105,865 is likely — potentially sweeping for external liquidity near 106k.
Execution Plan:
Entry: 104,600–104,700 range
SL: 104,200 or beneath 103,752 swing
TP1: 105,365
TP2: 106,000+
Key invalidation: clean break below 104,200 with volume
Bias: Bullish while above 104,200
Why: Fair Value Gap fill + OB + 0.618 convergence + responsive wick
This wasn’t a sell-off.
This was a setup.

02/06/25 Weekly OutlookLast weeks high: $110,718.68
Last weeks low: $103,065.74
Midpoint: $106,892.21
As we approach the middle of the year, Bitcoin is back above $100,000 despite pulling back from a new ATH of $112,000. In the month of MAY BlackRocks ETF had record inflows of over $6B propelling prices 11% higher.
Last week we saw as the month closed and with that it's natural to have a window dressing period that usually leads to de-risking slightly. BTC stayed within the previous weeks range and maintains the pattern of:
Chop/consolidation --> expansion to the upside --> chop/consolidation...
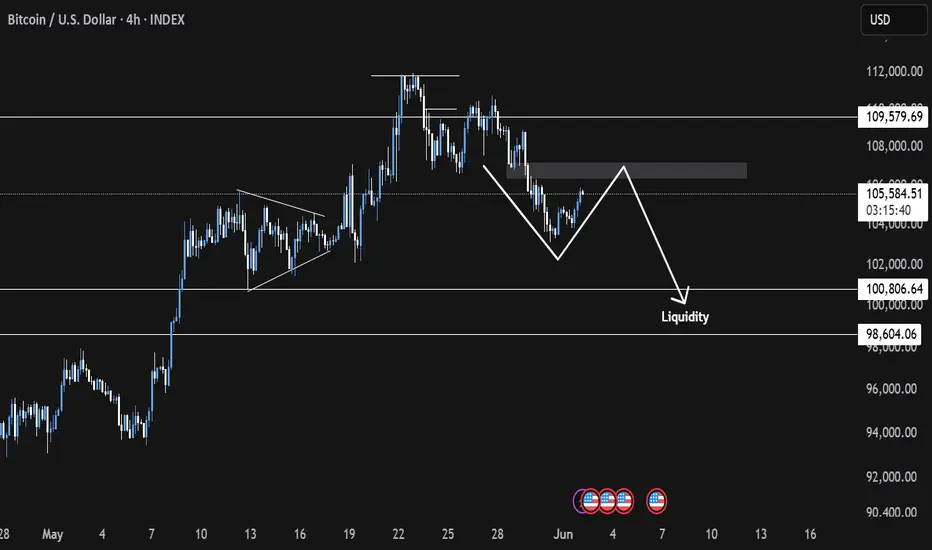
However in this case the consolidation week had a much larger range than in the past which is a sign to me that the rally is exhausted for now. It's because of this I feel we may see a weekly low break for the first time in a month and get a more meaningful pullback than we've seen since early April. My target would be around the $97,000 area.
The case for the bulls is still a convincing one despite some red flags. Record ETF inflows continue to pour, M2 money supply continues to grow and a general shift to risk-on assets is clear. However these are longer term factors and just for this weeks outlook the momentum is with the bears briefly.

BTC short term correction: zone 100k💎 BTC PLAN UPDATE (June 2)
NOTABLE NEWS ABOUT BTC:
Meta shareholders have decisively voted down a proposal to explore adding Bitcoin to the company’s balance sheet, signaling limited appetite for crypto exposure at the tech giant.
According to a regulatory filing dated May 28, the “Bitcoin treasury assessment” proposal garnered just 3.92 million votes in favor — representing a mere 0.08% of total shares — while nearly 5 billion votes against it.
Given that CEO Mark Zuckerberg holds 61% of Meta's voting power, as disclosed in an April filing, it is likely he played a pivotal role in rejecting the measure.
TECHNICAL ANALYSIS PERSPECTIVE
Bitcoin closed below the daily support level of $106,406 on Thursday and fell another 1.50% the following day. However, prices saw a slight recovery over the weekend. As of Monday's writing, BTC is trading below $105,500.
Assuming BTC faces resistance around the $106,406 daily level and continues correcting, it could extend the decline to retest the psychologically important $100,000 mark.
The Relative Strength Index (RSI) on the daily chart is at 53, trending down toward the neutral level of 50, indicating weakening bullish momentum. The Moving Average Convergence Divergence (MACD) also showed a bearish crossover last week. The increasing red histogram bars below the baseline further signal a potential correction ahead.
At this point, whether you are new or experienced, it’s advised to spend more time practicing and enhancing your knowledge of technical analysis. Consider exploring educational posts on the channel (…) to strengthen your foundation and avoid losses during this period.
==> This is a trend-based analysis for reference only. Wishing all investors successful trades!

BTCUSD UPDATE 2- 6 - 25The chart you uploaded shows a falling wedge pattern on the Bitcoin (BTC/USD) 1-hour chart. Here is an updated analysis based on visual indicators:
---
🔍 Pattern Overview:
Pattern: Falling Wedge (bullish reversal pattern)
Price Action: Consolidation within two downward sloping trend lines
Current Price: Around $104,773
Potential Breakout Target: ~$112,240
Support Zone: ~$102,830
---
📈 Updated Technical Outlook:
✅ Bullish Scenario:
If BTC breaks above the wedge resistance (upper blue line), a rally towards $112,240 is possible.
This level is likely captured by the wedge height projected above the breakout point.
Look for a clear breakout candle with volume above ~$105,000 for confirmation.
⚠️ Bearish scenario:
Failure to hold above support (~$102,830) could invalidate the bullish setup.
A break below this could open the door to further declines, especially if macroeconomic factors turn negative.
---
📅 Timing and Events:
Marked by icons at the bottom are upcoming US economic events, which could trigger volatility.
Keep an eye out for high-impact data releases like non-farm payrolls, CPI, or interest rate announcements.
---
✅ Actionable Summary:
Buy Trigger: Break and close above the wedge with strong volume (~$105K+)
Target: $112,240
Stop Loss: Below $102,830 (or below the lower trendline)
Would you like me to interpret or update the image with these insights, or create a fresh one with the expected breakout?

Bitcoin BTC price analysis🍿 At the OKX:BTCUSDT chart, we show one of the scenarios that could play out in the first half of June.
Much will be decided today with the opening of the US market. It is very likely that there will be a downward movement at the opening in response to the new tariffs announced by Trump on Friday after the markets closed.
🕯 Well, then we'll have to “keep our fingers crossed” that market players show their strength and hold on and buy back the drop — like say: we're tired of shaking with every crazy statement from Trump.
💰 If the price of CRYPTOCAP:BTC stays above $103k, there is a chance that it will be “stuck” in the $103-110k consolidation. The market needs to digest and redistribute the results of two months of #BTCUSD price growth from $75k to $112k.
And considering the position of the BTC.D and USDT.D indices, there is a chance that the “little bit” of capital will pass to the altcoins, and they will shoot up a little.
⁉️ Probably, the safest thing to do would be to watch the altcoins and buy only those that have started a significant upward movement with volume.
What do you think?
#BTC/USDT#BTC
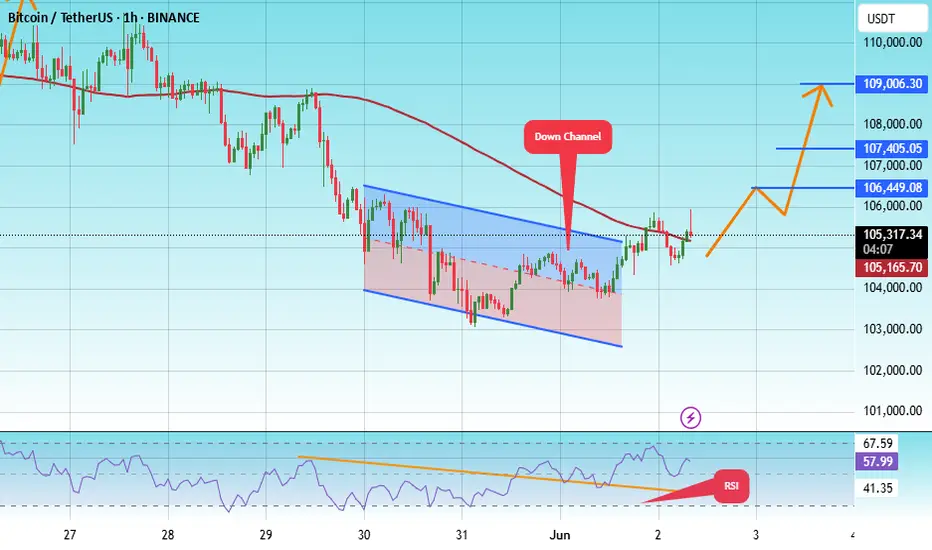
The price is moving within a descending channel on the 1-hour frame, adhering well to it, and is heading for a strong breakout and retest.
We are experiencing a rebound from the lower boundary of the descending channel, which is support at 103141.
We are experiencing a downtrend on the RSI indicator, which is about to break and retest, supporting the upward trend.
We are looking for stability above the 100 moving average.
Entry price: 105268
First target: 106500
Second target: 107405
Third target: 109006
Most called rejection. I called reaccumulation — mid-trade.This wasn’t luck. It was structure.
BTC tapped directly into the 1H Fair Value Gap at 105,016 — precisely the overlap with 0.382 fib and the volume imbalance from the prior impulse. Price didn’t just react. It delivered confirmation. Fast.
Entry was clean, risk tight — and the invalidation was defined. Below 104,517, I’m out. No emotion. Just system.
I’m now watching the 105,325–105,825 pocket. That’s where the thin volume zone transitions back into resistance — and where trapped shorts begin to feel the heat.
If price breaks and holds above 105,900, expect a swift drive into 106.7–107.0 before further consolidation.
Execution clarity:
✅ Entry: FVG 1H — 105,016
🎯 TP1: 105,825
🔒 Stop: 104,517
🔓 R:R = 2.38, no drawdown, full intent
Most wait for confirmation.
I act at the point of imbalance — not after it’s obvious.

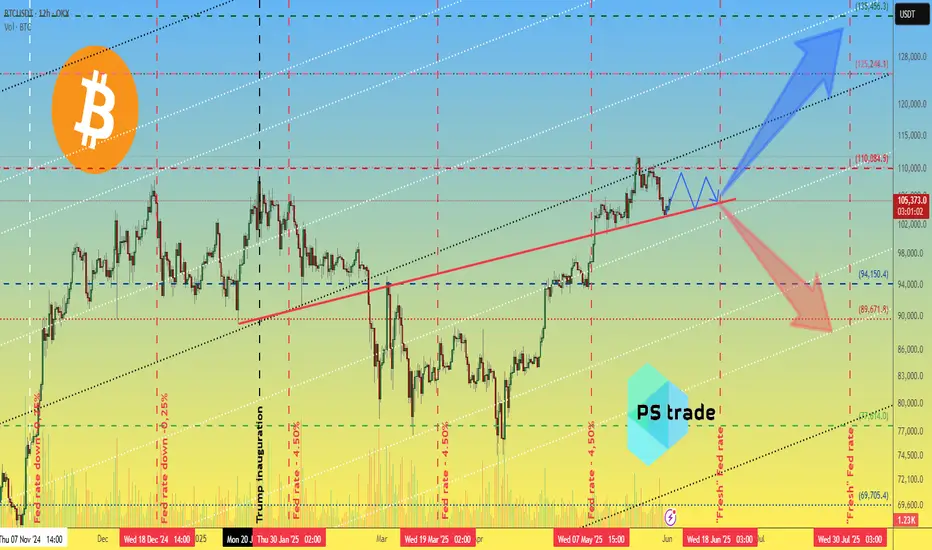
Bitcoin - Will Bitcoin reach $120,000?!Bitcoin is in its short-term descending channel on the four-hour timeframe, between the EMA50 and EMA200. Personally, I would look to sell Bitcoin at a target of $100,000. Either from the channel ceiling or after an invalid breakout of the specified channel. If this corrective move occurs, Bitcoin buying opportunities can be sought within the demand zone.
It should be noted that there is a possibility of heavy fluctuations and shadows due to the movement of whales in the market, and capital management in the cryptocurrency market will be more important. If the downward trend continues, we can buy within the demand range.
The Bitcoin 2025 Conference, widely regarded as the largest global event dedicated to Bitcoin and blockchain technology, took place from May 27 to 29 at the Venetian Convention Center in Las Vegas, Nevada. First launched in 2019 and held annually since, the conference has become the central meeting point for Bitcoin enthusiasts and professionals, offering a platform for knowledge exchange, ideation, and innovation within the Bitcoin ecosystem. With over 30,000 attendees, 400 speakers, and participation from around 5,000 companies, this year’s event played a significant role in advancing the global adoption of Bitcoin—often referred to as “hyperbitcoinization.”
The 2025 edition covered not only technical subjects such as Layer 2 scaling solutions and privacy enhancements, but also broader themes like institutional adoption, strategic Bitcoin reserves, and its implications for financial freedom on a global scale.From an economic perspective, there was a strong emphasis on Bitcoin’s role as a store of value amid inflationary pressures and unstable monetary policies. Forecasts presented by key figures such as Michael Saylor and Paolo Ardoino pointed to Bitcoin’s potential to emerge as a foundational asset within global financial systems. These projections were further supported by the expansion of the M2 money supply in 2024 and expectations for continued growth into 2025.
In addition to highlighting opportunities, the event also addressed the challenges facing Bitcoin. One major concern was the lack of clear legal and regulatory frameworks in certain countries—a topic addressed by Caitlin Long and other speakers. Such regulatory uncertainty could hinder broader Bitcoin adoption. Moreover, Bitcoin’s price volatility—highlighted by a 3.4% decline in the weeks leading up to the conference—raised questions about the market’s long-term stability.
Meanwhile, Coinbase reported that the repayment of debts related to the bankrupt FTX exchange could act as a $5 billion liquidity injection into the crypto market. This development is expected to boost capital inflows and potentially draw major institutional players back into the space.
According to Coinbase, as of May 30, the “FTX Recovery Trust” has begun its second phase of repayments, distributing over $5 billion in stablecoins to creditors. These payouts are being processed over three days via the BitGo and Kraken platforms. Unlike the first round in February, this phase involves only stablecoin disbursements rather than a mix of crypto and cash—enabling recipients to reinvest their funds more quickly and efficiently.
Additionally, U.S.-based companies currently hold 94.8% of all Bitcoin owned by publicly traded firms. The U.S. also commands 36% of the global Bitcoin hash rate, underscoring its dominance in mining activities. So far, 36 U.S. states have enacted pro-Bitcoin legislation, signaling a growing legal endorsement of the cryptocurrency across the country. This level of concentration—in ownership, regulatory leadership, and mining capacity—could position the U.S. to play a more decisive role in shaping future global Bitcoin regulations.

$Btc Bearish Flat Pattern Forming?Bitcoin Bearish Flat Pattern Forming? Potential Short Setup to $97K-$98K if Rejected at $106K
📉 BTC recently hit a new all-time high around $112K, followed by a series of higher lows near $110K, $108K, and potentially $106K. If price gets rejected at $106K, a bearish flat pattern may play out—triggering a high-probability short opportunity toward the $97K–$98K support zone. However, a clean breakout above $107K will invalidate this setup.

Bitcoin on JUNE's Pivot, $103kI believe $103,300 ( June's Pivot ) will hold bitcoin, and in few days we see a rally to the upside, and by the end of June, Bitcoin will reach to $121,700 which is the 2nd resistance for the pivot.

BTCUSD Mind Mapping Analysis (MMC) + Structure Mapping + Target🕵️♂️ Introduction
Welcome traders! In today’s BTCUSD analysis, we dive deep into the Mind Mapping Concept (MMC) with curve-based support, smart money structure shifts, and mapped liquidity levels. This chart reveals how institutional players moved price through liquidity traps, accumulation zones, and major breakout points, culminating in a reversal zone.
This breakdown is ideal for traders using:
Smart money concepts (SMC)
Curve theory
Liquidity sweeps
Structure mapping
🔍 Detailed Breakdown of the Chart:
🔹 1. Ellipse Zone – Liquidity Trap Phase
The blue ellipse on the left shows a clear area of price compression and indecision.
This is where retail traders often enter prematurely, expecting reversal.
Smart money exploits these zones to collect liquidity — this is not yet a trend shift, but a trap.
You can observe multiple wicks and fakeouts, signaling manipulation and preparation for expansion.
🔹 2. Expanding Channel – Volatility Phase
Following the trap, price enters an expanding pattern (also known as a megaphone).
These structures indicate uncertain market behavior, often manipulated to clear both highs and lows.
Smart money uses this to exhaust both buyers and sellers before deciding the real trend direction.
🔹 3. Previous Target & SR Flip Zone
Price reaches the previous downside target, completing a downward liquidity move.
From here, the market forms a support-resistance flip (SR-Interchange) — a textbook zone for institutional entries.
Once this zone holds, it confirms that buyers are absorbing sell orders.
The curve starts forming, indicating deeper market structure realignment.
🔹 4. Black Curve – Mind Mapping Curve Support
One of the most important elements of MMC — the curve — acts as a psychological and algorithmic support line.
The curve captures the accumulation structure in a flowing manner.
Repeated touches and rejections confirm its strength.
As long as price respects the curve, the bullish momentum remains intact.
🔹 5. Breakout Confirmation
Price breaks through mid-range consolidation and hits Target 1.
This move confirms a shift in market sentiment from indecision to bullish control.
The breakout is supported by volume, structure alignment, and curve acceleration.
🔹 6. Major Breakout Zone
A major resistance line is broken — this marks a shift in macro structure.
At this point, we label the zone as “Major Breakout” — any retest of this can offer a high-RR entry.
🔹 7. Next Reversal Zone (Supply Zone)
Price is now inside the Next Reversal Zone, which is a potential supply area or liquidity magnet.
Institutional traders may use this zone for profit-taking or to initiate a deeper retracement.
Watch for rejection signs, such as long wicks, engulfing patterns, or volume divergence.
If this zone is absorbed (i.e., broken cleanly), expect another leg higher.
💡 MMC Summary (Flow Recap):
Trap → Expansion → Liquidity Target → SR Flip → Curve Accumulation → Breakout → Target Hit → Reversal Zone
Each stage reflects smart money behavior and follows the natural cycle of manipulation → accumulation → distribution.
📊 What to Watch Next?
Confirmation Rejection in Reversal Zone? Short entries could be valid with curve re-entries.
Bullish Continuation? A clean break above reversal zone = new weekly highs likely.
Retest of Curve? If price pulls back, watch for rejections on the curve for safer long positions.
🚨 Trade Tips Based on This Setup:
✅ Use multi-timeframe confluence (M30 + H1 or H4)
✅ Always mark out previous liquidity zones
✅ Place SL below the curve or zone rejections
✅ Avoid entering trades inside expanding zones – wait for structure confirmation
🔖 Conclusion
This BTCUSD setup showcases a masterclass in smart money behavior using the Mind Mapping Concept (MMC). From trap to breakout, every move is cleanly mapped, providing a strong edge to traders who understand institutional footprints.
Whether you're a scalper, day trader, or swing trader, incorporating MMC curve support and liquidity logic can take your trading precision to the next level.

BITCOIN Can the 4H MA200 hold and kickstart the next rally? Bitcoin (BTCUSD) almost hit on Saturday its 4H MA200 (orange trend-line), which has been holding since April 16, and immediately rebounded. So far the bullish reaction is moderate as the price action is still being restricted below the 4H MA50 (blue trend-line), which is now acting as the short-term Resistance.
The blue Arc pattern that BTC has formed in the past 3 weeks, resembles the last two peak formations and pull-backs since the early April bottom. On top of all this, the 4H RSI got oversold (30.00) actually for the first time since the April 07 bottom.
With the weakest rally of this long-term Bullish Leg being +16.06%, if the 4H MA200 holds and a 4H MA50 break-out confirms it, we can expect a minimum short-term rise of almost $120k (+16.06%).
Do you think that's what's coming next? Feel free to let us know in the comments section below!
-------------------------------------------------------------------------------
** Please LIKE 👍, FOLLOW ✅, SHARE 🙌 and COMMENT ✍ if you enjoy this idea! Also share your ideas and charts in the comments section below! This is best way to keep it relevant, support us, keep the content here free and allow the idea to reach as many people as possible. **
-------------------------------------------------------------------------------
💸💸💸💸💸💸
👇 👇 👇 👇 👇 👇

#BTC/USDT It's not over yet! Eying at 130K +ALTCOIN CHEAT SHEET!The last time I shared this chart was on April 14th, when Bitcoin was trading around $84,000 — right when panic was setting in across the market.
The message back then was simple: don’t panic, it’s just a retest.
And here we are again, revisiting the same sentiment with a new chart!
There are a lot of “double top” charts circulating in the space right now, but let me be clear: it’s not over yet.
Before jumping to conclusions, go through this chart and analysis to understand the full picture.
Bitcoin closed the week at $105,705 — certainly higher than most expected just a few days ago.
This marks the first red weekly candle after seven consecutive green closes, which is normal in the context of a healthy uptrend. We're still midway toward the broader target, so there’s no reason to panic or shift into disbelief.
Yes, we may see further corrections in BTC over the coming days or week, potentially down to $98K, and in a less likely scenario, even $ 92K. But this time, Ethereum is showing signs of strength and is likely to outperform Bitcoin, creating high-quality entry opportunities across the altcoin market. In other words, this phase is not a threat, it's an opportunity. BTC is still destined to hit $130k+ as per charts and other important metrics.
Here’s a typical market structure and reaction flow to help put things in perspective:
1. Bitcoin rallies — Altcoins underperform or get suppressed due to capital rotation into BTC.
2. Bitcoin corrects — Altcoins correct further as fear increases and dominance rises.
3. Bitcoin stabilises — Ethereum begins to gain strength, often leading the altcoin recovery.
4. ETH/BTC ratio increases — Ethereum holds up better while many altcoins continue to lag.
5. Bitcoin breaks ATH — This triggers a gradual recovery in altcoins.
6. BTC dominance peaks — Altcoins start gaining serious momentum.
7. Capital rotates from BTC and ETH into altcoins — Sectors tied to the current narrative (like meme coins this cycle, and Metaverse/NFTs in the last one) begin to lead.
8. Altcoin season begins — Utility and mid-cap tokens follow, often delivering strong returns in the final phase.
This pattern has repeated across cycles. Currently, we appear to be in the transition between Bitcoin stabilising and Ethereum gaining dominance — typically the stage that precedes a strong altcoin rally.
Now is not the time to assume the move is over. Stay objective, monitor capital rotation closely, and prepare for what comes next.
If your views resonate with mine, or if this post adds any value to you, please boost with a like and share your views in the comments.
Thank you
#PEACE

btc $121kbitcoin has completed three weekly and monthly closes above the current demand zone. pullbacks are treated as a healthy retest but will serve as fuel for another bullish wave

Bitcoin Weekly Outlook – June 2, 2025
Bitcoin ( BINANCE:BTCUSDT ) is holding strong above the psychological $100K mark, maintaining its bullish market structure on the weekly timeframe. However, technical indicators are flashing early signs of a possible short-term correction before another leg up.
🔍 Technical Analysis:
Current price: $105.1K
Key support zone: $89K (strong demand area + weekly structure retest)
Resistance to watch: $120K (major weekly supply zone + psychological level)
Stochastic RSI is currently overbought at 94+, which historically tends to trigger a healthy retracement before further upside continuation.
📊 Market Structure:
BTC remains well above the 200-week EMA, keeping bullish momentum intact
Higher Highs and Higher Lows are still in play
Volume is steady, showing no major distribution at the moment
📈 Sentiment Check:
Fear & Greed Index: 64 (Greed)
→ Suggests bullish sentiment is high
→ Greed often precedes short-term pullbacks or consolidation
🧭 Outlook:
A short-term correction toward the $89K–$92K zone is likely, as part of a healthy market cycle.
If support holds, BTC could rally back up with a mid-term target around $120K.
✅ Summary:
🔵 Bullish structure still intact
⚠️ Overbought signal = possible retracement
🎯 Mid-term target: $120K
🧘♂️ Don’t chase — wait for price to breathe, not break
Let the market come to you. Trade smart, not just hopeful.

Bitcoin Daily Technical Overview (BTC/USD)Currently, Bitcoin (BTC/USD) is trading around $104,800. Up slightly but still digesting a sharp reversal that rattled short-term bulls.
Recent Price Action: Rejection From $112K
Back on 22nd May, Bitcoin surged to a new high near $112,000, fueled by bullish momentum, institutional flows, and strong on-chain accumulation. However, that breakout was swiftly rejected, and BTC fell as low as $103,400.
This kind of "bull trap" reversal highlights a few key dynamics:
1) Overextended sentiment: The rally above $110K was not supported by volume or follow-through, suggesting exhaustion.
2) Profit-taking by large holders or institutions likely triggered a cascade of stop-losses, accelerating the decline.
3) Liquidation clusters in leveraged long positions likely exacerbated the drop.
Bitcoin is now attempting to reclaim stability around the $104K–$105K range.
🔍 Technical Snapshot
- Support Zones at $103,000 and $93,200
- Resistance Levels at $112,000 (ATH)
Price is still above the 50 & 200-day SMAs, which could be a bullish longer-term signal.
In addition, the price remains above the upper band of the cloud, but momentum is stalling. A decisive bounce off the cloud could reignite bullish sentiment. Or falling into the cloud could trigger more uncertainty and downside.
Macro tailwinds: Concerns over U.S. fiscal stability and potential Fed rate cuts could keep Bitcoin attractive as a non-sovereign asset.
📈 Projection Scenarios
Bullish Case:
If BTC consolidates above $107K, we could see another attempt and retest of $112K.
Bearish Case:
Failure to hold above $103K could see Bitcoin revisit $100K, and if that breaks, downside opens toward the $93K level.
🧭 Insight & Takeaway
The current reversal serves as a healthy reminder that no trend goes up in a straight line. Especially not in crypto.
It likely shook out overleveraged longs, reset sentiment, and may give the market room to breathe before the next leg up.
The long-term trend remains intact, but expect more volatility before any clean break to new highs.
Always DYOR and DYODD and manage your risk.

BTC SHORT TP:104,100 01-06-2025🚨 SHORT
Entry zone: 105,600 – 105,800
Target zone: 104,000 – 104,300
RR: 4.4
Timeframe: 1H – 2H
Estimated duration: 20 to 24 hours
We’re in a Sunday distribution + manipulation zone. There might still be a small final push to the upside, but the setup shows signs of exhaustion. Use a tight stop or adapt it to your risk profile.
If the move doesn’t happen within the estimated time, this setup is invalid.
We don’t use indicators, we’re not out here drawing lines or cute little shapes — I just give you a clean trade.
#BTC #Short #PriceAction
Correlation between USDT.D and BTC.D
Hello, traders.
If you "Follow", you can always get new information quickly.
Have a nice day today.
-------------------------------------
(USDT.D 1M chart)
If USDT dominance is maintained below 4.97 or continues to decline, the coin market is likely to be on the rise.
The maximum decline is expected to be around 2.84-3.42.
-
(BTC.D 1M chart)
However, in order for the altcoin bull market to begin, BTC dominance is expected to fall below 55.01 and remain there or show a downward trend.
Therefore, we need to see if it falls below the 55.01-62.47 range.
The maximum rise range is expected to be around 73.63-77.07.
-
In summary of the above, since funds are currently concentrated in BTC, it is likely that BTC will show an upward trend, and altcoins are likely to show a sideways or downward trend as they fail to follow the rise of BTC.
The major bear market in the coin market is expected to begin in 2026.
For the basis, please refer to the explanation of the big picture below.
-
Thank you for reading to the end.
I hope you have a successful transaction.
--------------------------------------------------
- This is an explanation of the big picture.
(3-year bull market, 1-year bear market pattern)
I will explain more details when the bear market starts.
------------------------------------------------------

TSLA PRICE ACTION 1ST JUNE 2025This is the updated price action of Tesla. I have explained why I exited long positions. If you have any doubts, then feel free to leave a comment below.
NOTE: STAY AWAY FROM TSLA LONGS

Bitcoin (BTC) Market Analysis1. Previous Analysis Validation
Our previous week's analysis played out perfectly, aligning well with the market movement.
2. Current Market Sentiment
The market remains bearish overall. However, we are seeing a short-term price pump, likely due to late short positions entering the market. This is resulting in a price move to trigger short liquidations. The recent 4H swing highs are acting as key stop-loss zones.
3. Imbalance & Rebalancing
The price is moving upward toward a daily imbalance area (highlighted in orange). We expect the market to rebalance in this zone, potentially leading to a price rejection and continuation of the downward trend.
4. Liquidity Zone
Our primary liquidity zone lies between \$100K and \$98K. We anticipate this area to be a key region for price reaction.
BTC TO $74KPrice took off a strong bullish momentum from 74,500. Now buyers are beginning to show signs of weakness after a mitigation block triggered a market shift and we can finally see sellers stepping back into the market. If 108,000 holds as resistance, we will get a new trend and momentum to the downside to 75,000
