BITCOIN (BTCUSD): Breakout & Bearish Continuation ₿
Bitcoin broke and closed below a solid intraday rising trend line.
The broken trend line turned into a vertical resistance now.
I expect a bearish continuation to 18770.
❤️If you have any questions, please, ask me in the comment section.
Please, support my work with like, thank you!❤️
1-XBTUSD

"the bear-ish case".good morning my peoples.
i've analyzed this count in twenty different ways, and i've narrowed it down to two.
i wanted to share the two trajectories which currently hold the highest probability in my honest professional opinion.
(view next post for case #2).
----
the first case is called "the miner + hashrate capitulation event".
in the recent years, each major low has been greeted with miner + hash-rate capitulation, as displayed down below:
we are currently entering an area in the market which is putting significant pressure on the bitcoin miners.
if the price goes any lower than 17.6k, a lot of miners will be forced to shut down their operations, and potentially begin to liquidate some of their assets to continue being able to pay for their operations.
if i'm not mistaken, it roughly costs 17.6k to mine one btc, so if btc goes below this number - miners would technically be losing money per btc mined (in electricity costs, etc).
most of the cycle lows have challenged the miners, and just about every time, we have seen them capitulate which caused an accelerated move to the downside.
----
is this time different?
nope. if anything, this time there's more miners than ever before in history,
so if btc so chooses to go down this path (which i think is inevitable, it's more a matter of when, rather than if) - then i think we're going to see one hell of a capitulation event.
----
the target for this particular scenario = 10k.
though, corrections come in three waves - so this would only be the first wave.
i've shared my primary macro outlook in a recent video, this is the count for it:

btc 7-13 update ~morning o/
--
might see one more leg down into that middle 18,000 area
the price action from down there will be key.
-if we come up in 5 waves, this will open a door to higher prices
-if we come up in 3 waves, the bounce will be short lived and further sell pressure will be initiated.
swinging the bounce(if i get filled), may hold longer if it feels right.
BITCOIN AND CPI EFFECTFrom november last year after after CPIs announcments we constantly go down, but if we speak about pure price action there were a lot of fake moves before the main one.
So, due to the fact we had fake break down resistance zone yesterday, we can have small pullback first bt then pump towards 22 k where prpbably we will have huge rejection and will leave redistrubution pattern to the south.

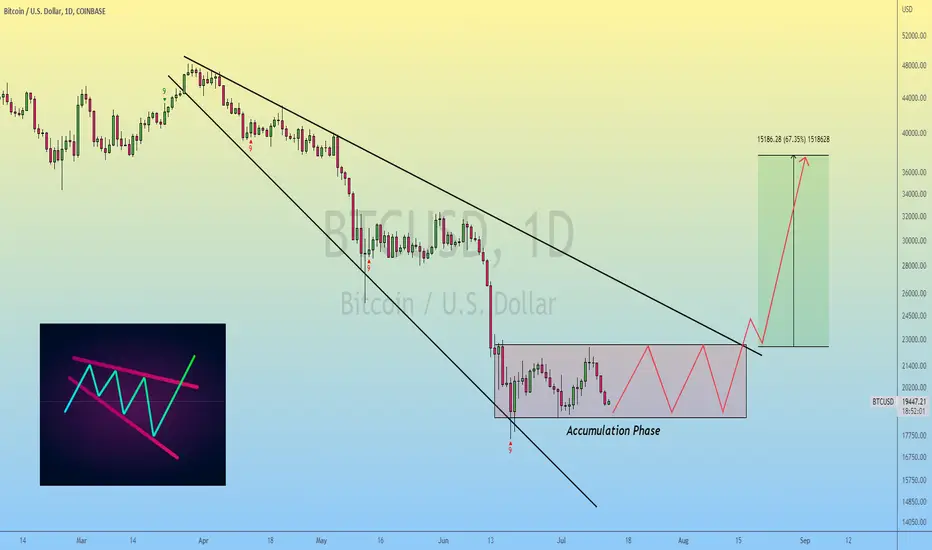
Bitcoin | Accumulation Phase & Broadening Wedge..!!
#BTC (Update)
Bitcoin is forming Descending Broadening Wedge in Daily timeframe.
Majority of Traders/Influencers are Talking about 10k-12k-14k But imo, Bitcoin will Remain 18-22k S/R Range for Next Few Weeks & Broke the Broadening Wedge in Mid August & hit the 38-40k Key Resistance in Late August/Early September So Keep Accumulating the #Bitcoin 👊
What'a About #Altcoins Sir??
Altcoins Look Good & Ready to Fly 🔥🚀
If #Bitcoin Remains CALM Between 18-22k Range for 3-4 Weeks, We Could See Altcoins 30-40% Rally..
Please like the idea for Support & Subscribe for More ideas like this and share your ideas and charts in Comments Section..!!
Thanks for Your Love & Support..!!
majority is always what?majority is always wrong m8,
remember that.
---
good morning my peoples,
i talked to you about the bull, the bear, and the ugly.
today i wanna talk to you about how i'm playing this current move, and my reasoning behind it.
---
i'm bullish into the next 2 weeks; specifically until july 30th.
i don't care about cpi data, nor the us dolla, or what the media says - don't come here talking about any of that lol.
my strategy, is to inverse the majority - and if you're coming here talking about anything related to what i have mentioned above - then you are the one i am inversing 😈
---
bitcorn upside target = 25k.

All the support is at 10K. Bear market ending November.Fractal of previous bear market, we can test the .618 at 10K, but need to continue up from there. Hedge your bets with this chart.

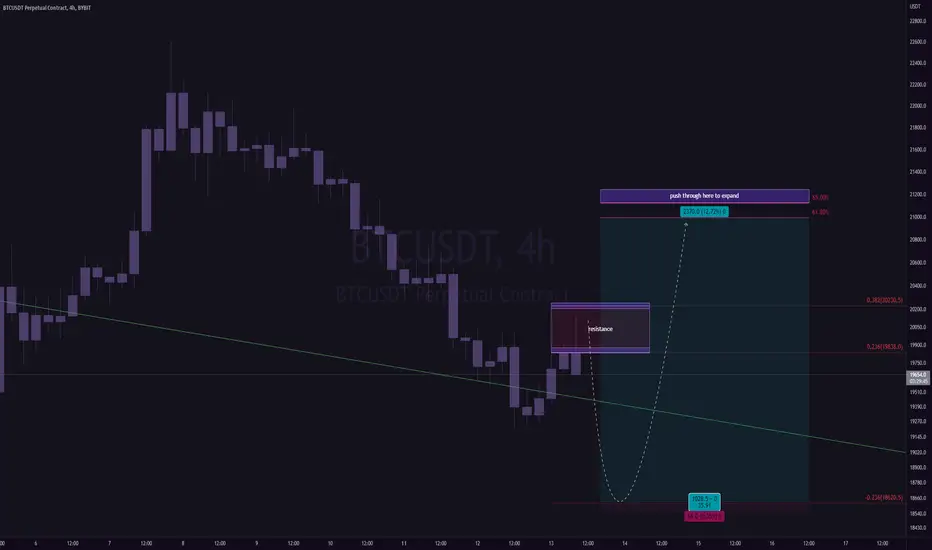
BITCOIN - POSSIBLE ONE MORE LEG UPBitcoin on critical level. So far we tested trend line from april for five times alredy and every time we got rejection. Also most of the corectove moves were five waves with three legs up which we miss now. So if 19.7 will hold we can have one more small fake pump to touch trend line for the sixth time.

"that wasn't love, that was just hope".as you all know, the cpi report is coming out in 2 days.
if that data fails to beat the current market expectations, i do wholeheartedly believe the markets will see an accelerated move to the downside.
it will be lead by long liquidations, miner capitulation, and extreme panic.
IF this happens, my target sits in a window between 12\13k.
it doesn't have to happen right now, so this is not me saying that it will,
but if it did, be ready for it.
👇
ps. 24k is still on the table if the cpi data beats expectations :].
cash is 👑

btc 7-10 update pt.2good evening,
been thinking a bit more about this local count, and i've come up with one more potential trajectory.
---
if we see a weak three wave bounce from my original downside target (view my last post for more context)
👇
then we'll likely see a slightly deeper retracement to 19.3k.
---
both scenarios lead to the same upside target of roughly 24k.
just need to focus on how it moves up after bouncing in the days ahead.
---
will throw an update when either of these outcomes are confirmed.

btc 7-10 update ~good afternoon my peoples,
in my last few posts, i talked about the possibility of seeing 23~24k before seeing a big pivot downwards.
here's how i think we can potentially get there.
---
as of this moment, shorts are out-weighing the longs.
1h hidden bullish divergence is present
1\3h stochastics have entered into oversold.
btc has come down in what looks to be 3 waves:
demand wicks are present, and there is an 11k long block acting as support.
---
cpi data in 3 days is a total wild card.
if that data beats expectations, we will see a significant short squeeze in the days ahead.
the full moon will too support a significant rally - potentially higher than my current expectations.
if that data fails to beat expectations, then i don't think we will see the local highs taken out, and btc along with the rest of the market will move straight down to the targets i have been discussing recently.
---
ps. i am still looking for lower prices after this push up
👇

"hope".each dip in a bear market tends to get larger over time.
reason being:
>humans buy in thinking a bottom is created.
>bots drive the price goes lower.
>humans panic sell.
----
eventually, the larger players begin to sell off their balance sheets.
-btc miners capitulate below 17.6k, as it is not profitable for them to mine btc anymore.
-hash-rate declines at a very rapid pace.
-massive long positions begin getting liquidated.
-margin calls are created.
-media headlines say "bitcoin is done forever".
-retail loses all hope.
𝑜𝑛𝑙𝑦 𝑡ℎ𝑒𝑛,
𝑖𝑠 𝑎 𝑏𝑜𝑡𝑡𝑜𝑚 𝑐𝑟𝑒𝑎𝑡𝑒𝑑.
----
for now, while majority of the market remains hopeful - i will remain to be bearish.
once a majority of the market loses all hope, i will flip 100% bullish.
no offense to anyone, it's just part of my strategy.
----
downside target = $12,400.
✌

btc 7-9 update ~good evening folks
---
our indicator is crossing bearish up here, indicating downside pressure in the days ahead.
it's possible we see one more scam pump to about 23k before the downtrend begins.
---
my downside target is between 12~13k for the time being, but there is significant support between 14~15k, so it may stop there.
---
ps. that downside target will be a big one; btc could move back up to 40~50k after poking it followed by another soul crushing capitulation phase.
💰

Return of the King v3Updated dominance idea. Perhaps bitcoin is going to survive this bear market at these levels while the alts capitulate. Else bitcoin moons and alts stagnate.

full moon ritualsconsider this post completely theoretical, and don't use it as financial advice lol.
---
just about every full moon over the last few years has marked a local bottom for bitcoin.
as we near july 13th, all of my indicators are pointing to a long liquidation event.
it's very possible that we don't get it this time around, but if we did i reckon it would look something along these lines:
>raid the 17.6k lows for liquidity.
>a grind up which doesn't take out the local high into the end of july.
>drop to 13~14k into august before a very sharp reversal.
💰

btc 7-8 update ~ good afternoon o/
----
bitcorn looks to be breaking through various barriers.
lot of sell signals popping off, but it just keeps going.
-----
looking for more upside into the days ahead, as talked about in yesterdays post.
little change to the count, aside from that it all looks pretty good to me.
there might be another 1-2 in there, but i can't confirm it until i see a reaction from one of my upside targets.
will update it when i could confirm it.
---
ps. i'm cash up here, as i don't trust this move in the slightest lol.

BITCOIN WILL GO TO 30K SOON! LONG BTCBitcoin is accumulating right now and its ready to PUMP hard imo.

BTC in a diagonal?The current trend of BTC is very weird. What was once a possible wave 2 pullback is now invalidated and where is we going now?
The structure of Wave C to me looks weird to be a regular impulse and could be a potential diagonal. If this is the case, the final target of w5 of diagonal matches nicely with the 50% retracement of the last major impulse to the downside before this ABC correction.
Just an idea and we must see an overlap of w1 and w4 before we consider this as a promising alternative & subwaves matches the bigger structure

, 12h hidden bear~12h hidden bear is confirmed.
~12h 55ema overhead,
~12h ichimoku cloud overhead
~3 major algo targets overlapping between 22.2~22.3k
6 points of confluence, all pointing to a strong downward move in the days ahead.
---
stay safe peoples o/

btc 7-7 update ~good afternoon o/
~
and just like that, with the flick of a switch, bitty invalidated my short term bear count.
~
as of me writing this, i am anticipating higher prices.
anywhere between 23.8~25.7 is the target.
theoretically, a very sharp rejection will take place in between those two levels which can take btc down over 50%.
~
if you aren't already in, don't be that guy who fomo's at the top.
i'm no financial advisor, but i tell you with confidence - that the market will always come back.

ETHEREUM - HUGE ACCUMULATION CHANNEL Short term looks like we can have little push to the upside towards 1400 usd. I will consider it as continuation of redistribution and just after its finished I would like to see downward movement to the new lows. I think green line matters and if we will go for new lows there can be our bottom.
In that case huge accumulation channel would be very clear.

ETHEREUM - POSSIBLE ONE MORE FAKE PUMPSo far we had some accumulation (red triangle) breaking up and retest of breakout. Until 1070 usd holds there is still a chance to have one major leg up (fake one imo). Its crucial now to break up and get to median of the channel in the making around 1230 usd, then we should test trend line and if holds we must break median to swep range high, then test it from above before the final leg to the upper band of the channel.

btc 7-5 update ~good afternoon o/
---
general idea remains the same,
btc is still trying to reach the local upside algo target;
will most likely see a rejection between 21.2~21.8k.
---
downside target sits at about 18k as of today
should be reached by july 12\13th;
after-which we should see a little move up, where alts will most likely lead the way.
