1000RATS/USDT: 100%+ PROFIT POTENTIAL SETUP!!🚀 1000RATS Breakout Alert – 100%+ Potential Incoming?! 👀🔥
Hey Traders! If you're all about high-conviction plays and real alpha, smash that 👍 and tap Follow for more setups that actually deliver! 💹💯
1000RATS has officially broken out of a beautifully formed Cup and Handle pattern — a strong bullish continuation signal. This setup has been building over weeks and is now looking ready for the next explosive leg.
🔍 Previous move from the same base delivered a 106% pump — and this breakout structure hints at another big potential.
🔹 Technical Highlights:
Breakout above neckline with volume
Holding above EMA support
Textbook Cup & Handle with ascending base
📍 Entry: Current Market Price (around $0.032) and add more in dip
🎯 Targets:
• Target 1: $0.045
• Target 2: $0.055
• Target 3: $0.061+
🛑 Stop-loss: $0.029
⚙️ Risk: Use proper risk management — 3x–5x leverage recommended
💬 Watching closely for follow-through — if momentum sustains, this can be a massive mover. What are your thoughts?
1000ratsusdt

Profitable Short Opportunity on RATS (6H)The RATS token is bearish in both the larger and internal structures. There is a liquidity pool below the current price, and it's expected to collect sell orders from a strong supply zone before sweeping this liquidity pool.
If the price reaches the red box, we will enter a short position.
Targets are marked on the chart.
A daily candle closing above the invalidation level will invalidate this setup.
For risk management, please don't forget stop loss and capital management
When we reach the first target, save some profit and then change the stop to entry
Comment if you have any questions
Thank You

#1000RATSUSDT maintains bearish momentum📉 SHORT BYBIT:1000RATSUSDT.P from $0.01823
🛡 Stop Loss: $0.01855
⏱ 15M Timeframe
✅ Overview:
➡️ BYBIT:1000RATSUSDT.P is in a downtrend after rejecting the descending trendline, confirming buyer weakness.
➡️ Volume Profile suggests that the main liquidity (POC) is positioned at $0.01938, reinforcing selling pressure.
➡️ The Head and Shoulders pattern strengthens the bearish case, and a break below $0.01823 will trigger further decline.
➡️ The main downside targets are in the $0.01800 – $0.01764 range, where profit-taking may occur.
⚡ Plan:
➡️ Short entry upon breaking $0.01823, confirming the bearish scenario.
➡️ Stop-Loss at $0.01855—placed above the nearest resistance to minimize risk.
➡️ Main targets: $0.01800, $0.01780, and $0.01764, where downside movement may slow down.
🎯 TP Targets:
💎 TP 1: $0.01800
🔥 TP 2: $0.01780
⚡ TP 3: $0.01764
🚀 BYBIT:1000RATSUSDT.P maintains bearish momentum — expecting further downside!
📢 BYBIT:1000RATSUSDT.P remains weak, and a breakdown below $0.01823 could accelerate the decline.
📢 Watch for price reactions near $0.01764, where a slowdown or bounce may occur.

$1000RATS Holds Key Trendline Support: Bounce Incoming? $1000RATS is testing a key trendline breakout and holding strong near support. A possible bounce could be on the way! 🚀
Keep a close watch. DYOY, NFA.$1000RATS Holds Key Trendline Support: Bounce Incoming?
1000RATS/USDT: Anticipating a Breakout Soon1000RATS/USDT: Anticipating a Breakout Soon
1000RATS/USDT is currently trading within a tight consolidation phase, forming a clear pattern on the chart. The price has been respecting its range boundaries, showing signs of compression as it approaches the edge of the pattern. This buildup of pressure often leads to a decisive breakout, and I am expecting this move in the coming days.
Key observations:
- The volume has been steadily declining, which is typical before a significant breakout. Watch for a surge in volume to confirm the direction of the move.
- The support levels within the pattern have held well, indicating that buyers are stepping in at critical points.
Strategy:
- A breakout above the resistance trendline could trigger a strong bullish move, potentially offering significant upside.
- Keep an eye on the market conditions; any stability in the overall market could accelerate the breakout momentum.
Note:
- Be cautious and wait for confirmation before entering the trade. Breakouts can sometimes lead to fake-outs, especially in volatile conditions.
- Manage your risk carefully and adjust your position size based on your tolerance level.
Patience is key here; opportunities like this often reward those who wait for the right moment. Keep this setup on your watchlist and monitor closely!

rats looks a rocket ! (1D)It seems to be nearing the completion of a triangle, and soon the energy within the triangle could be released, leading to a price pump. As long as it remains above the key level, it is bullish.
Targets are indicated on the chart.
A daily candle closing below the invalidation level would invalidate this analysis.
For risk management, please don't forget stop loss and capital management
When we reach the first target, save some profit and then change the stop to entry
Comment if you have any questions
Thank You

Bullish on $1000RATS (Binance Futures)1. We have the setup pyramided in a weekly orderblock
2. We have the market inside the daily orderblock
3. We have a market structure shift (MSS) in H4
4. We have a first delivery which delivers price first to an easy draw (roadblock first if any)
5. We have a second delivery which created a higher high - that how we want price to deliver
6. We have the sell program that has already ended therefore shorts are not in our radar at the moment
7. We have a higher timeframe draw as the daily mitigation block low and the H4 buyside liquidity

BULLISH POTENTIAl - 1000RATSUSDTSupport and Fibonacci Confluence:
The price is consolidating near the 0.382 Fib level (0.10471), which often acts as a significant retracement support in a bullish continuation setup. This zone can provide a strong launchpad for further upside.
Upside Potential:
First target (TP1): The Fib 1.0 level (0.17383) aligns with a key resistance zone from the past. This is a logical area to secure partial profits as the price may face sellers here.
Second target (TP2): The Fib 1.618 extension (0.24295) is the next major resistance level, offering a strong reward-to-risk ratio for holding a portion of the position.
Stop Loss Placement:
The stop-loss is set at 0.06199 (Fib 0 level), below the swing low, ensuring the setup remains valid unless significant bearish momentum invalidates the structure.

Rats/Usdt Plan Watching 1000 Rats (USDT) for a potential breakout from a symmetrical triangle pattern. A successful breakout could lead to a bullish move. Keep an eye on it, but do your own research as this is not financial advice.

1000RATS/USDT - Short Trade REPOSTED CUZ I BRAKE SOME RULES OF TRADINGVIEW
✉️ Pair: 1000RATS/USDT
📈 Direction: Short
💯 Leverage: Cross 5x - 10x - 20x
📊 Entry: 0.1082
✅ Target 1: 0.090000
✅ Target 2: 0.083000
✅ Target 3: 0.07700
✅ Target 4: 🚀🚀🚀
⛔️ Stop Loss: 0.12864
🔔 For more updates, follow me and don`t forget to hit the BOOST :D

1000 rats full chartThis is an experimental chart using a method that I developed over 6 - 7 years. The circles act as targets and magnets for the price also as support and resistance.
You also have diagonal trendlines with channels. each channel has an upper limit that acts as resistance, a lower limit that acts as support and a middle area.
The trendlines will direct the price in one direction and sometimes it can breakout of the downtrend and uptrend and reset to the reversal targets.

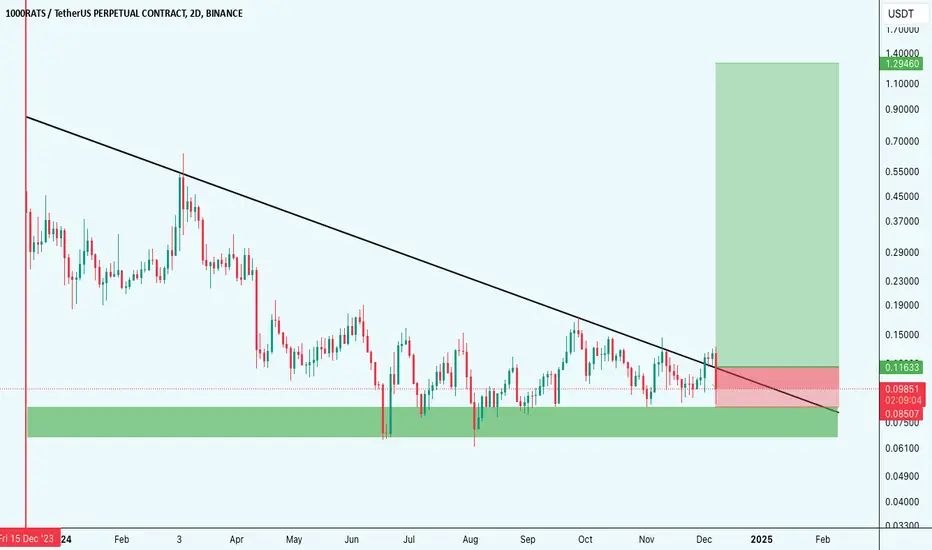
RATS looks BullishGiven the bullish mCH on the chart and the strength of the bullish candles, it seems that the price could rise to the red OB range.
The target is the red box of OB.
Closing a daily candle below the invalidation level will violate the analysis
For risk management, please don't forget stop loss and capital management
When we reach the first target, save some profit and then change the stop to entry
Comment if you have any questions
Thank You
