10yryields

10 yrThe 10 yr has pumped on H4 touching WTIC blue line, I think the next move will be to the SP500 line in orange, this would be very bullish for all risk on assets.

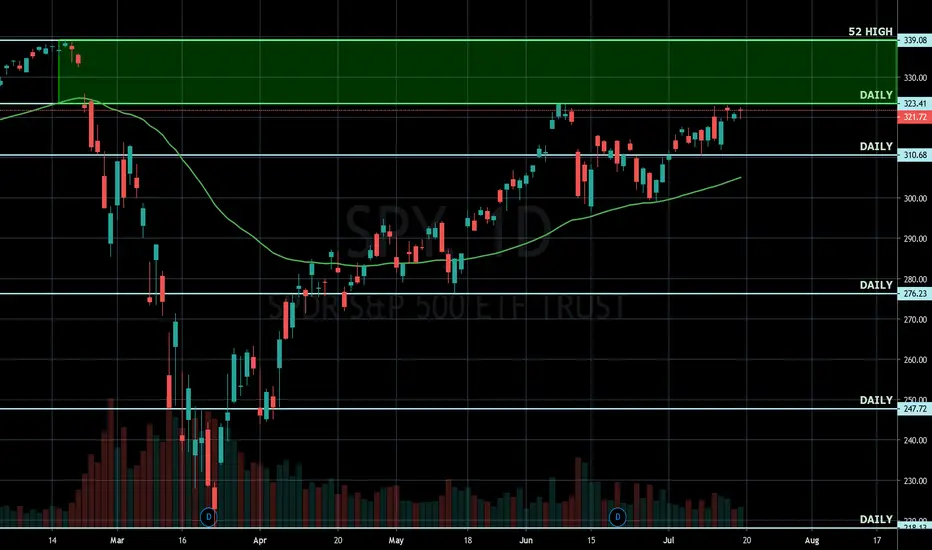
$SPY New 52 Highs Towards Re-ElectionAfter watching the Fox interview with POTUS. He seems almost confident the market will be seeing all-time highs leading to November. The dollar ( DXY ) has been weakened, TVC:USOIL still getting bids, and TVC:TNX closed higher. The market has usually been used to manipulate the real economy, and with NYSE:AZN phase 1 data due tomorrow... this could be the catalyst to push higher.
Warning: Anything can happen and this market is currently in a euphoric trance. But politics aside, the market is all this administration has.

Is the relationship between the yield curve and SP500 dead?Looking at the TVC:US10Y - TVC:US03MY and the AMEX:SPY it seems that during a recession like this TVC:US10Y - TVC:US03MY should rise and AMEX:SPY should fall.
Will it be the case this time as well or is this time different?
Maybe the FED cannot allow TVC:US10Y to rise this time due to the amount of debt and will instead impose yield curve control like in Japan by printing money to buy TVC:US10 ?

10 yrConclusion is:
Bond market seems to think this pump in the stock market is suspect. 10yr should rally up to .80 zone if investors were actually risk on.
I am just keeping an eye on DXY, 10yr, WTI at this point as they r all showing mixed conflicting signals.
DXY looks to have slightly more downside B4 reversing up (only question is how strong)
10 yr looks to be showing me that bond investors don't feel that this pump in stocks are worth the follow thru.
WTI RSI looks destroyed and could get a bounce but the shale stocks OAS WLL not showing any signs of buying pressure & also have lost bottom TL or are loosing the bottom TL. When the bounce comes to WTI if there is no volume or follow thru on the bounce I would expect that to be a scam.
I think that the markets have entered bear market territory late June into July & we are at early stages of the new trend. Unless WTIC can get the mentioned volume buyers I think we are better off watching for now.

10 yrThis looks bad to me, either 10 yr will pump here (which seems unlikely) or the SP500 will crash together with the 10 yr.
this would put the SP500 around 2750 area. OUCH!

10 yryields appear to be breaking out and stock markets are pumping, I am watching for the top in this move for a possible short entry.

10 yrhourly chart selling off hard but looks like bottoms just about in. with H4 D1 looking bottomed as well I'm thinking next week bulls will make a real comeback in the stock market, especially energy sector WTIC looking strong.

10 yrGuys just so you r all aware. There will be no bear market, they have been canceled indefinitely.
Every-time any of you think about getting into bunker and hoarding food, gold bars or paying Peter Schiff Harry Dent or any of the fear mongers just look at my chart. In fact burn it into your brains. Stock always go up. Just buy buy buy. So easy


Italy 10Y Bond YieldI expect 10yr Italian Govt Bonds Yields to slowly drop toward area 1,05/1,13 thanks to the purchase program of ECB. They shall not skyrocket again until next government crisis, or Covid return, or major problems of the EU.

Bullish market, but price correction due in stocksHello.
The bond market has given us clues that parabolic run in to stocks is coming to an end, we are likely to see a pull back in stocks.

US 10YR Bond Yield - Wave 3 Has Commenced - Tracking Minor WavesAfter the breakout we had a retest of the descending trend-line and now I am expecting this to continue higher min wave iii.
Still looking for a break above 1.28.
I am tracking the Bond Yield because of the ramifications it will have on global interest rates.
I am expecting Interest Rate s to start making their way up to 20%+
Please LIKE and FOLLOW to get notification of updates and future posts.

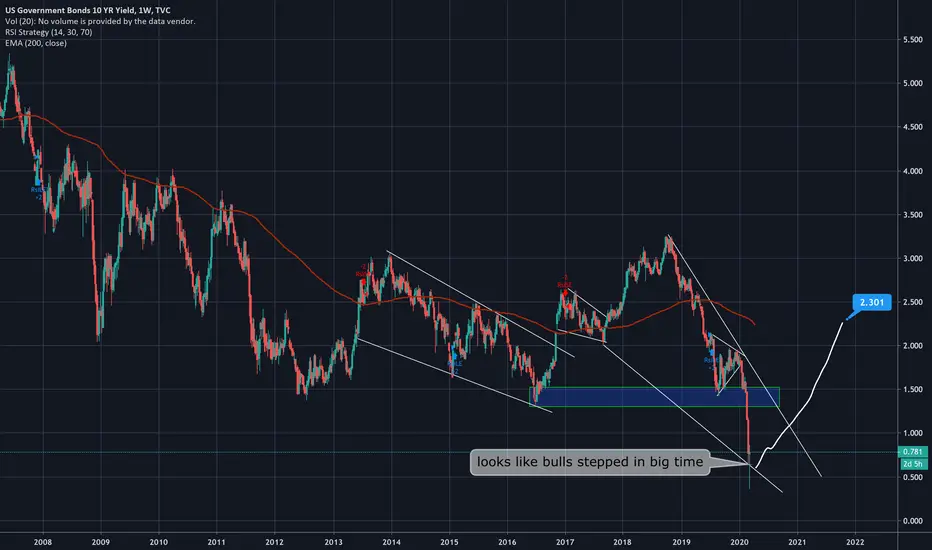
Bond Yields Birds Eye View - General OverviewThis looks like a possible bottom in the bond yields aka interest rates.
Yet another ending diagonal.
Waiting for a couple more confirmatory waves to form before I post an update.


US 10-year yield could retest former low of 1.34 pctThere is a map of a consolidation for US 10-year yield.
The range is quite volatile between 1.50 and 2.00.
The wave B should complete with a drop to the 1.50 and then wave C could unfold up to 2.00.
After that the drop should resume to retest 1.34.

Reinversion of Sovereign Debt Yield Curve (10YR-03MO)10's minus 03 Mo's Reinversion of Sovereign Debt Yield Curve
19:34:22 (UTC)
Thu Jan 30, 2020

Gold Indication of Market Retrace :: 10YR Yield and S&P 500This post was encouraged because of the Economic Forum being held in Davos, Switzerland.
The last 3 years (roughly since mid 2017) contained talk around trade war. This has caused chaos within the markets. We have moved up and down 1000's of points with no specific direction.
It seems that September 2019 has shown the true colors of the market sediment. We can identify the percent returns of the 10YR yield, gold and S&P 500 from this date. Things have not been adding up and has been blurred by the DOW hitting new highs every other week, misleading investors.
Nobody is saying to liquidate but a rotation of wealth is underplay. I do believe that this is a rotation of wealth that is not our normal move into commodities/metals but potentially something larger.
Impeachment trial proceeds today during the start of the Economic Forum. Is this to sway attention towards Davos? We will never specifically know until everything pans out.
The chart speaks for itself with presenting the data.
I would like to hear anyone's thoughts, ideas and/or theories.

Further Easing may be required means possible lower yields TLT should move up with yields going down from monetary policy

Elliott Wave View: Ten Year Notes (ZN_F) Resumes HigherShort Term Elliott Wave structure in 10 Year Notes (ZN_F) suggests the pullback to 129.28 ended wave IV. The note has resumed higher in wave V. The internal subdivision of wave V is unfolding as a 5 waves impulse Elliott Wave structure. Up from 129.28, wave 1 ended at 131.19 and wave 2 ended at 130.26. Internal of wave 2.
The Note has resumed higher and broke above wave 1 at 131.19. This suggests the next leg higher in wave 3 has started. Near term, while pullback stays above 130.24 in the first degree, and more importantly above 129.28, expect the Notes to extend higher. We don’t like selling the Note, and expect buyers to appear once wave ((ii)) pullback is complete in 3, 7, or 11 swing.
*Please note that market opened up with a gap*

US 10Yr Decision TimeIf you aren't following this chart you are doing it wrong, the proverbial canary in the coal mine #Study #TradingEducation #Forex #Dollar
