1,2,3 Confirmation PatternWhat does it consist of?
It consists primarily of 3 candles, and the fourth one is where we will enter the operation. In a bearish scenario the High of 2nd candle must be higher than the high of the 1st candle. The high of the 3er candle must be below the high of the 2nd candle. The 4th candle must re test the point of origin of the 3er candle.
How can you use it?
It is extremely important to complement and use this with a strong idea of where the price is heading. To know where the price will move, we need to understand that it moves towards the most liquid areas. The most liquid areas can be the unfulfilled Daily, Weekly, or Monthly lows and highs.
Where should you place the entry?
You should wait till the 3er candle close and place the entry at the point of origin of the 3er candle.
Where should you place the stop loss?
The stop loss should be above the 3er candle.
Important
I use this technique in D,W and M timeframes. After establishing a bias I look for the pattern. After the 3er candle is complete I move to 1hr or 15minutes to find the point of origin of the 3er candle.Then, I place the order.
123pattern


gbpchf h4 longHi everyone
Since the price in the high timeframe has an uptrend, we can correct the recent downturn and trade in the uptrend.

gbpusdlongOne possible uptrend for the pound is the formation of a diamond pattern.
.
If this pattern is formed and the initial reaction is appropriate, we can make a long position

GBPUSD LONGThe price has reached the demand zone in high time frame.
.
After hunting the previous support, showed a good reaction.
.
We expect the price to rise in the coming weeks.

nzdusd w1Hi everyone
Nzdusd is expected to lower its price in the area and start a big uptrend.
In this scenario, the market can follow the Diamond logo, which is a return pattern.


EUR/USD:SHORT TERM PRICE ACTION ANALYSIS|ABC PATTERN|LONG 🔔Short term Analysis on EUR/USD , show an Reversal 123 Pattern with Oversold Stochcastic and New Bullish Ichimoku cloud .
Check also our Hight time frame Idea to have a Clear Idea.
Link in Description.


ELEKTA analysisLong positions can be taken.
Break of a symmetrical triangle and retested
Prices are above 200MA
123 trend change

Fagerhult analysisLong positions can be taken based on:
123 Trend change
Inverse head and shoulder pattern (retested)
Prices above 200MA
Strong RSI

HAVELLS analysis on a daily timeframeLong positions can be taken:
- 123 trend change confirmed above 621.60
- Strong RSI
- Above 200 periods moving average
Enter above 668 or let the price touch the trendline first and then look for a bullish candle.

DCM analysis on daily and weekly timeframeTrend change confirmed at 21.85 based on 123 trend change criteria.
Ascending triangle is broken.
The stock is above 200 MA
Next entry above 23.75
Target around 32.
Good luck!


Uptrend Looking to ContinueThe longer term uptrend that has been in place with this pair since March of this year is now looking to continue.
As the daily chart shows; price is now looking to test a crucial daily resistance level.
Whilst price is in an overall trend higher, in the shorter term we have a bearish 1,2,3 reversal pattern that has formed to the downside.
That is where this level comes in. Price is now testing the swing low of the ‘1’ leg.
If this holds as a resistance, then we could look for a new short term trend lower to begin.

Key Resistance Coming Into PlaySince March of this year this pair has been in a roaring trend higher.
However, in recent weeks price has been attempting to make a reversal with a 1,2,3 pattern on the daily chart.
The level price is now pushing back into looks crucial for this pair.
For any potential reversal lower this level will need to hold as a price flip resistance.
If we can see that price action play out, then we can look for a move back into the recent support with a potentially bigger leg to come.

Potential 1,2,3 Reversal Pattern in PlayPrice on this pair is in the last stages of attempting to form a 1,2,3 reversal pattern.
After forming the lower high, price is now looking to test the daily chart support level.
If this level breaks and the 1,2,3 pattern gets confirmed, then all the momentum would be lower.
This would open the way for a lot of potential short trading opportunities.

Long-term trade on GBP/JPY - TEXTBOOK EXAMPLEHello traders,
in my trading I also watch some currency pairs and a very nice opportunity came up on FX:GBPJPY .
In March we could see a rejection at a very strong support and since then a 1-2-3 pattern developed on the weekly chart. This is actually a textbook example of this pattern. Take a look :-)
1-2-3
- at a strong support
- edge of the value area
- false breakout and rejection of lower prices
Also we have enough space to put the profit target at the Point of control which is an area likely to be tested.
Are you in this trade with me? ;-)
Good trading!
John
FINEIGHT Team

HSI | bearish 1-2-3 reversal pattern
the strong red bar that broken the wedge a few days ago signaled the start of 1-2-3 pattern
at point 3 today, it will be an strong engulfing pattern
it is also a false breakout of 1) horizontal resistance, 2) a long-term downward trendline and 3) 50 SMA
I have three indices in mind: NASDAQ > SP500 > HSI, and HSI is always the weakest candidate for short
China's failure to obey trade deal could be the fundamental catalyst for this selloff

Dollar Index | bearish 1-2-3 pattern with engulfing reversal
the broken ascending trendline signled the start of 1-2-3 pattern
enfulfing candlestick at point 3 confirming the strong reversal
the enfulfing pattern also false breaks a major resistance
the 4th times 50 SMA was broken, this time seems real

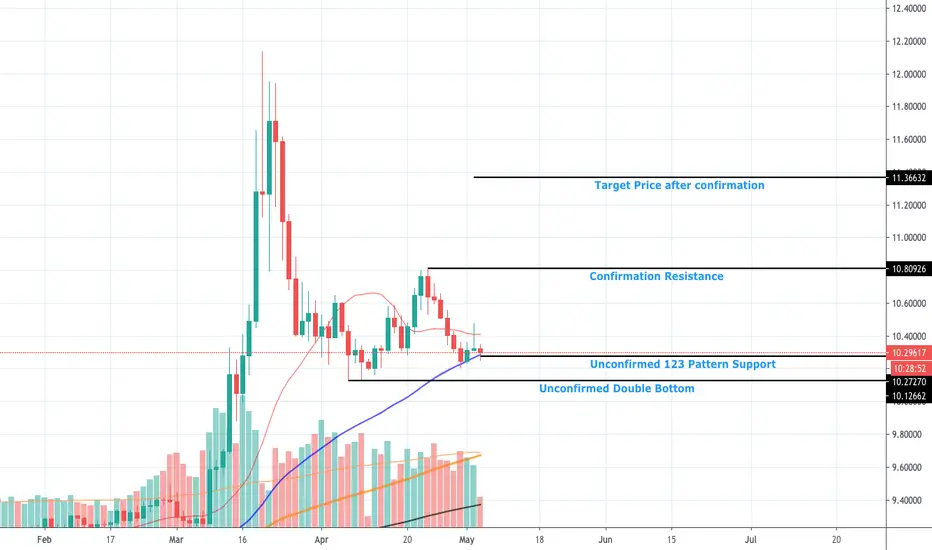
USDNOK LongIt is forming unconfirmed 123 pattern. Needs to break confirmation resistance to reach the target price.
GOLD - Daily - 1-2-3 PatternI don't have much experience or confidence trading this sort of pattern 1-2-3. So not going to be taking a trade, but wish to note it down as part of my back and forward testing of this pattern to see if it offers any edge.
Decided to publish in case if anyone out there is interested in this sort of pattern.
