BTC Broke the downtrendCRYPTOCAP:BTC has broken a descending trendline and is pushing toward the mid-range resistance at 119,500. Above that sits a liquidity pocket at 121,000, with the range high at 123,250.
Momentum signals on higher timeframes remain bullish, with accumulation patterns in place, but lower timeframes show bearish RSI divergences, suggesting the potential for a pullback before continuation.
Bullish scenario:
Hold above 117,000 – 117,454 (4H Bull FVG) keeps bullish momentum intact.
Break and close above 119,500 sets up a liquidity sweep at 121,000.
If momentum sustains, an extension toward 123,250 (Range High) becomes possible.
Bearish / Invalidation scenario:
Rejection from 119,500 followed by a break below 117,000 could pull price back toward 115,750 (Range Low).
Loss of 115,750 exposes deeper retrace into 1W Bull FVG 110,655 – 115,900.
Trading plan:
Watch for breakout + retest of 119,500 to target 121k.
Take partial profits into 121,000; leave runner toward 123,250.
Protect downside if price loses 117,000.
1d

XLM Price holding multi-TF Bull FVGCRYPTOCAP:XLM is trading inside a multi-timeframe Bullish FVG cluster (0.40 – 0.4368) with confluence from 1W, 1D, and 4H charts. Price is holding above POI that previously triggered bullish continuation.
Bullish scenario (#long):
Accumulate within 0.42 – 0.41 zone.
Breakout above 4H Sell FVG (0.44 – 0.46) confirms upside momentum.
Progressive take-profits: 0.5206 → 0.5606 → 0.6081 → final at 0.6374.
Bearish scenario / Invalidation:
Breakdown and close below 0.41 shifts bias to bearish, opening path to deeper retrace toward 0.36 and potentially re-testing lower 1W Bull FVG levels.
Trading plan:
Entry: 50% at 0.42, 50% at 0.41.
Stop Loss: Below 0.41.
Take Profits: As per targets above.
Bias: Bullish while price remains above 0.41.

Tesla Breakout? For the majority of the calendar year TESLA has been in a range between $220 - $365 with a clear midpoint of $295.
From March to the beginning of May TESLA bounced between range low and the midpoint until finally breaking through into the upper half of the range where it has stayed ever since. However, there is a clear diagonal resistance level that is preventing higher highs.
So will TESLA breakout, or will it lose the midpoint? Structurally it is clear that the bulls have a set level they are happy to buy at (Midpoint) but the bears are getting more aggressive with their selling, hence the lower highs. This compression inevitably leads to an impulse move but the direction is not so clear.
Bullish scenario: A clean breakout with volume that makes a new higher high, signaling a shift in structure. A pullback and retest of the breakout would be an ideal opportunity to go long and aim for that range high before expecting resistance.
Bearish scenario: The lower highs keep printing until the midpoint is lost and price accepts below it, that would then signify to me the new trading range is between Range Low and Midpoint.
The fakeout scenario is a risk but with price so close to the midpoint already it follows the same invalidation criteria as the bullish scenario, the midpoint is vital to both sides.

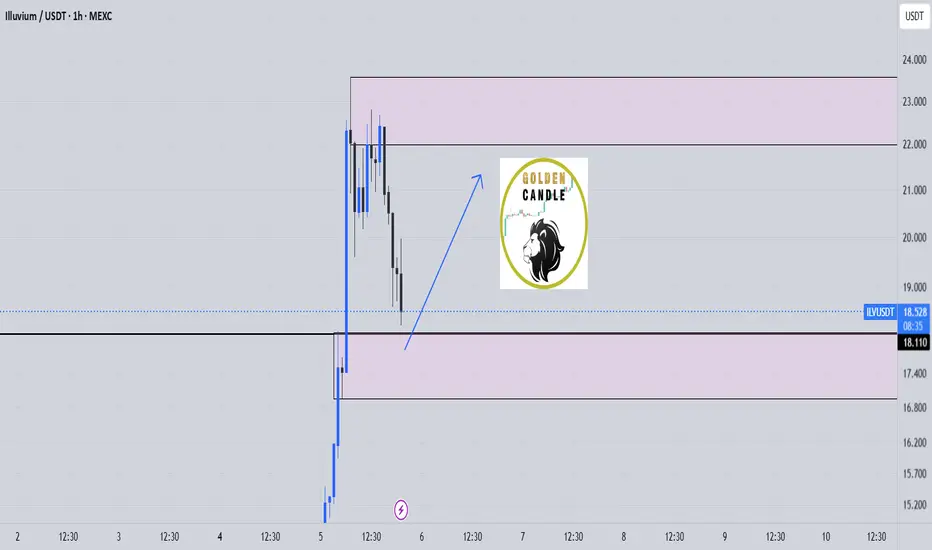
ilv buy midterm"🌟 Welcome to Golden Candle! 🌟
We're a team of 📈 passionate traders 📉 who love sharing our 🔍 technical analysis insights 🔎 with the TradingView community. 🌎
Our goal is to provide 💡 valuable perspectives 💡 on market trends and patterns, but 🚫 please note that our analyses are not intended as buy or sell recommendations. 🚫
Instead, they reflect our own 💭 personal attitudes and thoughts. 💭
Follow along and 📚 learn 📚 from our analyses! 📊💡"
BTC – Still looking heavy below key resistanceDespite a short-term relief bounce after Monday’s drop, BTC remains below the critical 1D MSS + S/R (red box). Structure is weak until this level is reclaimed. Bears remain in control as long as price can’t close above 115.7k.
Plan:
Maintain bearish bias while below the red box — expecting new lows, targeting the green demand/OB cluster around 108.3k.
Flip the red box (close above 115.7k) and the outlook shifts to neutral or bullish.

ARB – Critical Support ZonePrice is retesting a major support at $0.363. This level has acted as a strong pivot multiple times in the past, providing both support and resistance. Bulls need to hold this zone to avoid a deeper retrace. Below it, next support is down at $0.264.
Plan:
• Hold above $0.363 – could see a local bounce and retest of $0.44–0.50 resistance
• Lose $0.363 – opens the way for a larger flush down toward $0.26
• No setup for longs if we close below support — would flip bias to short on breakdown

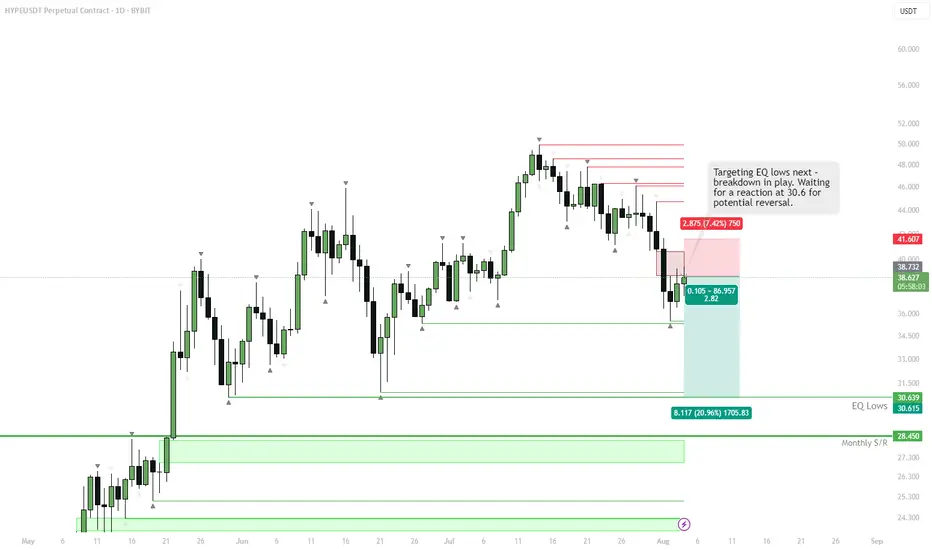
HYPE – EQ lows next Local breakdown confirmed after losing support, with no clear reversal signal yet. Structure favors a continued move lower toward the equal lows around 30.64. Momentum is still to the downside, so no reason to anticipate a bounce early.
Plan:
• Main target: EQ lows zone (~30.64)
• If monthly S/R at 28.45 doesn’t hold, further downside opens up
• No long setups until a reaction and reclaim of a key support
BTC | Swing Plan UpdatePrice failed to break out above 1D supply and sharply rejected, losing key 4H demand at $117,300.
HTF demand at $109,000 (1D FVG + BOS + S/R) is the next major area of interest—this is where I’ll look for fresh swing setups if the market flushes further.
No need to rush new positions until a clean setup prints or levels are reclaimed.
Plan:
Wait for price to test $109,000 zone before considering a swing long.
Only consider LTF scalp longs if we reclaim the 4H BOS at $118,300.
Stay flat until high-probability entry, let the market show its hand.

SUI | Spot Buy Zone for PullbackPrice has pulled back after a local top and is heading toward a clear demand zone.
Key buy area sits around $3.12, aligned with 0.618 retracement and recent consolidation.
Strong structure below—if majors keep retracing, this is where risk/reward for new spot buys becomes attractive.
Plan:
Waiting for price to reach the green zone to accumulate spot.
Invalidation below $2.80, targeting a move back toward $4.45 and higher if momentum returns.

HYPE | Sweep & Reclaim SetupPlan:
Watching for a sweep into the blue H4 Untapped Demand zone, then a reclaim of 41.237 (green line) to add longs.
Ideal target: new ATH and 55 extension.
If the blue zone fails or we can't reclaim 41.237, risk-off mode: equal lows at 30.6 could be the draw.
Reasoning:
A sweep into demand would reset local liquidity and trap late shorts.
Reclaiming 41.237 confirms a shift in momentum and invalidates the breakdown.
Structure is bullish above 41.237; below, risk increases for deeper downside.

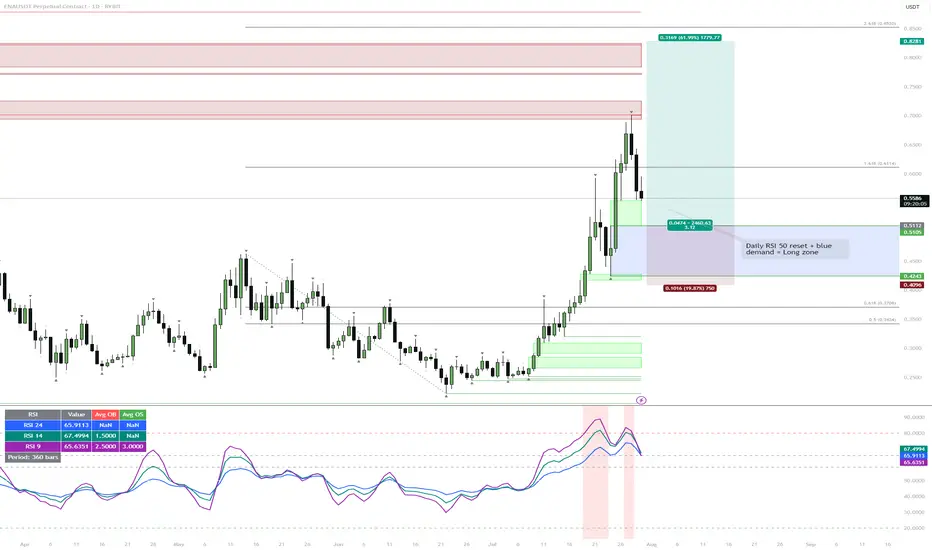
ENA | Waiting for the Daily RSI 50 ResetWatching for price to drop into the blue demand zone while the daily RSI resets to the 50 level. If both conditions align, that's the next high-probability long setup.
Reasoning:
Strong rally has left RSI elevated, so a cool-down is likely.
The blue zone lines up with the prior breakout and consolidation, so it's a logical area for buyers to step in.
A confluence of demand and neutral RSI usually provides the best R:R for trend continuation.
TAO | #1D — One More Leg Up Before Major CorrectionStep-by-Step Scenario:
Current Context:
Price is consolidating above the 373–382 support (blue box) after a strong impulse from June lows. This zone aligns with a major HTF demand and retest of the recent breakout.
Expected Move:
Base Case: Holding the 373–382 zone triggers a new leg higher toward the $500 supply area.
Upside Target: $500+ (main target), with interim resistance at $440–460.
Trigger: Look for strong 1D closes above 401 for confirmation, or a quick dip and reclaim of 382 for entries.
Timing:
Expect the final move up to play out into late August. Watch for momentum and trend exhaustion as we enter September.
Major Correction Risk:
If price stalls or forms an SFP at $500 or in upper supply, look to reduce exposure and prepare for a multi-week/month correction.
Breakdown below 373 (especially daily close) invalidates the bullish scenario and may accelerate a correction back to 320–260.
Why:
The market structure remains bullish above support.
Still running on strong narrative/momentum, but approaching key supply zones and cycle timing.
Macro risk: Many alts (including TAO) could top as Q3 ends, mirroring historical cycles.

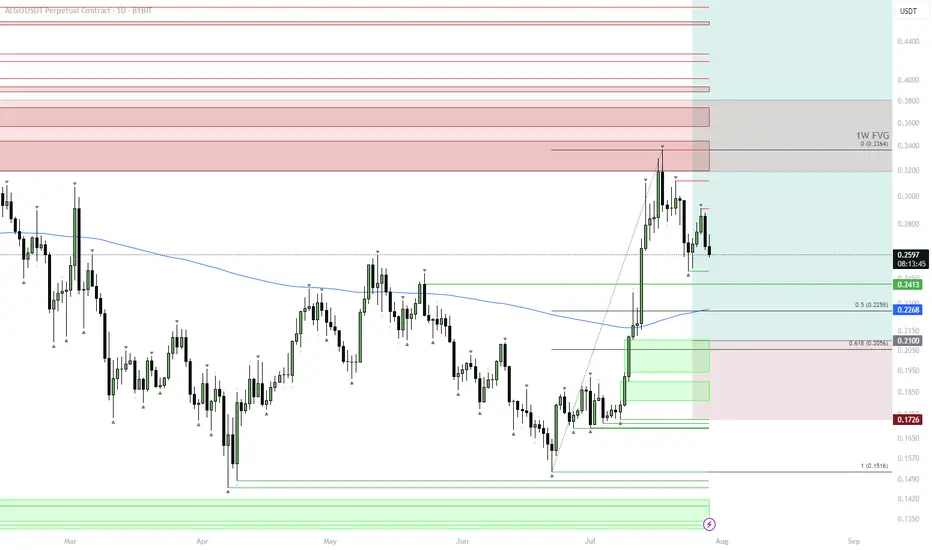
ALGO | #1D — Building the Spot Position LowerALGO has completed its first local move and is now retracing toward key support levels. The price remains under the 200DMA and is heading into the first cluster of demand zones.
Step-by-Step Price Scenario:
Initial Support: Watch the 0.2413–0.2268 zone — this is the first area to scale in spot buys.
Main Accumulation: If price drops deeper, the main spot buy window is $0.22–0.20 (0.5–0.618 retracement of the recent rally and the main demand block).
Invalidation: Breakdown below $0.1726 would invalidate the spot strategy and suggest deeper downside.
Bullish Confirmation: A strong reaction from either of these support levels, followed by reclaiming the 200DMA, would set up the next move toward $0.33–$0.35.
Why this plan:
Buying spot on pullbacks into HTF demand with clear invalidation below keeps risk defined, and the current market structure allows for compounding if the trend resumes.
SEI — Breakout & D1 OB Target1. Support 0.33–0.36 holding
2. Entry after SR breakout
3. Target: D1 OB 0.47–0.54
4. Stop below 0.33

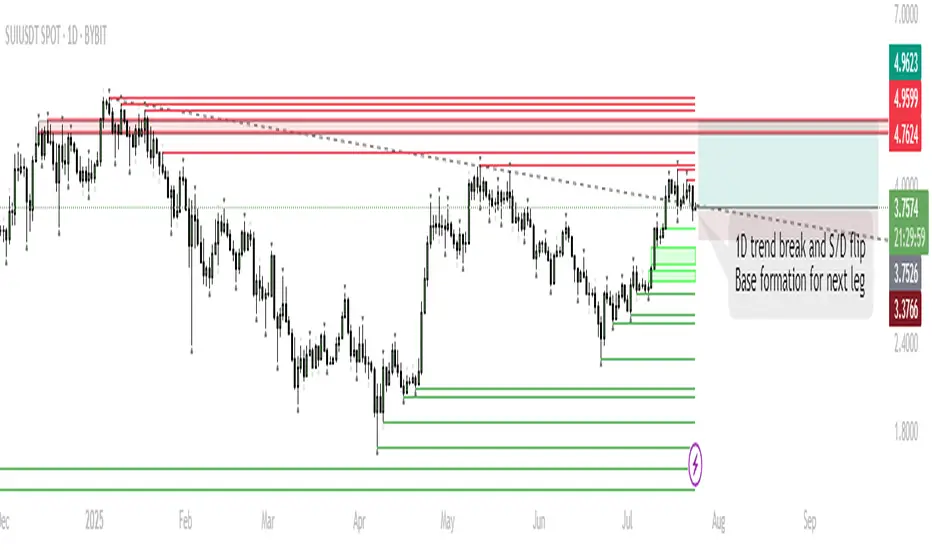
SUI – Base Formation for Next Leg HigherTrend Shift:
SUI has broken the 1D downtrend and is now consolidating above a key supply/demand zone, suggesting accumulation.
Short-Term Range:
Expect ranging/chop as price tests acceptance above broken resistance. This phase could last up to a week.
Trigger for Next Move:
Sustained closes above $4.0 will signal buyers are in control, opening the way for a move higher.
Targets:
If the base holds and SUI establishes above resistance, the next push is toward $5.10–$5.40 (previous highs/ATH zone).
Invalidation:
A sustained move below $3.37 would invalidate the bullish base thesis and open the door for deeper retrace.
SUI has flipped its 1D trend and is now consolidating above a key S/D level. Historically, such consolidations above reclaimed resistance often precede strong trend continuation. While a short-term range is likely as the market digests recent gains, the structure favors an eventual push toward previous highs and potentially new ATHs in August. Patience during this ranging phase is key; the setup remains bullish unless price falls back below $3.37.
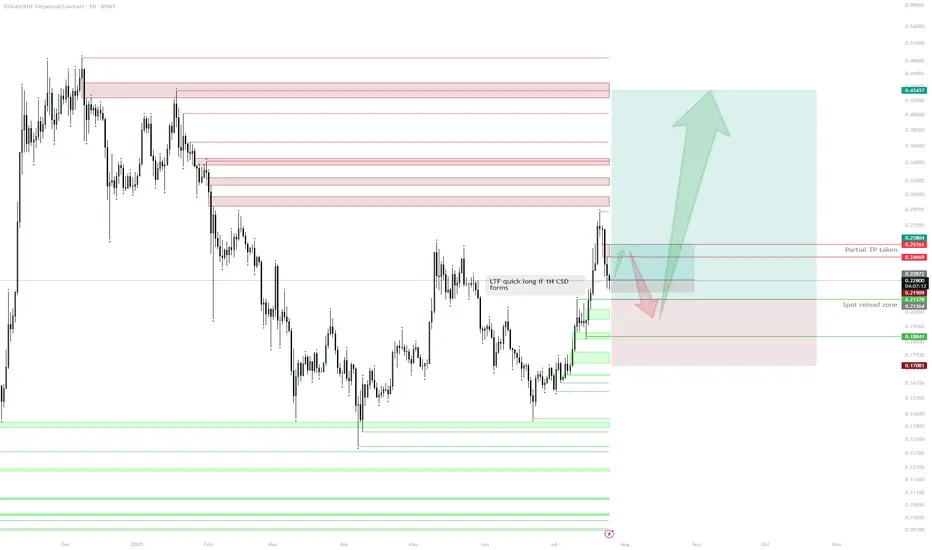
DOGE – HTF Plan & Spot Reload ZoneSpot Position & Realized Profit:
Spot position held from the $0.19 sweep.
Previous long from demand taken and partially realized at $0.26, de-risking the core position.
Current Structure:
After reaching resistance ($0.26–$0.27 zone), price is retracing.
Daily demand/support sits around $0.20–$0.21, with multiple confluences for spot re-accumulation.
Immediate Plan:
Waiting for price to revisit daily demand ($0.20–$0.21) to reload spot and/or open fresh longs.
Watching for a possible lower timeframe (1H) bullish confirmation (e.g., 1H change of structure/1H CSD) as a trigger for a tactical long before daily demand is tagged.
LTF Play:
If price prints a 1H CSD, a quick long up to daily imbalance ($0.24–$0.25) can be considered.
Invalidation:
Loss of daily demand ($0.188) would invalidate the bullish scenario and require re-evaluation.
Upside Target:
If demand holds, looking for moves back into daily supply/imbalance, with ultimate HTF targets at $0.26, $0.32, and higher.
Reasoning:
The core plan is to build spot exposure at strong demand after de-risking on the first move up. The context is that DOGE has shown willingness to bounce at major demand, and with realized profits in the pocket, risk can be managed comfortably on new entries. Short-term, LTF confirmation (such as a 1H CSD) can offer a tactical long back into daily imbalance before the main reloading zone is tagged. Patience and precise triggers are key—no need to rush until price action confirms.
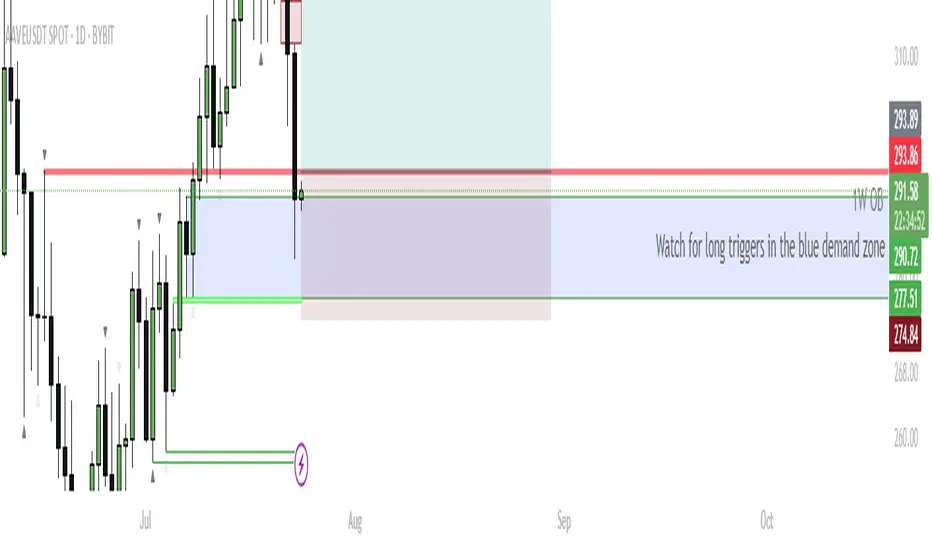
AAVE – Eyeing Reversal From Daily Demand for $400 TargetCurrent Structure:
AAVE recently rejected from 1M S/R at $332.54 and pulled back into a confluence support zone—overlapping 1W order block (OB), 1D OB, and previous resistance now flipped support ($277–$290 zone, marked blue).
Buy Zone:
Watching the blue box area for bullish reversal triggers. This is a high-probability demand zone due to multiple timeframe confluence.
Trigger:
Wait for a bullish reaction/candle confirmation inside the blue zone. Ideal scenario: bullish engulfing, sweep of the low and reclaim, or a strong bounce with rising volume.
Targets:
Primary upside target: retest of the 1M S/R at $332, then continuation toward $400 if momentum sustains.
Invalidation:
If price closes below the 1D OB ($274.84), long setup is invalidated—risk of further downside increases.
AAVE is testing a major support confluence zone, combining weekly and daily order blocks. This area previously acted as resistance and now presents a strong demand zone. If bulls defend this zone and trigger a reversal, there’s a clear runway back to previous highs and potentially $400. This setup offers a favorable risk/reward profile with tight invalidation.
ETH — Perfect Long Play: Pullback & 1W Breaker Reclaim
After the strong move, price is likely to retrace as longs get trapped and late buyers take profit.
Best scenario: ETH pulls back to the 1W breaker zone ($3,141–$3,456), which previously acted as resistance and could now flip into support.
Watch for bullish reaction and confirmation in the 1W breaker zone.
If support holds, enter long — targeting a return to the range high and then the liquidity zone ($4,108+).
Invalidation if ETH closes below the 1W breaker or loses range low ($2,876) support.
ETH has rallied hard. After such a move, it’s normal for price to pull back and test old resistance as new support. The ideal long is on confirmation of a bounce from the 1W breaker zone, which keeps risk controlled and sets up for a continuation move higher. This approach avoids FOMO and protects against reversal if the breakout fails.

FARTCOIN | Midrange Retest After Rejection from Range HighClassic midrange scenario: defend $0.97 for another leg up, or risk testing the lower demand.

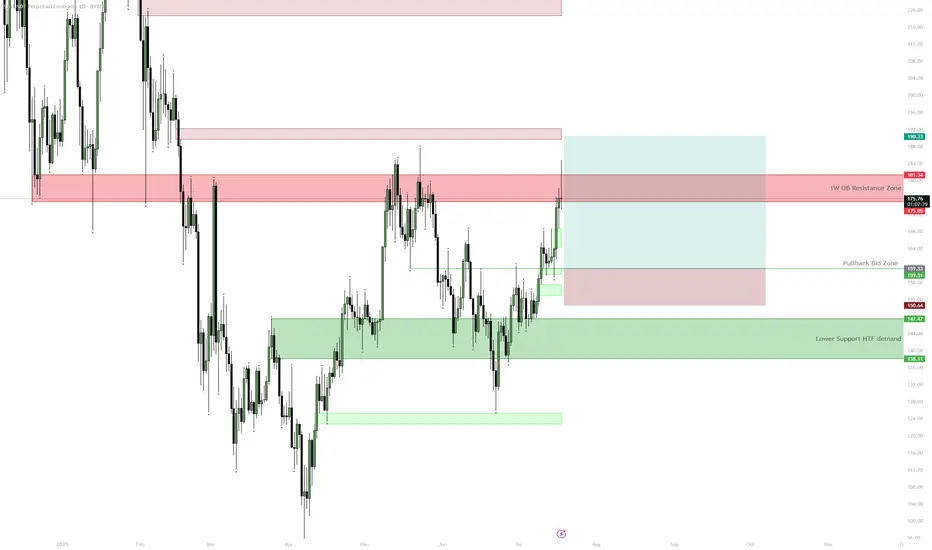
SOL — $180 HTF Resistance | Consolidation ExpectedSOL is approaching a key HTF resistance zone at $175–$181 with 1D RSI close to overbought. Unless price cleanly breaks above this area, a pullback to $160 or even the $138–$147 demand zone is likely before further upside. The setup provides a better risk/reward for longs on pullbacks after consolidation rather than chasing at resistance.
JTO — 1D Trend Breakout & MSS Hold1. Buy zone: 1.86–1.95 (hold above 1D S/R + MSS)
2. Entry: after trend breakout + MSS confirmation
3. Target: FVGs above, full tp 2.78
4. Stop: below 1.76

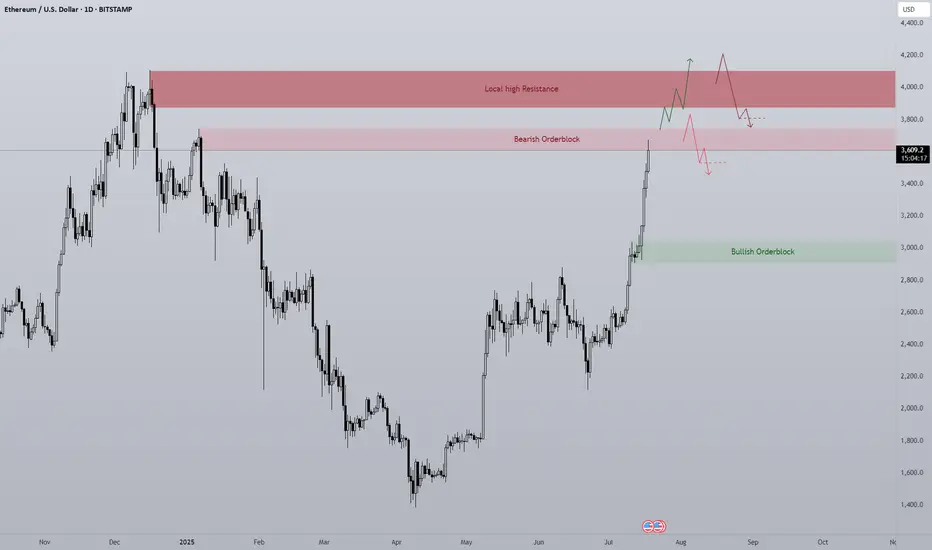
ETH 1D Overview Finally we are seeing altcoins regaining lost ground on Bitcoin and the second largest crypto by market cap is rallying strong.
Since ETH has such strength currently the opportunity to short is quite slim with high risk, however I think it's important to see where ETH may find some resistance or if a pullback was to happen, where would it come from?
The first level is the bearish orderblock level that has just been tapped as of writing. This area previously began the sell-off at the end of 2024 by confirming a new lower high. Naturally this area will present problems for the bulls and so a potential pullback could be initiated from this level. I would like to see a sweep of the stop loss positions just above the area and then a SFP to confirm the pullback is in motion.
Should the bearish orderblock fail the next clear level is the daily local top around $4000. A big even level and the area that started 5 months of downtrend. IMO the most likely level where longs will take profit. I do think if we see any form of consolidation between the bearish orderblock and the local high the bulls will look to carry the rally on, shallow pullbacks maintain momentum
Ten out of the last eleven days have been green candles with the only one day being red just above a key high, I expect if we are to get a pullback that bullish orderblock area ($2900-3000) to be retested as support. Therefor if any of the above areas initiate a pullback this area should provide support and therefor a long entry.
To clarify I am in no way bearish about Ethereum, this is just a plan for different eventualities.
CRV - Two Scenarios for Strategic Spot BidsBINANCE:CRVUSDT
No FOMO, two clean entries.
Sweep S/R and reclaim EMA 200 — first trigger for spot longs. Equal lows at $0.61 — magnet for liquidity.
Deeper flush to demand = main buy zone ($0.40–0.56).
Stops under main demand.
Plan simple: let the market pick the entry for you.
