ETHUSD 1D RANGE TRADESPrice has been in a range
Volume dropping causing consolidation
ATR and Volatility dropping because candle size is smaller
This is a pattern to look for because traders are getting bored with this consolidation pattern so breakout pending
Wait for breakout candle either long or short to close outside range
Wait for volume bar to be at average line to trade 100% full size
or at 75% of average then trade 50% of size
SL 1.5 x ATR
1d

ETHUSD 1D BITCOIN SIGNAL INDICATOR STRATEGYBitcoin Indicator used on all markets and time frames
Bitcoin Indicator shows entry signal, take profit and has a trailing stop loss

XRPUSD 1D/1H DMI TRADING STRATEGYDMI & RSI were developed by Welles Wilder
DMI has a 0 to 100 range
DMI determines price direction and trend strength
ADX line is non-directional. Determines trend strength regardless of trend direction
When ADX is upward trend is strong. Doesn't matter if trend is up or down
DMI + measures strength of an upward bullish move
DMI - measures strength of a downward bearish move
When Price goes up DMI + is above DMI -
When price goes down DMI - is above DMI +
We use DMI + or _ to gauge direction
WE use ADX to measure strength of trend
When - is above + bearish downward trend
When ADX is climbing up the trend strength is increasing
DMI Strategy Rules - manually make a 20 and 40 horizontal line in DMI
Day Chart
Step 1 Determine dominant trend of the day - which DMI is on top - wait for ADX to cross below/above 20 level
1H Chart
Confirm which DMI on top matches days trend
ENTER when ADX closes below/above 20 level
SL below/above last swing low/high
TP exit when ADX crosses below/above 40 level

WATCH FOR THE SILVER LINING IN THE CHNA-US TRADE WARCNN Business - The World is on a brink of a Trade War
US impose tariffs on $50 Billion worth of Chinese Exports
Chinese quickly outlined new import taxes on US Products worth $3 Billion
Result is a drop in the Dollar Index
Benefit of this is when Dollar drops precious metal pop
Gold broke bullish out of descending wedge but too late to enter
Silver has given us a candle close above this descending channel with increased volume
Traders were bored with this descending channel chart pattern with decreasing volume bars
Decreased ATR from smaller sized candle bars dropped volatility
Trade War news brought bullish momentum to have a breakout candle close above channel trendline
XAGUSD BUY STOP @ 14.77
Enter two orders
Both SL at 1.5xATR
1st Trade TP 1xATR
2nd Trade no TP
When 1st trade hits its TP move 2nd trades SL to breakeven
Follow Price on 2nd trade with SL to let profits run

DJI - price action analysisDJI is in a downward trend on the 1D time frame. But the trend south is not with great price momentum. It could be a slow burn down.

LTCUSD 1D BITCOIN INDICATOR SIGNAL STRATEGYBitcoin Indicator works on any market and time frame
Bitcoin Indicator shows Entry Signal, Take Profit Signal & Trailing Stop Loss
PM if you have any questions I can help with

SHORT USD/JPY 1D Hi guys,
My name is LILLOMATTE, I have been studying trading hardly for 2-3 months, I'm publishing my analysis in order to have some advice and recommendations to improve my trading experience. Happy to hear your opinions and ideas about it. Feel free to share it!
Leave a like if you liked the analysis and mostly if we reach our profit.
Many thanks
LILLOMATTE

ETHBTC 1D CMF VOLUME STRATEGYStep 1 CMF falls from
+15 to -15 in straight line
Step 2 CMF slowly moves
above zero line & no new
swing highs made
Step 3 Sell at candle close
when CMF breaks below 0 line
Step 4 SL above a fractal high
Step 5 TP your choice - or when
CMF crosses above 0 line

NIKE 1D COLLAPSINGPotential Market Problem with Chinese Tariffs
Market Place - 5 Dow Stocks with High Chinese Exposure with 10% revenues in China
Apple, Boeing, 3M, Nike, Procter & Gamble
Market Realist - 2014 28% Nike shoes sold in China
34% Nike Apparel sold in China
GQ - 2017 19% Nike shoes sold in China
1D chart
Descending Triangle chart pattern
Weekly support levels shown
Triangle bottom and Weekly support level create a support zone
Watch for a candle close below this zone
Watch for a break-hook-go pattern on smaller time frame
Decreasing volume and rising price shows buyers weakening creates a bearish bias

1D PAPA JOHN'S RANGE TRADEPapa John's added Shaq O'Neal to their Board of Directors
This had some positive bullish strength to stock
Price began to fall and created 1st high for range
Company announced their adding to their menu "Organic Veggies"
But Price continued to fall
Price found support and retested the range top
Price broke out of top range with strong volume support but breakout failed
Price returned to range and fell to retest range bottom
Bias is Bearish range breakout because of failed bullish breakout
Watch for a Close below the range bottom w/ volume support

1D PLANET FITNESS BUY ON PULLBACKDay chart shows
1w support level
1w trendline
Day bearish pullback bars
Pullback Buy zone
15m chart shows
1w trendline buy limit @ 69.00
1w support level buy limit @ 68.00

WHY PLANET FITNESS IS THE #1 STOCK TO BUY ON PULLBACKS Start for $1 - Monthly membership is $10 - $20 mo. go to any location
Free T-shirts, bagels, pizza
Clean beautiful gyms
Equipment well maintained - Employees always nice with a no judgement zone
They have dialed in this gym experience
Weekly chart shows they have dialed it in for years
Most of weekly volume spikes are on bullish weeks
People are interested in this chart - volume is going up - volatility is going up
There is a continuous increase in the trend line angle
Anytime your trend line does a dramatic increase like this is called a bump and run.
The bump and run trend line is usually considered bearish but there are strong bullish signs still
Drilling down to 1D chart , notice hugh gap down on May 3rd
Gap down on positive earnings news
Drove down to 15m chart to find where volume spike came from
First few 15m candles drove price back up so gap spike from 1D came from positive moves
Most of the traders want this pair long
When most traders want price to go long you are probably in for a pullback
Price has been pushing up for some time so expecting some consolidation
Watch for an ascending triangle to develop
Sell when you see pullback on reduced volume and volatility
Buy at trend line bounce
If pullback did not come with reduced volume/volatility then enter with smaller size.
Use ATR to determine SL (1.5xATR)and TP (1xATR). When in profit take some off and move SL to break even.

WHAT IS AN ATR RISK REWARD MANAGEMENT PLANWHAT IS AN ATR RISK REWARD MANAGEMENT PLAN
1- Maximum per trade risk = 2%
use a position size calculator
2- Stop Loss = ATR x 1.5
3- 1st TP = ATR x 1
4- Use two positions - each 1/2 total of trade risk (1%)
5- Both positions use hard SL - ATR x 1.5
6- 1st position uses hard TP - ATR x 1
7- 2nd position uses a trailing stop for TP
8- After 1st TP hits move 2nd trade SL to break even
9- Follow stops on 2nd position as it runs
10- Don't double leverage a currency
(buy Ca/J and sell U/Ca don't double up)
11- 1st TP hit but price drops:
use Heiken Ashi changes color exit
12- Price does not hit 1st TP and drops:
if my entry strategy changes direction
then close trade to not hit hard SL
13- Shut down trade before hugh news events

VERGE USD 1D 2 PERIOD RSI STRATEGYStep 1 Add RSI to chart
Change RSI period setting to 2
Change RSI levels to 5 & 95
Step 2 Sell when the 2-period RSI indicator crosses above the overbought 95 level or
Buy when the 2-period RSI indicator crosses below the oversold 5 level.
Step 3 Find appropriate SL
Step 4 Take Profit when the 2-period RSI indicator crosses
Sell-below oversold 5 level/Buy-above overbought 95 level

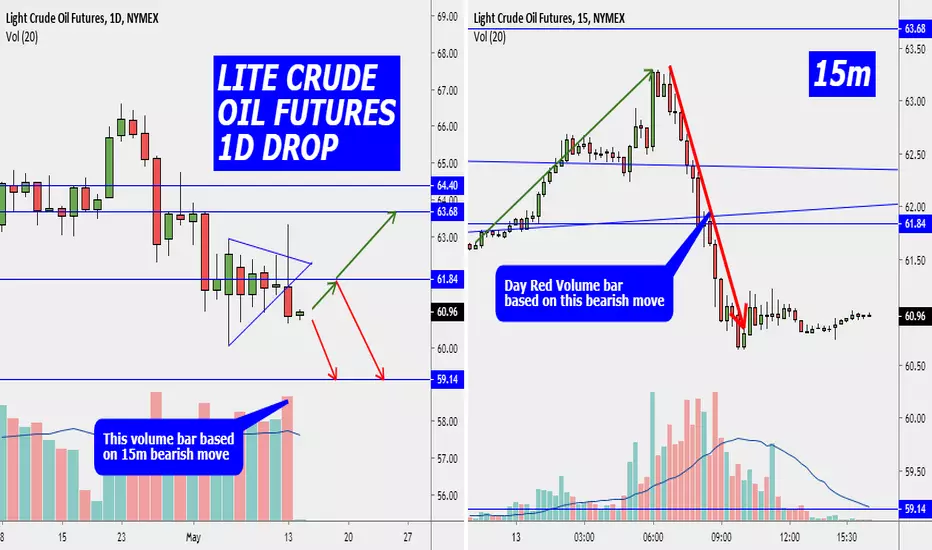
LITE CRUDE OIL FUTURES 1D DROPPrice is in a current triangle pattern
Price tried a bullish breakout and failed
Price closed below triangle trendline
Price could retrace back to bottom triangle trendline
Or Price could drop where it currently is
TP is @ 59.14
Find appropriate SL
BTCUSD 1D TRADERS DYNAMIC INDEX STRATEGY ENTRY RULESTraders Dynamic Index Strategy Entry Rules
1- Red Line break above Yellow Line
2- Green Line break above Yellow Line
3- Neither Line break above Blue Line
4- Buy when Green Line close above Yellow Line
5- SL below SwgLow or 1,5xATR (min 10 pips)
6- TP when Red & Green cross below 70 level

TWO DOUBLE TOP TRADING STRATEGIESFirst - Double Top Pattern Strategy is the traditional method double top strategy
Step 1 Identify the Phase of the Market. The Double Top reversal needs an uptrend.
Step 2 The historical precedent. An A++ Double Top Reversal is composed of 2 Rounded Tops (point A & B)
Step 3 Sell when Double Top breakout candle closes below the neckline (point C).
Step 4 Take Profit equals 2, 3 x times the distance in price as measured from the highest peak to the Neckline
Step 5 Place the protective stop loss slightly above the resistance created by the Double Top reversal
Second - Busted Double Top Pattern Strategy
Step 1 Wait until a Double Top pattern is developing on chart
Step 2 Wait for the price to break downwards and drop below point C
Step 3 Price needs to consolidate below point C
Step 4 Buy after we break and close above the C point
*Note: The clearer the breakout is the higher the probability the busted double top pattern will work.
Step 5 Place your protective Stop Loss below the trading range spotted earlier
Step 6 Take profits during the first 5 – 15 minutes after we break above the double top pattern.
Once Stop Orders above point C are hit high chance of bearish reversal or bullish continuation sometimes

EURUSD 1D WILLIAMS %R STRATEGYThe Williams percent R indicator or %R for short is a technical indicator that oscillates between the value 0 and -100. The Williams percent range indicator provides us with valuable information about the strength or weakness of a trend of a stock, commodity, currency pair, cryptocurrency or any other financial instrument that has attached to it a price.
Basically, the Williams percent range indicator is a powerful momentum indicator that can help you day trade any market in the world.
Williams percent range oscillator can be used in various capacities that can help us determine:
Momentum confirmations.
Overbought and Oversold readings.
Strength of the trend.
Potential buy and sell signals.
When day trading, you need to eradicate all the uncertainty around your decision-making process. This is why we have developed the Williams percent range strategy, a rule based system that will allow you to trade from a place of personal power.
The benefit of our day trading system is that it can be used with any market in the world.
Strategy #2: Day trading Momentum Burst with Williams %R Indicator
As an alternative to using the Williams percent R to identify overbought and oversold market readings, we have developed a way to catch momentum bursts that you will see on your charts every single day.
Momentum trading can offer you instant gratification, and the Williams %R trading strategy can help you satisfy those financial urges.
Let’s get into how momentum trading works using the Williams %R indicator.
Step 1 Add Williams %R indicator onto your chart with a 10 period length
We have also changed the oversold and overbought readings to -90 respectively -10.
Note: Make sure you use 10 periods for the Williams percent range oscillator.
Step 2 Draw a line at the -50 level on the Williams percent R indicator
The momentum strategy is developed around the -50 level.
For a visual representation, and to better and faster identify the potential trade signals, we add a line at the -50 level. The -50 level is the middle of the Williams percent range oscillator range. When the %R indicator crosses the -50 level, it signals a change in the momentum.
Step 3 Buy once the Oscillator moves from oversold reading and crosses the -50 level
There are two conditions that need to be satisfied before confidently buying.
First, we need to see the %R oscillator in oversold territory. We consider a market oversold if it shows a reading below the -90 level.
Secondly, we need to see the oscillator moving away from oversold territory and cross the -50 level from beneath.
This shift in momentum indicates that we can start looking for trade opportunities in the direction the oscillator crossed the -50 level. In our case, we’re looking to buy right away once the momentum oscillator breaks above the -50 level.
Step 4 For our exit strategy and stop loss management, we simply work with the trading range identified during the first step. In this regard, we place the protective stop loss below the support bottom of the range and take profit at the top resistance of the range.

XRPBTC 1D ORB Nr4 Breakout StrategyStep #1: Wait until you can spot a bar that has its daily range smaller than the previous three days
The first rule requires you to have the patience until the Nr4 pattern develops on the chart. When we have a daily trading range that is narrowed than the previous trading ranges it means that the price is contracting.
Based on our backtesting results we have found out that there is a high probability of a trend move after you spot this type of contraction. This is kind of a general rule because the markets do move from periods of contractions to periods of expansion.
This is the reason why this short-term price pattern is so powerful.
Note* The 4th day doesn’t necessarily need to be an inside day, it only needs to have its daily range smaller than the previous 3 days.
Step #2: Mark the High and the Low of the 4th day and switch to the 1 hour time frame
Our trade is taken the next day after the Nr4 pattern showed up. In order to have a clear view of the short-term price action we need to switch our focus to the 1 hour time frame. Before you switch the time frames make sure you mark on your chart the high and the low of the 4th day.
The short-term pattern Nr4 satisfies all the requirements for a valid setup
Step #3: How to buy: Buy only if the breakout of the Nr4 high happens during the first 5 trading hours.
We use the Opening Range Breakout technique to time the market and have an effective trade entry. The ORB is even more profitable if it occurs after inside days that have a smaller trading range than the previous 3 days. Here is another strategy called simple yet profitable strategy.
Our trade doesn’t may not have an inside day, but nevertheless we want to buy only after we break above the Nr4 day high. Also, we want to make sure the breakout happens during the first five trading hours of the next day.
Trades based on the ORB – Nr4 pattern will show you a profit instantly.
Now, if the trade is not showing you a profit right away than your trade becomes more vulnerable. As a general rule, if after the first trading hour your trade is not in the green, you can safely close the trade at the market.
Of course, you can only do that if your stop loss hasn’t been triggered in the meantime.
Step #4: Place your protective Stop Loss below the Nr4 day low
You can hide your protective stop loss below the Nr4 day low. Alternatively, you can also place your stop loss below the current day low as this will give you a better risk to reward ratio.
The ORB - Nr4 pattern tends to precede strong trend day activity, so your stop loss should be rarely hit. Both of these patterns can be traded individually, but when combined they tend to produce even more powerful trades.
Step #5: Take profit at the close of the first 1-hour bearish candle
Our take profit strategy is fairly easy and it’s slightly modified from the original strategy highlighted in the “Day Trading with Short Term Price Patterns and Opening Range Breakout” book written by Toby Crabel.
Even though the ORB pattern tends to lead to trend trading days we’re more conservative and want to quickly take profits. So as soon as the first bearish candle shows up we close the trade and enjoy our daytrade profits.
Alternatively, you can keep the trade open until the end of the day if you want to extrapolate more profits from the cryptocurrency market.
Note** the above was an example of a BUY trade using our Dogecoin cryptocurrency strategy. Use the same rules for a SELL trade – but in reverse.

PLATINUM Buy signalPlatinum / U.S. Dollar FX_IDC:XPTUSD
Pattern: Channel Up on 1D.
Signal: Bullish as long as 866 holds.
Target: 930.00 (the next Resistance on 1W).
* If 866 breaks be ready to short to 833.00.

Ethereum , Market Is Going to FallEthereum / U.S. Dollar BITSTAMP:ETHUSD
The market frames another swing high lower than the past one. It's bad for bulls as it's only an extra flag affirming the descending development. RSI affirms the value inversion. MACD lines and histogram bolster the descending development. DMI is bullish yet ADX line falls. It educates us regarding an amendment development.
In the event that the value dips under the neighborhood bolster line, the market will move lower to the help zones at MAs and the uptrend lines. The value activity in these zones will give us more subtleties, will the market proceed with the bullish pattern or we ought to be prepared for other economic situations.
For affirmation of the further upward development, the cost should break the nearby downtrend line

USDJPY,1D TradeU.S. Dollar / Japanese Yenn FX:USDJPY
The market moves in the uptrend. The cost achieved the opposition level and we ought to be prepared to see a rectification development. In the event that the value bobs from the obstruction zone , It will be conceivable to open short exchanges dependent on lower time spans. This zone will most likely stop and turn around the market toward the primary uptrend. In this zone, we will probably get another purchase opportunity.

LOOK FOR CRUDE OIL TO TAKE A SLIDEAscending Triangle Trendline breakout
Blue Sup/Res lines found on weekly chart
On Day chart find fib lines and triangle
Price consolidated sideways at Weekly S/R zone and 61.8% fib
Price has curved downward
Wait for price to fall to bottom Trendline
There price will either bounce up once again or breakout bottom trendline
Wait for a candle to close below trendline
Wait for volume bars to increase
Wait for ATR value to increase
Choose your own entry strategy - (poss 15m/30m break-hook-go pattern)
Find your own SL
