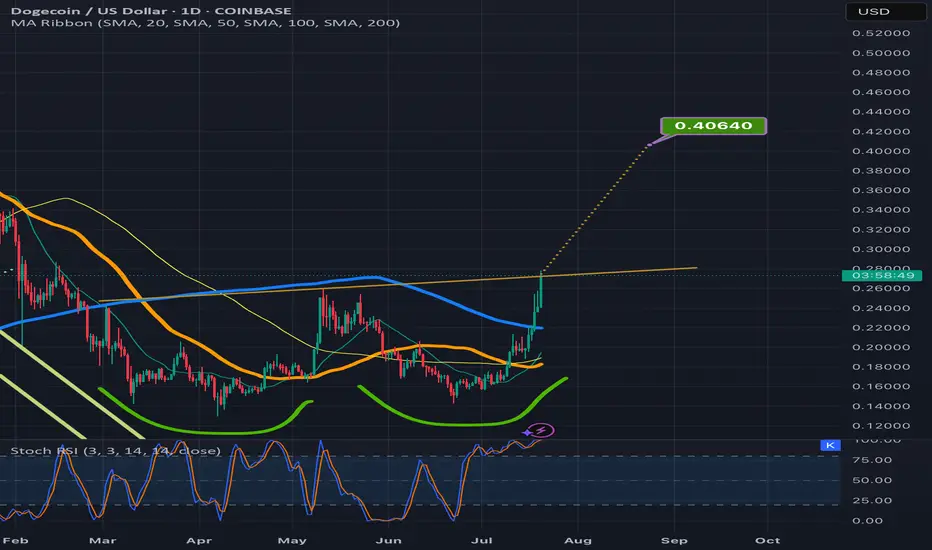
Doge inching above the double bottom necklineIt could easily dip back below the neckline a tie or two before it validates the breakout but definitely getting closer to doing so. Target is around 40-41cents. *not financial advice*
1day
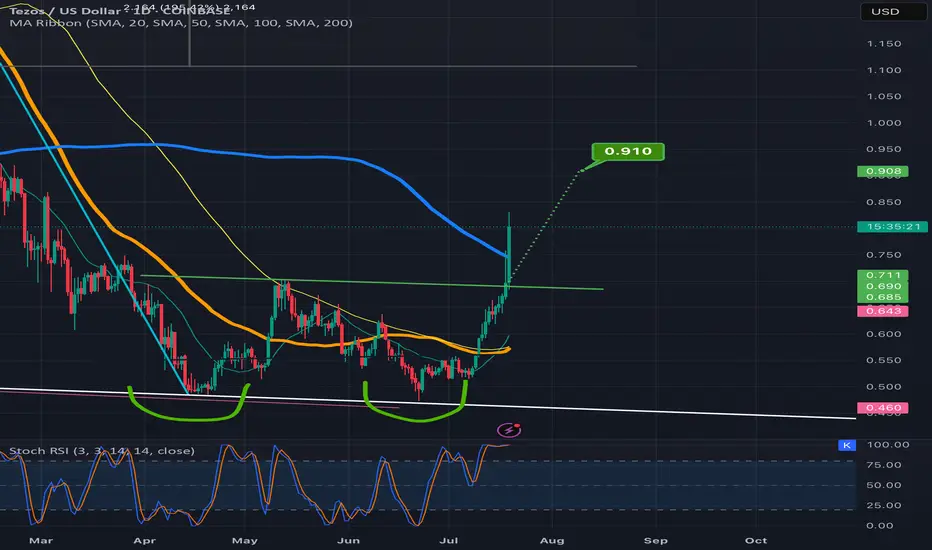
Tezos heading for a double bottom breakout targetPrice action is well above the neckline and already over halfway to the target. *not financial advice*
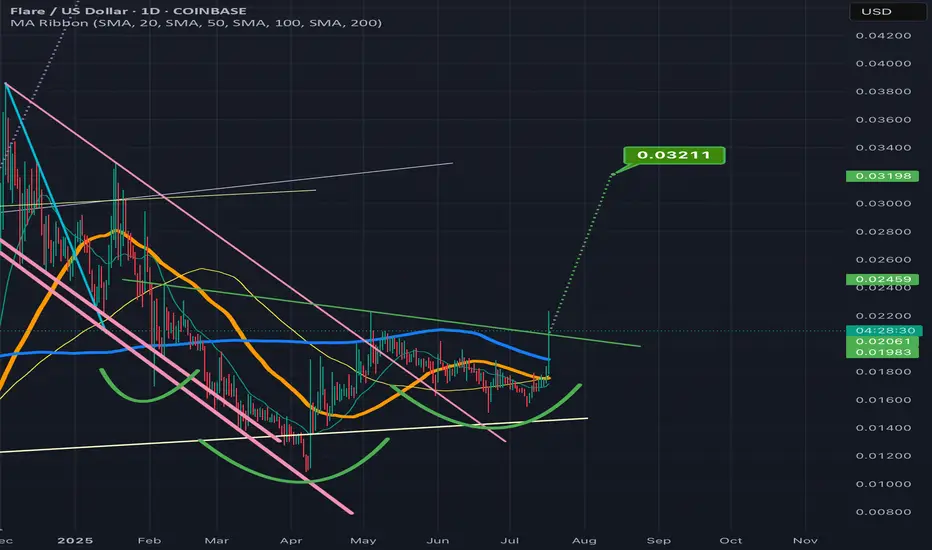
FLRUS breaking above the invh&s necklineNice it confirms the breakout the target is around 3 cents. Could always dip back below the neckline a time or two before that happens, but considering how it feels lke we are finally confirming an altseason here with bitcoin dominance taking a big dump probability highly favors an eventually validation of this breakout on flr. *not financial advice*
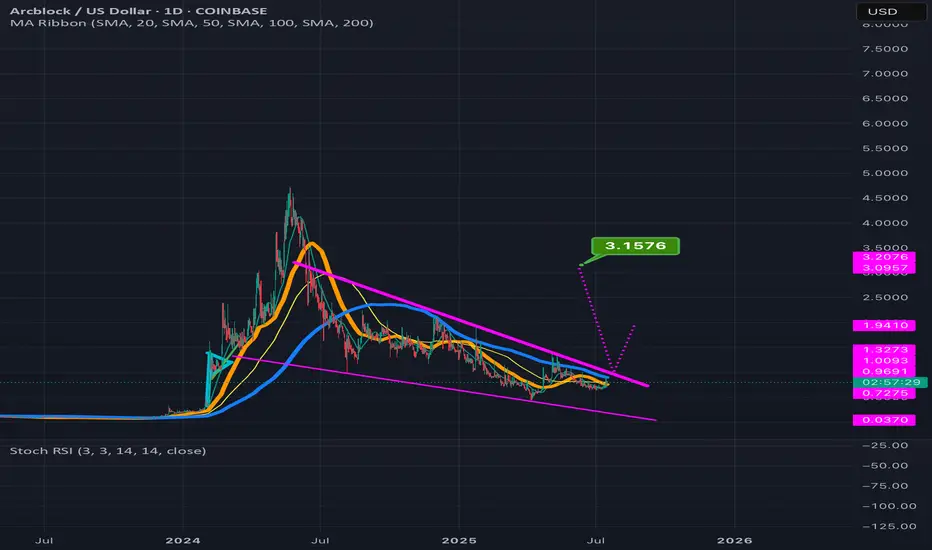
ABT can potentially 4x in value reading up from the wedge its inThe smaller pink dotted measured move line is for the inv h&s pattern its formed inside the wedge with the top trendline of the wedge doubling as the invh&s pattern’s neckline. Hitting that smaller target is more or less a 2x from current price action. If we hit the full falling wedge target that’s a 4x from where it is currently. *not financial advice*
The daily chart for total2 to look at the impending golden crossWanted to also post a daily chart tie frame of my previous idea. I first posted it in weekly to fit the entire cup and handle breakout target in the frame, but wanted to also post the daily time frame to provide both a close up of the inverse head and shoulders pattern as well as the impending golden cross on the daily time frame. Loos very likely that alt season may finally be approaching here. Gonna pay close attention to both this chart and the bitcoin dominance chart btc.d to know for sure. *not financial advice*

SUI on its way to the teal pennants breakout targetSui has joined the bullishness here as it has brown up from the pennant and well on its way to the target. *not financial advice*

Algorand breaking up from inverse head and shouldersSeems like most of the cryptos from the iso20022 compliant chains are breaking out right now and algorand is no exception. Most likely in anticipation of Fednow’s migration to it tomorrow. *not financial advice*

XLMUSD inv h&s at the threshold of the necklineNo confirmation yet but market currently feeling very bullish here. Likely to breach this neckline in the next few candles. *not financial advice*

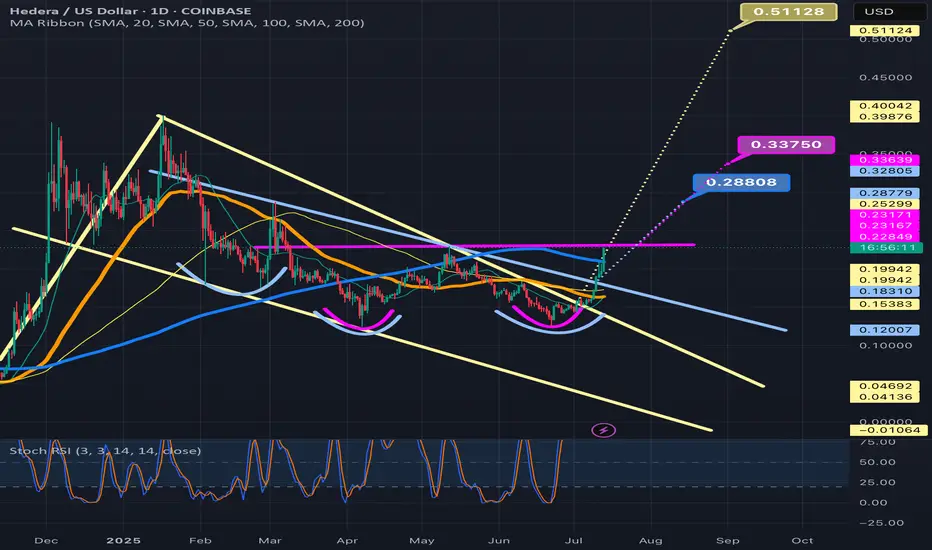
A linear Chart version of the current HBAR bull patternsIt just dawned on me that I had my chart on logarithmic for the previous 2 posts I amde about HBARUSD. As usual, the chart patterns on the log chart tend to have much higher breakout targets than the version of the chart patterns that appear on the linear chart. As soon as I realized this I went back in and adjusted the patterns to their linear chart erosions. The inverse head and shoulders remained mostly the same but the bullflag/desceding channel has now morphed into a falling wedge/bullish pennant. As you can see the breakout target for all 3 patterns is a much lower price than what the price targets were on the logarithmic chart. That’s not to say that the logarithmic targets are invalid, I think what will most likely occur Ike usually is both chart’s targets will be validated, it will likely just take much longer for the logarithmic chart’s targets to be reached as is how things usually pan out. *not financial advice*
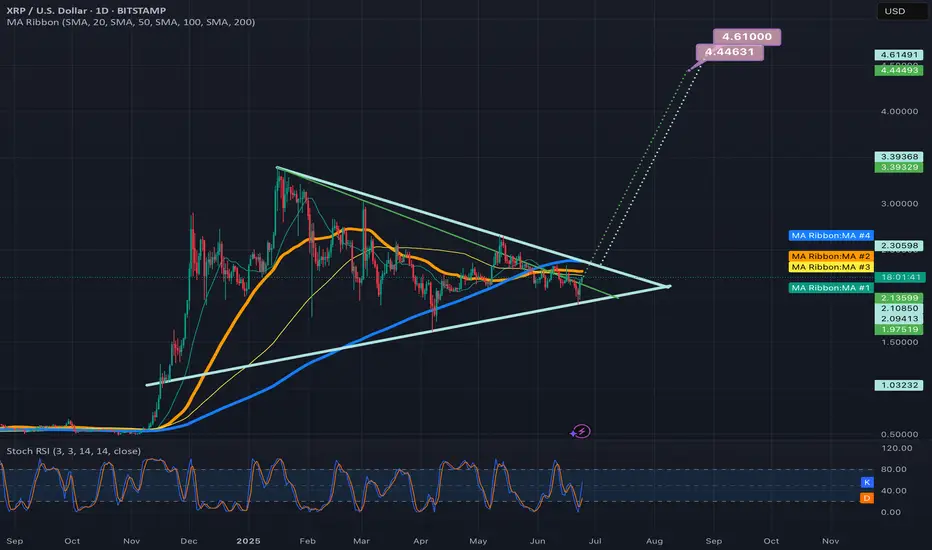
2 potential breakout targets for the symmetrical triangle on xrpDepends on if the green trendline is the more valid top trendline or the light blue one is. *not financial advice*
Once Crvusd confirms the invh&s breakout the target is .8737Currently firmly above the neckline of this inverse head and shoulders pattern. Could definitely still find a way back below the neckline but if it does return to the neckline and maintain it as support that is a solid place to go long or add to a position for my own personal strategy. *not financial advice*

1day chart fallingwedge/bullish pennant on bitcoinI just posted a weekly version of this same pennant in the previous idea which I will link below, i wanted to also post the version of it on the 1day timeframe as well because the top trendline of the wedge on the 1day time frame has a different trajectory which lengthens the wedge considerably. With this longer wedge we can see that if it is the more valid for the 2 versions, that we probably wouldn’t be expecting a breakout until June at the earliest. Not quite sure yet which version of this wedge is ore valid so I’m posting both versions for now to keep and eye on them. For the weekly charts pattern to be the more valid of the 2, we will likely need to see the weekly 50ma continue to maintain support. *not financial advice*

Propy resetting stochrsi just in time for golden crossYou can see here on the daily chart how propy hit the exact target of this 4hr chart inverse head and shoulders pattern of $1.93 and then instantly corrected and has now corrected enough to reset the daily stochrsi indicator just in time for its golden cross. Having price action be this close to the 50 and 200mas at the time of the cross is almost always a good sign that the cross will be sustained and validated as well. If so once price action climbs above the horizontal brown line and flips it to solidified support then the next target should be 2.76. That target then places us above the green trendline which will lead eventually to another breakout validation with an even bigger breakout target but we will focus more on that one once we get there. For now the focus is on breaking above the brown trendline and sustaining the golden cross. *not financial advice*

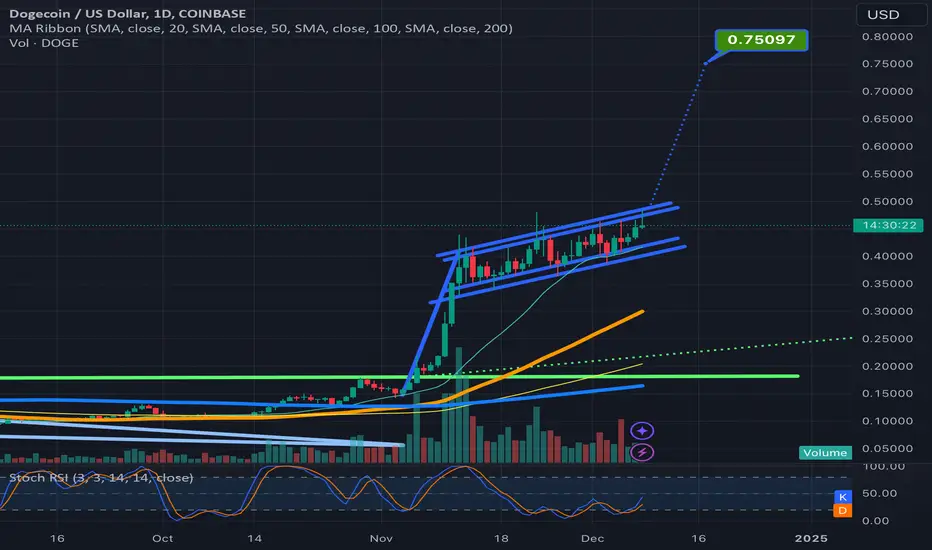
Doge can reach $.75 if it breaks upwards from ascending bullflagUsually an ascending channel like the one that is part of the bullflag on dogecoin’s 1 day chart beaks to the downside, except inside a parabolic phase of the bull market cycle. In the parabolic phase of a bull market cycle you can see several back to back rising wedges and ascending channels break to the upside so since we are really only 1-2 daily chart pattern breakouts into this current parabolic phase for the alt coin market, I think probability favors this ascending channel breaking upwards. If it does we also have the benefit of it being not only a channel but a bullflag as well and the target for such a breakout is around 75 cents. Furthermore if you flip to the weekly channel you would see that there is potential for the pole to be even longer than shown here on the daily timeframe, so I wouldn't be surprised if doge were able to overshoot the 75 cent target even. I noticed that the channel had valid trendlines on both the wicks and the candle bodies on both the bottom and top thats why the trendlines are doubled up, *not financial advice*
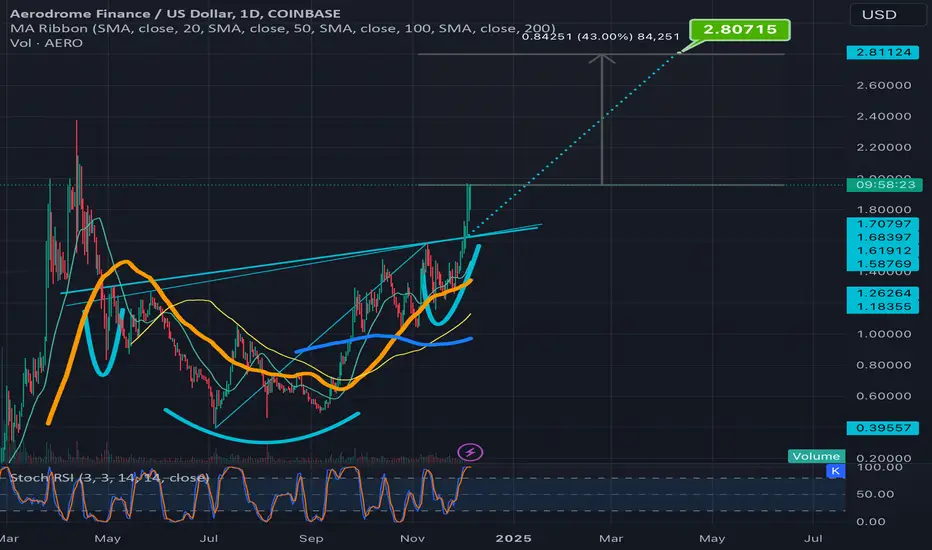
Aerousd breaking upwards from ascending inverse head & shouldersStill has about 41 percent of gains left to make between here and its full breakout targer. Will net a new all time high in the process. Not sure where it will go from there. could always overshoot or undershoot the target as well but most alts lately have been either hitting the target precisely or overshooting then. I like this particular unconventional inverse head and shoulders because it has 2 necklines both with the same breakout target. *not financial advice*
Symmetrical triangle/invh&S on render breaking abve toptrendlineNo guarantee that it confirmed the breakout on the first break above the pattern here, but the way the market has been moving lately thee is a high probability it will. *not financial advice*

Current price retracement on xrpusd is creating right shoulderWe can see the current price retracement on xrpusd is starting to form the right shoulder of an inverse head and shoulders pattern.This means that once price bounces and gets firmly above 95 cents or so then maintains that level as support it could trigger a breakout from this inverse head and shoulders pattern. At that point the target would be around $1.55-$1.60 and if we can get tot hat level and maintain that level as strong support thats when the real fireworks can start to begin. Could take multiple weeks for this right shoulder to find its bottom and head back towards the neckline, but hopefully sooner rather than later. *not financial advice*

Decentralized breaching its inverse head & shoulders necklineNo guarantee this will be the breach that confirms the breakout, but with the current momentum in the overall market there is a decent probability it could be. Either way definitely a bullish development for Mana *not financiall advice*

Avalanche Inverse Head & Shoulders PatternThe price action is currently retesting the dotted measured move line for potential support. Always possible to do back below the neckline but if the measured move line holds support we might not. Either way I anticipate ths pattern reaching its full target in the near future *not financial advice*

Band currently retesting neckline as support on invh&sNo guarantee it will hold that support but if it does, the breakout that is triggered afterwards should take us to the target shown here. *not financial advice*

Inverse head and shoulders patterb on TeslaI noticed the previous chart I posted for tesla I accidentally had logarithmic mode turned on so. Wanted to show the more realistic linear chart breakout target here. *not financial advice*

Algorand nearing 2 targetsThe triangle breakout target(dotted pink line) and the inverse head and shoulder target (dotted grey line). The speculation that Trump would do away with capital gains taxes on US cryptos may be fueling the current momentum. *not financial advice*

Invh&S target on PEPE takes it slightly above its previous athPEPEUSD appears to be breaking up from its inverse head and shoulder target.
