USDCAD UPTREND DAILY ANALYSIS PAIR CURRENCY: USDCAD DIRECTION PREDICTED:UPTREND LONG USDCAD is looking for a uptrend for today. Looking at the 1hour candles and all indicators, there is a suggestion USDCAD will go up touching the 1.3000 level. The analysis is for today, and always make sure you close the trade today.
Like, Follow and Comment my idea!
1day

EURUSD UPTREND TODAY ANALYSISPAIR CURRENCY: EURUSD TREND: UPTREND EURSUSD is looking for a uptrend for Today as al indicators suggest. Make sure you close the trade at the resistance point, more updates ad ideas in the evening or tomorrow.
Like and Comment for suggestions

BTCUSD TECHNICAL ANALYSISBTCUSD is looking for an Booming Uptrend for today. Resistance level has ben put at 6500.00. 1 hr candles have been used, and indicators are clearly showing an uptrend coming for today.
For more ideas message me and follow me
Thanks


USDCAD UPTREND TECHNICAL ANALYSISPair Currency: USDCAD Prediction: Uptrend USDCAD is looking to go up in the next hours as technical analysis suggests. Bollinger Bands and moving averages clearly show an uptrend upcoming. USD is predicted to be stronger in the next few days
Like and Comment my IDEA!
Follow me here and on Twitter for more Ideas coming!
Thanks

EURUSD Technical Analysis DownTrend Currency Pair: EURUSD Prediction: DownTrend, Short. EURUSD is predicted to go down and touch 1.7000, its resistance point. After analysing all indicators and fundamental analysis, it seems obvious the EUR is ready for a fall.
Thanks
Comment and Like this update
Follow for daily updates!

1day candle close= reversal hammer; 1wk close= bearish engulfingNeutral here as even though we just got a green bullish reversal hammer on the 1 day chart, we have a bearish engulfing candle on the 1 week chart.

BITCOIN : 5000$ BTCUSD has showed the sharp dump that could be caught on short-term(5 min) pit stops . But this is'nt the end of the falling, you can expect some delay near the purple line(support). AB=CD pattern in the descending channel.


Short opportunity in AUDUSD.The bounce will happen, the key is find where. My expectation is here, in the fibonacci 50%.

BUY in EUR/GBP. Time Frame: 1D.Responding to the daily tendency, we would expect a bounce over the trend line and a rising movement till the upper of the pattern.

BUY STOP IN: USD/CAD. Time Frame: 1 Day. Risk Ratio: 2.24Attending to the weekly trend, we see a possibly correction to retake the main bull tendency. In addition we see a bounce over the SMA lines which probably are working as a floor on the price.

EUR.CAD - Technical Analysis DowntrendCurrency Pair: EUR CAD Trend Predicted: Down Trend, SHORT. All major indicators are showing a Strong Downtrend of EUR CAD. Multiple indicators have been used, including More updates will be available shortly Bollinger Bands and 100/200 SMA.
More updates will be available shortly! Please leave LIKE or a COMMENT to keep supporting!

seeing a nice bounce right at the 1 day 50 maAs I anticipated, we would find support right at the 1 day 50ma...our previous bearflag consolidation had some bullish divergence on the 4hr chart and though it couldnt stop the bear breakdown it indicates that the correction may be close to over...Im thinking the 1 day chart 50 ma (in orange) could certainly be that. Currently we still haven't even touched it...turning around a quarter pip above it like the mob's herd mentality tends to do. I'm thinking we either bounce here, touchdown on the 1day 50ma then bounce back upward, sending a bear wick below the 50ma but inevitably closing above it...or maybe just one more breakdown from here. My limit buy was triggered at 6939 so I"m happy with my trade for now. But if I see the potential head and shoulders (with very little shoulders) look like it may trigger then I amout again until 6.1k -6.2 overall I think we would only see 1-2 more bear breaks downward before we turn back around but the golden cross is dependent on us not closing below the 1 day 50ma

We have broken down from a bearflag & through a big support liThe old adam and eve neckline we broke up from before was holding very strong support after the bearflag breakdown but could only hold for so long before it gave way. Are next 3 big supports are 7.3k the 4hr 200ma(shown here in blue) the 1 day 50ma and the 7k psychological. The bearflag breakdown target could send us all the way to 6.9 or even upper 6.8k. However I am hopefully that either the 200 on the 4hr chart or the 50 on the 1 day chart will provide us our much needed bounce. if we break under 7.2k however then 6.8-6.9 becomes a real possibility.
SHORT in GBP/USD. Time Frame: 1 D.The price hitted the superior tendency line and the SMA togheter, so i expect a strong bounce on it (probably to the lowest tendency line).

WTI Long EntryYesterday’s analysis: Support Cluster from Ichimoku Cloud, Bollinger Band, and trendline. Visible range > monthly 9. Just noticed that a monthly 9 preceded the last bubble.
Patterns: Pitchfork
Horizontal support and resistance: S: $67.10 R: $69.28
12 & 26 EMA’s (calculate % difference): 12: -4.41% 26: -3.21%
MA crossovers: Bearish cross on 1h preceded sell off. Recent bullish cross on the weekly.
FIB’s: 0.381 at $77.28 | 0.236 at $60.72 | 0.5 at $90.67
Candlestick analysis: Waiting for consolidation
Ichimoku Cloud: D: fully bullish, expecting cloud to act as support at $68 W: Tenkan at $67.68 and starting to develop a c clamp
TD' Sequential: 3d has called the last two tops. Shows major support at $66.13 and resistance at $72.37. Red 8 on the daily tells me to get fully positioned before tomorrow’s close. Currently bouncing off red 9 on the 1 hour. If we break back above $69.50 then it will be time to seriously consider entering.
Visible Range: Good support at this level with very little built up resistance until $90.
50 & 200 MA’s (calculate % difference): 50: -1.65% 200: +8.22% 50 just started to angle downward. 50 period MA on 3d chart has been a final line of support for the bulls.
Bollinger Bands: 1W: MA at $67.55. Bottom band lines up with 50 week MA very nicely. 3D: just cross MA to the downside. 1D: Wider than we have seen it in years. Bottom band is angling sharply upward.
Trendline: Bottom end up bull trend at $66.23
Daily Trend: Bearish since 7/5
Fractals: DOWN = $63.6 UP = $74.75
Volume: Lowest volume we have seen since 11/23/2017
“As for me, I have no desire to carry the football from end zone to end zone. Just give me the territory between the 20 yard lines.” @PeterBrandt
Yard line of trend:
Start: $42
Target: $90
Field Lenge: $52
Current Price: $68.35
Yardline: 50
Conclusion: Volume has sharply decreased since 7/12 as price has pulled back. This indicates a dwindling amount of supply at these price levels. Visible range volume profile shows very little resistance between current price levels and $90. Recent bullish cross on weekly is a very good confirmation that this trend has room to go.
There will be a support cluster from $67 - $69 due to: trendline, kumo support from daily Ichimoku Cloud, Visible Range Volume Profile, prior horizontal resistance turning into support. Bottom band of the daily BB, and the MA from the weekly BB.
Red 8 on the daily TD' Sequential tells me to get fully positioned before tomorrow's close. Order currently set at $67.51. If price does not get there then I will be buying the next consolidation.

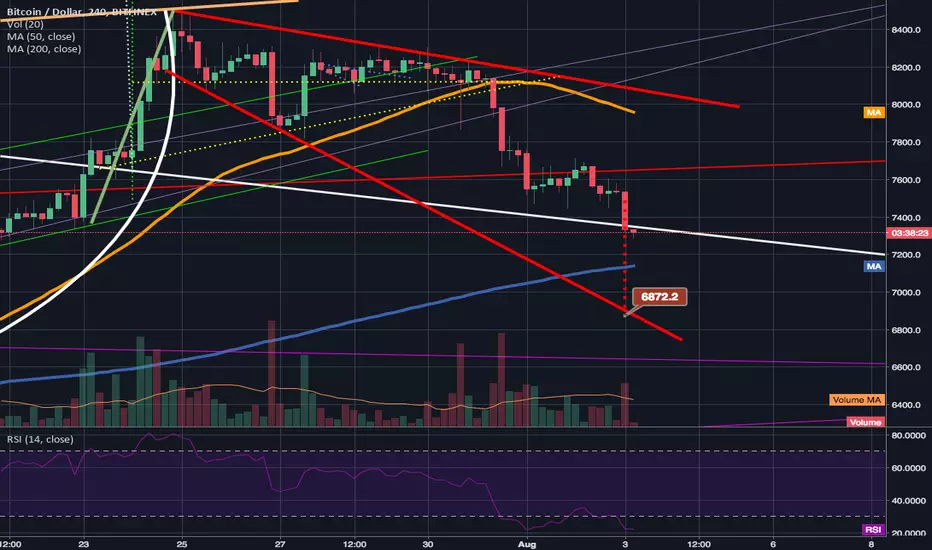
Head Shoulders knees & SHORT XBTUSD Short XBTUSD as the title says to. :)) @ $ 6720 1hour cadels w/ 3 day candel confirmation
Going Down, next level $6500 IMO New 'floor' set price $5500ish
Bear Huntnin Season Boys,, Yee Haww

1day Golden Cross developing as BTC bounces back to 1day tline. Staying neutral for now as we seem to have found a resistance at the 1 day charts t line(in yellow). We never hit the huge bounce support zone of 7,000 before this rebound so there's still a slight chance we could head back down to test it....however the 2 most optimistic signs I see right now is first, we are reaching the apex of a triangle that I think will most liekly break tot he upside, and secondly the 1 day 50MA(in orange) is heading upwards towards the 1day 200MA(in blue) and I don't expect the 200MA to suddenly start heading upwards since its gonna be factoring in the drops we had in January, February, and April pretty soon...in fact I think the only reason the 200 MA has stayed up this high to begin with is because it was still factoring in the uptrend from last year that led to the all time high...once the 200MA on the 1 day chart no longer stretches back to November or early December it will likely drop like a rock...but you can already tell with the 50ma(in orange) curving back towards the upside that we will be seeing a Golden Cross sometime next month. Once we get a golden cross on the 1 day Time Frame is when I believe we will officially enter back into the bull market. Everything in cryptoland is currently at a discount in my eyes and I'm hoping to enter back in at a wise time when we were below 7,100 was the most ideal time to reenter..however since we never tested that huge buy wall that's hanging out at 7k there's a chance we may drop back down one more time...I believe it's wise to ladder a small portion in right now, and then ladder in more if we dip to that again but I'm fairly confident we will be heading upward most of the month of June. . . and still stand by my mantra "To the Moon in June!" Stay strong make wise decisions, maintain nerves of steel, and keep your eyes on that 1 day chart golden cross scenario.

Big correction is coming? Bearish div on RSI and MACD say so!I still believe that there is big Bearish div on 1d timeframe from RSI and MACD like i post on 5 May. Now, i see potential bearish engulfing candle if we close the 1 day chart per utc below 9685 dollar.
This candle is followed by hanging man and bulltrap, so this is could be the beginning of big correction as the bull fail break the 10k.

AUDNZD ShortUsing Chris Moody's Slingshot System to identify aggressive entry points. Prices tend to cross past or into the sling before big trend-following moves. AUDNZD has pulled back from the top of a channel over the past 8 hours. Using Connor's 2-period RSI, AUDNZD is extremely overbought and a big trend-following move is likely.
Recommended SL: 1.06
Recommended TP: 1.051

GBPUSD SHORTA double top has formed on GBPUSD daily. Awesome Oscillator has hit a major resistance and Accelerator has turned red.
Recommended SL: 1.43543 (tight) or 1.4365
Recommended TP: 1.42
