My Thoughts On a Potential Adam and Eve Double Bottom (longterm)A fellow tradingview publisher by the handle of @BTCookieMonster (follow him and give his charts views and likes please) created a very nice chart hypothesizing an Adam and Eve Double Bottom which would result in a great uptrend. I totally agree with him and find that outcome highly probable but I think his adam and eve is really just Eve.....and That Adam is the Low from February....here is his chart which focuses on the 4hr timeframe: which is very well laid out. Above you can see on my 1 day chart however that this pattern can easily be applied to more zoomed out starting with the Adam bottom from February 6th and what we are experiencing now and have been since the Adam completed is the Eve Bottom. Should this trend play out on this larger timeframe as I am hypothesizing the upside of it will be much bigger and could take us all the way to 14700 and back into the bull market for Q2. For this Adam and Eve to be Valid though we would have to break somewhere between 10500-11000 depending how many days from now it takes to reach that...I'm thinking we could see something like this as soon as the middle of this month...of course we could always dip lower but probability makes this outcome fairly possible. Of course whichever choice you take, I always usually err on the side of probability while at the same time I stay completely prepared for the exact opposite outcome..You choose your own path however for this is not financial advice. Good luck and thanks for reading!
1day

A Tale of 2 flagsSo when you currently look at bitcoin on the 4 hour you'll see it's consolidating into a nicely sized bull flag...usually a really good sign for bulls...but after the last bear pennant had so many fake bearish -and- fake bullish breakouts that its structural integrity eventully collapsed under it's own weight, there's a good chance that any of the upcoming flags could meet the same non-breakout fate/demise in this current market where the main participants are the whales ...So tread carefully...it was upon me trying to reconstruct that busted 4hour bear flag that made me realize while zooming out to the 1 day chart that there was now a nice sized bigger 1 day chart bearflag that was bound to wreack havoc. What's more though when I went back to the smaller charts I spotted a nice sized bullflag on the 4 hour chart ...so we literally have a bull flag encased inside a much bigger bear flag.... who do you think will win out?...All I know is for now I'm still short unless we go above the last highest high around 7220...or if we get down to 6021....whatever you decide to do for yourself just expect the unexpected a all times. and that this is not financial advice thank you and happy easter! Thanks for reading for now I am still temporary short until I see higher highs/higher higher lows to signal the start of a trend reversal

TELL THE TRUTH AND MAKE IT SIMPLEHi, i will make it simple in this chart. On the 1-day chart we see BTC bounced from the 61.8 retracement level, witch is an important level, when we are under this level it is a bearish sign! Above this level we could say market is moving to bullish but in fact we didnt do this we will go downer now.
IF we hit the 8234 level, witch you can see at the orange line by today we will move downer from there and
BTC will form the C of the bigger elliot correction waves, witch will bring us to around 4500 USD/BTC.
Please look how this chart plays out ;)
Thanks and good luck with your trades.

An Importsnt look @ the 1day chart on BTC(potential deathcross?)We currently are finding strong support on the day T line(in yellow) however the 4hr charts current candle has only 10 minutes left and appears like it will close well below the recent bull flag...if so the probability of the next 4 hour candle also doing so thus confirming the breakout is pretty good. Once/If that happens we will most certainly fall under the current 1 day tline. One important thign to note is that even though we've been above the buy/sell line(50 SMA in Orange) for several days now on the 4 hour chart, you can see we're still very much below it on the 1 day chart...so in the longer term we're still definitely in a sellers market though on the 4 hour chart we've been in a buyers market...I was optimistic we would be in a buyers market on the 1 day chart soon enough as well, but am now seeing what looks like the 200 SMA(in blue) and the 50MA (in orange) are headed towards eachother in a way that the could cross paths within the next few days....if that happens based on the slope of both, you will likely see the 50 SMA cross -below- the 200 SMA which is known as the "Death Cross" and indicates that the path of least resistance is now to the downside...a very bearish signal indeed...which will likely result in me deciding to go short again until I see some sort of definitive bullish turnaround. There's a chance that something may happen to prevent the death cross in the meantime....but for now the slopes of both moving averages seem to indicate the highest probability will be a death cross.

1day chart closes 2 candles under the 200sma 1st time since 2014It looked as if there was a slight glimmer of a potential bull breakout from this current bear flag on the 4hour chart as the last 4 day candle found a way to close just above the trendline....however we all know that its not an official breakout until we close 1 more additionalc andle above the flag and at the same exact time that 4 hour candle closed above the bear flag trendline the 1 day chart just closed a 2nd confirmation candle below the 200sma for the first time since 2014....definitely not a food sifn...and any positive sentiment the 4hr candle gave buyers is likely to be outweighed by the sentiment the last 2 1 day candles are going to give sellers....Because of this I think probability is high that this next 4 hour candle will not close above the trendline thus invalidating any potential bull breakout from this recent smaller 4 hour bear flag. Further downside is what I anticipate.

1day chart's 50ema catches bulls & keep them in the rising wedgeSo we had a crazy plummet yesterday. We were long overdue for a retracement and this one was caught by the double reinforced support of both the 50EMA(in blue) and the bottom trendline of what I originally thought was just a channel..after adjusting it to the recent price action I have discovered instead it appears to be a an ascending wedge. The pice has stayed true to this wedge every since the most recent bottom so its definitly a strong source of both resistance and support. Interestingly enough the second inverted head and shoulder target I set up in the 15000s is, as you can see, the exact same price level as where the ascending wedge ends when I drew it until both lines converge...could this be simply coincdence? Who knows but it could be that our secondary head and shoulders breakout target price is valid after all. We shall have to wait and see...the closer we get to it the less the price action is gonna be able to move. It was comforting after we started the new days candle to see the 4hour chart ater a couple red candles throw out a green bullish reversal hammer patern. I'm still cautiously optimistic that with the strength behind this ascending wedge...it can help take us all the way out and break above the descending channel we've been captive of since december.

gbp/usd retracement methodMarket on the 1 day timeframe looks very promising for a resurgence of the pound to go trending up as well due to bank of England raising the interest rate from 0.25% to 0.50% which was done to meet inflation rates.
Higher interest rate means higher exchange rate cause people are willing to exchange their currency to GBP to add on interest.
This also fits with the retracements shown on analysis and every time the market retraced at those moments, it shot up forming a clean candlestick most of the time.
I'm hoping it will shoot up one more time so I can set a Buy Stop just roughly 10 pips above current market and ride it through until first resistance.
Use 1d for analysis and lower time frames to double check and to initialise and place an order.

Going short on Bitcoin because everyone just buying for BTG!Hey guys!
After i recommended to buy on the last dip, now is the time to sell i think.
Everyone is buying Bitcoin to get free Bitcoin Gold but nobody is really researching that project so its a hype based on thin air.
Also the indicators telling me the hype is over with Stochastik RSI and CCI crying OVERBOUGHT .
-Fibonacci
www.investopedia.com
-TD Count sequential:
tradetrekker.wordpress.com
-Squeeze Momentum:
-MACD
www.investopedia.com
-Stochastic RSI
www.investopedia.com
-CCI vs RSI
www.investopedia.com
-TD sequential:
tradetrekker.wordpress.com

USD/CHF short term analysis.XABCD pattern shows the downtrend of the market and I used the 4 hr timeframe to add arrows to be in line with the XABCD analysis.

REVERSAL PATTERN OR DIVERGENCE ( AT )Dear Traders & Followers,
There is a possibility to go short from the price of 1.2000 or 1.2015
to the level of 1.1880,1.1785,1.1630.
Note: Everything works with Best money management.
Note: Please leave comments for any query.
Disclaimer: Trade at your own risk.
Good Luck...!!
Regards,
Growing Forex Team

RISING WEDGE OR DIVERGENCE ( AT )Dear Traders & Followers,
There is a possibility to go short from the price of 0.7990
to the level of 0.7945,0.7870,0.7810.
Note: Everything works with Best money management.
Note: Please leave comments for any query.
Disclaimer: Trade at your own risk.
Good Luck...!!
Regards,
Growing Forex Team

BEARISH FLAG OR HEAD & SHOULDER ( AT )Dear Traders & Followers,
There is a possibility to go short from the price of 1310.00
to the level of 1299.44,1275.00,1250.00.
Note: Everything works with Best money management.
Note: Please leave comments for any query.
Disclaimer: Trade at your own risk.
Good Luck...!!
Regards,
Growing Forex Team

BEARISH FLAG ( AT )Dear Traders & Followers,
There is a possibility to go short from the price of 1.3530
to the level of 1.2980,1.2785
Note: Everything works with Best money management.
Note: Please leave comments for any query.
Disclaimer: Trade at your own risk.
Good Luck...!!
Regards,
Growing Forex Team

REVERSAL PATTERN OR DIVERGENCE ( AT )Dear Traders & Followers,
There is a possibility to go long from the price of 91.30
to the level of 93.30,94.15.
Note: Everything works with Best money management.
Note: Please leave comments for any query.
Disclaimer: Trade at your own risk.
Good Luck...!!
Regards,
Growing Forex Team

EUR/GBP Buy probabilityEntry Market Order @ 0.89232
T/P @ 0.90880
Limit - 1 Day
Personal analysis only. Please use your own rules & strategies prior to entering market.

NZD/USD potential downfall It's formed a XABCD and another triangle to show the predicted movement of the market it's heading to.
It's hit the resistance line twice already from previous moves and every time the candlestick hits a resistance line, it continues to crumble and gets pressured to lower the price.
I am hoping it will continue to lower because it has already hit a resistance line by two 1 day candlesticks.

XRP/BTC - In the Buy ZoneI expect that ripple will get bought up at these levels, OBV suggest Bullish Long Term sentiment.

NZDUSD - ShortThis pair could come down for one more leg and then start to go up. This is a daily chart and this could take months to happen. So plan your trade size and risk accordingly.

EURUSD ShortThere will be a probability where the price going to short again either in today closing or tomorrow as long as the price breakthrough 1.03750. If it stay above it, then there will be a chance the price going neutral trend or even a small chance it turn to long.

Awaiting Short position on EUR/USD.I belive Eurusd is going to head back into the 1.14586 area to retest a key support level. Currently price is in no mans land. Once price reaches the key resistance level drawn in, we will be looking to sell it off to our first take profit level of 1.09456.
So for now this trade is going to require a lot of patience, as we will not be looking to do anything with Eurusd at the moment until it reaches our desired sell zone.


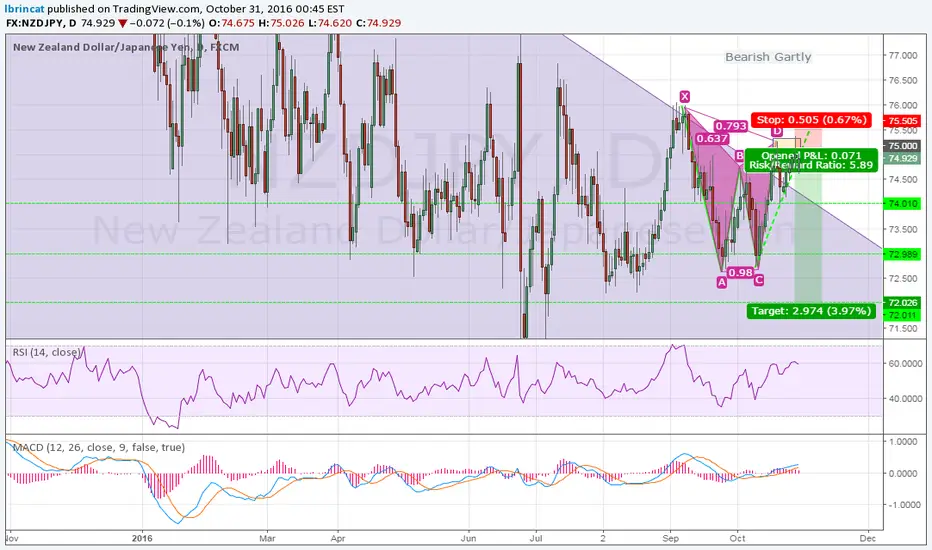
NZDJPY Short Gartley PatternWent short at 74.93 after PRZ was hit twice and formed a price rejection candle on the 4 hr chart, Weekly and Daily Charts are also bearish.
SL above point X at 76.13
TP1: 74.010
TP2: 72.989
TP3: 72.026