ETHUSDT/1DACCORDING TO support and resistance lines, I think price has a good trip to its resistance line as you see on the chart. We will see!
1day

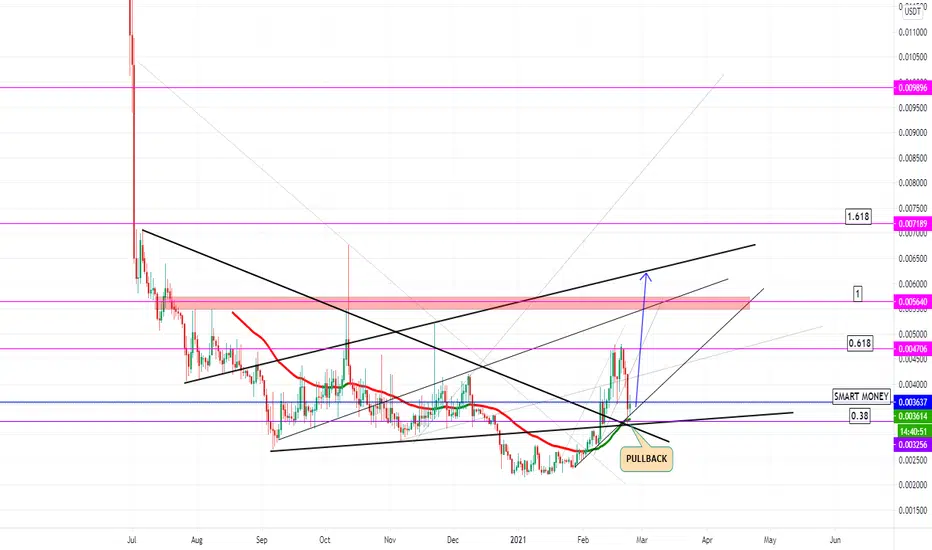
SNTUSDT/1D (updated)After breakout I think we going to have pullback on up trend.Target is last price! Ya can take buy limit on up trend or sell limit after pullback!

ETHUSDT/1D I think price will able to kiss its resistance after breakout and pullback to its up trend(support line)!

ACTUSDT/1DAYSharp rise will possible after breakout from up trend. Maybe we're gonna see pullback on up trend and maybe not but I think we will see it.


BTCUSD 1day chart Symmetrical Triangle Breakout! Target=$65800here's a look at the symmetrical triangle we have appeared to breakout of on the 1 day chart. If it reaches it's measured move it should hit 65800. *not financial advice*

GBPUSD/1DA COMPLETE BREAKOUT FROM RESISTANCE LINE IS IMPRESSIVE.
For neutral term I think price will be able to kiss these targets :
1) 1.38546
2) 1.39391
3) 1.41216
4) 1.42219

SNTUSDT/1DIf SNT will be able to stand above of its up trend line then it going to kiss another resistance (raising up 533%) that is a strong one.

EOSUSDTDoes EOS start climbing?
Given the chart's history, the EOS currency has the potential to reach higher prices.
But there are obstacles in its way, such as the canal roof and the resistance area
It should be noted that this currency has lagged behind the upward trend of the market in recent months, and this increases the likelihood of a price explosion in this currency.

moving average 200The analysis is based on BTC
In 1 day time
With strategy
moving average 200
Be profitable

PERLUSDT/1D (UPDATE OF LAST CHART)Price is still above of SMA 9 DAYS and seems that it going to make a pull back to its trend line.
So, any Bullish candle plus strong one above trend line are a good news for entry.

HIVEUSDT/1DTrying to breakout from it resistance.
I think a good time for long entry is when we'll see a pull back to trend line. So, keeping your eyes on HIVE !

TRXUSDT/1D (NEW UPDATE OF THE LAST CHART)I think we will see a good breakout (with bullish candle) from strong resistance and then good rising to last resistance (upper ones).
During this trip you can TAKE PROFITS twice in 0.0688227 & 0.0905986, if you want to trade for short term or saving your money on top of taking another position with your profit for next target.

BANDUSDT/1D (UPDATE)We see a pull back on 1st up trend. Possible entry is when we're going to see a pull back on 2nd up trend (STRONG RESISTANCE)
For long term entry last point is important due to after any breakout with pull back we have a low risky zone to pushing trigger.
Our targets placed at 2nd and 3rd up trends.

QTUMUSDT/1DAY_UpdateI like to share some points with you:
1. We have 3 tp and you can take it if you want
2.Maybe trend going to reverse on these targets and it's possible.
3.These number came from Fibonacci.
4.Resistace zones and Fibonacci will be able to reverse any trend when price reach to them.

TRXEOS/1DAYI THINK PRICE WILL BE ABLE TO REACH 0.015324113 AND then if we'll see breakout from resistance line plus pullback then 2nd long entry will possible on top of our 2nd target is 0.02209515 .

STEEMUSDTAfter we saw Golden Cross, 2nd long entry will possible when price going to breakout from up trend.
Entry on pullback is better and I will expect we going to have a sharp movement.

DACUSDT/1DAYWE CAN SEE PULLBACK ON SUPPORT LINE WITH SMART MONEY.
Price is above of EMA 50 days that is good support line for candles.
I think DAC will be able to rise like that and going to kiss its up trend line (strong one). If price breakout from this up trend, we will be able to open another order ( long ) in pullback.
0.38 is a Fib Ret zone that trend was reversed. 0.618,1 and 2.618 are Fib Ext zones that will be able to reverse our trend, also.
These Fibonacci zones are good area for TP.
BTCUSD/1Dwhat should we do ?
it seems that we have a pullback above of support zone but any bullish candle patterns at this zone will help you to get right position.
our trend reversed at Fibonacci areas and I like that. Ya can see these Fibonacci areas in the chart and possible targets on them.
So, Rise or Drop ? Your answer is on the chart.
point: For any entry I prefer to use 4hr chart or 1hr.

MANAUSDTMANA / USDT 1D
Mana currencies are defined as project "NFT" currencies.
As you can see in the chart, consecutive days when the market of other currencies "Mana" was declining, along with a few altcoins such as "CHZ" had an upward market.
According to the good news published in cyberspace for this currency, as well as for other similar altcoins in the "NFT" category, it should be said that the probability of a price rise is still higher than the probability of a fall.

BTC/USDTBTC-USDT
Bitcoin is forming a triangle. Eventually, as the pattern breaks, it will move up or down.
1- Breaking down the price fall to the range of 43400 to 43200 is unobstructed. But in this area, it faces strong support, such as the trend line and the Ichimoku cloud, as well as the moving average. In this case, it is expected to raise the market and return.
2- It is possible to break up and climb the price up to the range of 57,500 to 58,500. In this range, a fall is expected by hitting the level of the previous peak.
The digital currency market is not very predictable. But we hope that bitcoin will follow the upward trend so that the altcoins will climb bravely.

CROUSDT/1DAYWe have two scenarios for CROUSDT.
1st of all if price will be able to breakout from resistance and we see possible pullback (bullish candle is good signal) then price will rise like you see (1.618 is strong zone for trend reverse and we have also another resistance here, so you can tp before price going to kiss them)
2nd scenario will happen if price won't be able to stand above of its resistance. You can see the price trip for this scenario. I think price will drop to its strong support zone (Consolidation area + Fibonacci zone + Up trend).
Support zone will be able to reverse our trend and I think price will kiss again its resistance and maybe going to pullback above it (a long signal).

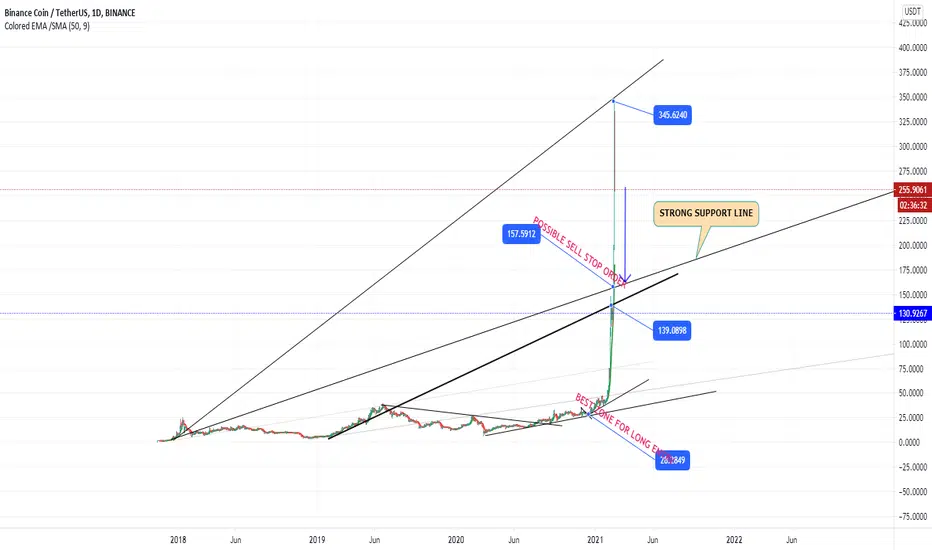
BNBUSDT/1DI THINK BNB WILL DROP MORE TO ITS SUPPORT LINE (STRONG SUPPORT ZONE)
YOU CAN TAKE SELL STOP IF YOU AGREE WITH MY IDEA AND THINK IT'S POSSIBLE.
I SAW GOLDEN CROSS AT 11 JUL 20 AND THIS IS ONE OF THE STRONG LONG SIGNAL