TRXUSDT/1DWHAT A MOMENT FOR TRXUSDT!!!
For neutral term I just can say that :
Price is on resistance zone and trying to breakout from this area.
If price will be able to move ahead and breaking also, then who will be able to stop it ?!
Stay tuned for it and keep it up!!!
1day

EURUSD/1Day Candle of February 9th SHOWS A BREAKOUT from strong resistance line that now is a support one. It seems this candle went out of another resistance line more than 50% and so, I think price will be able to reach to upper line that named strong resistance. Primary resistance is down trend line and secondary is consolidation area in short term as well as you see that price made a good candle above of MA 9 DAYS. So, for neutral I expect that price will kiss its STRONG RESISTACE LINE for 2nd time.
This idea will be update if price take another method for its way.

ETHUSD/1DAfter a breakout from the bullish triangle while price is above of MA 50 days, I will expect that price going to raise approximately of the base of the triangle. NOW Price made a good candle above of both consolidation area and strong support line and it is a good news that price will be able to kiss its strong resistance. For neutral It seems that price will reach to these targets respectively base on Fibonacci Extension that highlighted on the price zone :
1.2232 on 1.618
2.3397 on 2.618
3.4585 on 3.618
For short position we can take orders on the trend lines, consolidation area after any pull back or maybe on the Fibonacci numbers if possible.

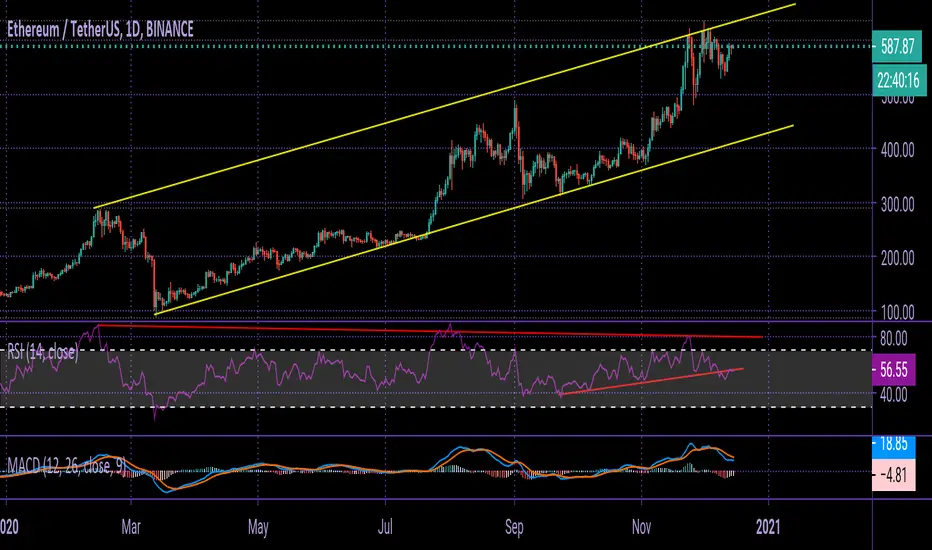
Ethrum Analysis in 1D time frame Hi,The price of ETH in daily time is on an upward trend, which has just left its long-term channel. The MACD indicator and the price chart are converging, indicating a tendency to maintain an uptrend, but given the divergence in the RSI, one should expect a price correction in the daily time. The RSI indicator has broken its support line down and is now pulling back to it. If Polback confirms and this support fails, a deeper price correction should be expected.
GOOD LUCK
AUDUSD - Multi-Timeframe Analysis- 4HR Entry & Monitoring. LONGI have been watching this pair from last week; 26/10/2020. I have been motoring and awaiting confirmation from its reaction to a previous identified level of possible support around 0.70931. If price breaks it as resistance on its way up. So far I have seen evidence of a possible turn around from a bearish to a bullish market. I have set a BUY STOP ENTRY ORDER for just above the identified level at 0.70963. I am aware that this week with see a lot of noise and uncertainty from the US Elections.


NEOUSDT | Entry Price | Perfect Long Position | 1DThere is great opportunity to go long in NEO | BINANCE:NEOUSDT , wait for the chart to reach the support and then you can place your position either at the support level or at the top resistance level.


Walmart | Profit Opportunity | 30 RSI | 200EMAWalmart has reached a great support level at $117, and it might bounce for a small profit in the short run.
1. First confirmation and the strongest of possible bounce is the 200-EMA at $117. Long term investors and big money relay on this moving average since its more reliable than others.
2. We have reached an RSI of 30 in the daily and in the 4h Hour - at the exact level where the 200 EMA is, this means that the stock is oversold and its underprice.
3. We have built more than eight different support levels at this price since September of 20
Please Trade safe, and do your own DD.

Apple 1 Day Analysis - Testing 21 EMA - Reasons to Buy and SellHello Everyone, I'm new here but I will provide you with the best context for everyone without bias.
Apple has to reach oversold conditions in the daily chart at 81 RSI; it has a solid pattern since many investors love apple due to their return in equity and cash flow statement year after year.
The stock has become oversold recently; this doesn't mean that it will start a bearish pattern. Instead, indicators are showing a continuous bullish trend since it has broken a new high during this difficult time of COVID 19.
Apple has to correct a bit before it can go higher; the first support level is at $326. Look at the 21-Moving Average will see that is trying to catch up to the support level at $326. We can confirm this by support level at the starting off in 2020 to Feb.
Our second indicator that confirms that it might test this level is our FIB- Retracement, The rule says if a solid stock it should bounce off the significant level at 0.382. The law only applies to solid stocks. We can confirm this by looking at the RSI, which is currently 63. By the time the RSI reaches 50, the price will be near the FIB retracement at 38.2%.
Bullish stocks have an RSI between 85-50, an RSI of 50 means the stock is neither overvalue nor undervalue. It says its the correct price.
The takeaway here is that if you were looking forward to buying an apple, you should see how it reacts the first moving Average at 21 if it drops below it. This means you should be able t get it for $300 at the 50-moving Average. The same if you are holding at a higher price, you should see how it reacts with the first support level before selling it.
Trade safe and if there are other stocks you guys want me to perform an analysis, Drop it in the comment below.

AUDJPY SELL- STRONG RESISTANCELikes and comments if you want more trading setup. Thank you!
Visit our channel!
SL: 76.899
The price has reached
strong resistance.
In 4H and 1H chart we
have rejections confirming
the sell.

Possible butterfly harmonic pattern for short on AUDCADCaught sight of what could possibly be a butterfly harmonic price pattern. Price appears to be on final leg to complete pattern; would take a while to complete though. Worth the wait? Try to draw out pattern to confirm for personal confirmation. Best Wishes!!!

Possible moves - 1day - BTC - BinanceSome possible moved for BTC. First i wil try find short positiob from the first resistance.
P.S wti chart is most important chart during the time. All other markets looking WTI moves.

USD/JPY - 1DI have spotted that this pair is at a support that has been tested a few times, i think looking at the RSI on the daily which is at 35 and the EMA which is far from price these are both indications that price could move up. i am just waiting for a confirmation to enter i have placed a marker as to where i think price will move i have set a 150 pip SL with a 293 pip TP. which is nearly a 1/2 risk reward. if price hits 106.100 i will consider taking some profits and moving SL to EP. 106.100 is a fib retracement level so i will monitor this trade at this point.
Let's see how this goes.

Target hit; Long closed; Profit taken.IJust had a successful 5x long from 8200 to right where the candle wick has stopped here just barely shy of the falling wedge breakout target. I will now wait for a couple daily closes above the 1 day 200ma before reopening any long.....overall pretty satisfied with this one even if it doesn't hit the target with 100% accuracy(which it still very easily might) 98% accuracy is pretty impressive for a wedge pattern.


61/80% golden pocket fib retracement with the precision bounce.As anticipated we got some bounce love from the golden fib retracement level at 61.80%. However it has not bounced us high enough to reclaim the 1 day 50ma(in orange) as support just yet...Reclaiming that support is pivotal..If we can't flip it back to solidified support within the next 3-5 days then the bull market will likely be over...hopefully we will see a huge bounce here. We still have a gap on the CME futures chart at around 11.8k or soo so I'm still holding out a slight bit of hope that we can see a big bounce here.
