AAVEUSD 1D ChartHello everyone, I invite you to review the current situation of AAVE in the USD pair. When we enter the one-day interval, we can see how the AAVE price will see a return above the main upward trend line, but here we can see that we are still below the formed downward trend line, which in the event of further increases may prove to be a strong resistance.
Here we can see how the current rebound is fighting the resistance at $ 256, only when the level is positively tested, resistance will be still visible at the price of $ 290, this will be a strong resistance right next to the downward trend line, only a positive exit from the top and staying above this trend line can lead to movement towards resistance at $ 339.
Looking the other way, we can see that when the trend reverses, we first have a support zone from $ 233 to $ 211, however, if this zone is broken, we can see a quick return of the price to the support area at $ 174.
The Stoch RSI indicator shows that despite the current upward movement, there is still room for the upward movement to continue.
1daychart

DOGE/USDT 1D chart reviewHello everyone, let's look at the 1D dog chart to USDT, in this situation we can see, the price reflection here can be seen how the price continues under the downward trend line.
Going further, let's check the places of potential target for the price:
T1 = 0.246 $
T2 = 0.282 $
Т3 = 0.319 $ t4 = 0.369
Let's go to Stop-Loss now in case of further declines on the market:
SL1 = 0.229 $
SL2 = 0.195 $
SL3 = 0.157 $
Looking at the RSI indicator, you can see that when the indicator came out the top, it gave the relief for the price and now when the price lasts in a slight side trend, the indicator collects energy for a new move.

BNB/USDT 1D chartHello everyone, let's look at the 1D BNB chart to USDT, in this situation we can see how the price came out of the downward trend line and currently persists over it.
Going further, let's check the places of potential target for the price:
T1 = $ 686
T2 = $ 732
Т3 = $ 795
Let's go to Stop-Loss now in case of further declines on the market:
SL1 = $ 648
SL2 = $ 599
SL3 = 541 $
Looking at the RSI indicator, we see a clear increase on the indicator that crossed the upper limit, which can also affect the potential relaxation.

Sui broke above the wedge & is already over halfway 2 the targetSUUSD has had a very notable pump on this uptrend which hopefully will end up being the beginning of confirming a real sustained uptrend in the alt market. *not financial advice*

ETH is fighting in a strong resistance zone!Hello everyone, I invite you to review the current situation on ETH. When we enter the one-day interval, we can see how the ETH price came out on top from a strong downward trend.
Here we can see how the current bounce brought the movement closer to a very strong resistance zone from $ 2,090 to $ 2,310, in which we can currently observe a fight for further upward movement. Only when the price comes out on top, it can go towards resistance at $ 2,740, and then move towards strong resistance at $ 3,070.
Looking the other way, we can see that when the trend reverses, we first have support at $ 1,837, then a very strong support zone from $ 1,610 to $ 1,404 is visible, however, if this zone is broken, we can see a quick decline to the support area at $ 1,071.
On the RSI indicator we can see how strong the ETH price movement is visible intensively on the indicator and here we can see how we are approaching the upper limit, which could potentially slow down the movement or give a temporary relief.

BNB/USDT 1D chart Hello everyone, let's look at the 1D BNB chart to USDT, in this situation we can see how the price moves in a triangle where there is still space to keep the currently ongoing side trend. Going further, let's check the places of potential target for the price:
T1 = $ 599
T2 = $ 617
Т3 = $ 644
Let's go to Stop-Loss now in case of further declines on the market:
SL1 = $ 580
SL2 = $ 559
SL3 = $ 542
SL4 = 521 $
Looking at the MacD indicator, you can see an attempt to return to the upward trend, but here we do not have clear confirmation, which is why it is worth being careful.

ETH is fighting in the support zoneHello everyone, I invite you to review the current situation on ETH. When we enter the one-day interval, we can see how the ETH price moved in a strong downtrend channel. What's more, we can see that the price fell below the main uptrend line.
As we can see, the price is currently fighting to break out on top in the support zone from $ 1690 to $ 1350, in a situation if this zone was broken, we could see another strong drop to the support area at $ 884 at the previous low after the bull run.
On the other hand, if ETH gets wind in its sails again, it must first pass through the resistance zone from $ 1952 to $ 2100, while further on there is a very strong zone from $ 2500 to $ 2740.
However, here, taking into account the one-day interval, the RSI indicator shows a breakout above the top of the border, which may affect the potential end of the current uptrend.

Will BTC emerge from the descending channel on top?Hello everyone, I invite you to review the current situation on BTC. On the one-day interval, you can see how the price is moving in the downtrend channel in which there is again a fight with the upper boundary of the channel. At this stage, you can also see how the EMA Cross 50/200, they have come very close but still indicate the maintenance of a long-term upward trend.
Here you can see how the price has currently bounced off the resistance zone from $ 86,503 to $ 87,934. Only an upper exit from this zone will open the way towards the second important zone at the levels of $ 93,959 to $ 96,142, and then we have visible strong resistance around $ 101,800.
Looking the other way, you can see that in the event of further declines, we have support at $ 80,550, then you can see an important zone that previously maintained the price decline from $ 74,340 to $ 71,380, in a situation where this zone is broken, we can see a quick decline to around $ 65,360.
The MACD indicator shows an attempt to switch to an upward trend, it is worth watching whether there is enough energy for further movement.

SOL — Clean Liquidity Grab & FVG Flip. Mid-Term Setup in PlayClassic move on SOL — liquidity sweep, inverted the FVG, and pushed higher. Textbook stuff.
Not expecting an instant pump, this one looks more like a mid-term play… although, with SOL, you never know.
Stay sharp. And follow to catch the next ones early.
Entry: 109
TP: 123-148

Will the support zone keep BTC falling?BTC has once again bounced off the upper border of the downtrend channel. Here, it is worth remembering the long-formed gap around $74,500, which was closed during the last decline.
Here, you can see how the price fell into a strong support zone from $77,742 to $73,980, but if this zone is broken, we can again see a strong decline around also very strong resistance and the lower border of the channel at $68,590.
Looking the other way, you can see that the increases were stopped by the resistance zone from $84,000 to $86,700, only breaking out of this zone at the top will give the possibility of growth towards strong resistance at $94,300.
The RSI is still in the lower part of the range and is again heading towards the lower borders, but here the price has formed a lower low, which can still give another reaction.

1day chart fallingwedge/bullish pennant on bitcoinI just posted a weekly version of this same pennant in the previous idea which I will link below, i wanted to also post the version of it on the 1day timeframe as well because the top trendline of the wedge on the 1day time frame has a different trajectory which lengthens the wedge considerably. With this longer wedge we can see that if it is the more valid for the 2 versions, that we probably wouldn’t be expecting a breakout until June at the earliest. Not quite sure yet which version of this wedge is ore valid so I’m posting both versions for now to keep and eye on them. For the weekly charts pattern to be the more valid of the 2, we will likely need to see the weekly 50ma continue to maintain support. *not financial advice*

DOGE/USDT 1D chart ReviewHello everyone, let's look at the 1D Doge chart to USDT, in this situation we can see how the price moves over the downward trend line, but fights to stay over it.
Going further, let's check the places of potential target for the price:
T1 = 0.175 $
T2 = 0.184 $
Т3 = 0.199 $
T4 = 0.223 $
Let's go to Stop-Loss now in case of further declines on the market:
SL1 = 0.167 $
SL2 = 0.156 $
SL3 = 0.143 $
Looking at the RSI indicator, we see
As we are approaching the center of the range again, but here the space for further continuation of growth is visible.

BTC/USD 1D Chart ReviewHello everyone, let's look at the 1D BTC to USD chart, in this situation we can see how the price is moving in the designated downward channel, in which the price started to grow again. What's more, we can see consolidations on the EMA Cross indicator and here it is worth watching the movement of the red line to see if it will again go up from the green line, which would confirm the return of the uptrend.
Let's start by defining the goals for the near future that the price must face:
T1 = 85808 USD
T2 = 88093 USD
Т3 = 91127 USD
Т4 = 95106 USD
Now let's move on to the stop-loss in case the market continues to fall:
SL1 = 82854 USD
SL2 = 79859 USD
SL3 = 75171 USD
If we look at the MACD indicator, we can see how it indicates an uptrend, but we still have to wait for a return to a strong main uptrend. The RSI shows rebounds near the middle of the range, which we are approaching again, and it is worth paying attention to how the price will behave now.

BNB/USDT 1D chart, target and stop-lossHello everyone, let's look at the 1D BNB chart to USDT, in this situation we can see how the price came out of the top of the ongoing downward trend.
Going further, let's check the places of potential target for the price:
T1 = $ 646
T2 = $ 683
Т3 = $ 732
Let's go to Stop-Loss now in case of further declines on the market:
SL1 = $ 592
SL2 = $ 558
SL3 = $ 535
SL4 = $ 505
Looking at the RSI indicator, we see
As we entered the upper part of the range again, however, there is still a place for the price to go higher, giving more targets.

XRPUSD breaking upward from invh&sTarget is $3. Very likely to hit the full target based on the bullish momentum from the sec ripple appeal being ofifcially dropped. Likely to continue upward from there as well but for this current idea I only wanna focus on the inv h&s target. *not financial advice*

Another look at the wedge/pennant I just postedI decided to do a second chart idea on the pennant I posted in the last chart, this tme including the super pivotal support trendline and moving the emasured move line to the point that support line crosses over the top trendline of the wedge. Will be interesting to see if either of these measured move line projections from this dea and the last one play out. *not financial advice*

Falling Wedge/Pennant on BitcoinThe full wedge extends all the way into August. I certainly hope we break up from it well before then. I place the measured move line around where I think we old break upward from if we can flip the 200ma back to solidified support. It of course could actually take much longer to break up from the wedge but even if it did the lowest price of the wedge is really not that terrifying in my opinion and would instead just be a phenomenal buying opportunity if we were allowed to accumulate mote that cheap. Because of other major supports not shown here however going below 70k for anything but an extremely brief wick seems an incredibly low probability. *not financial advice*

Will Solana experience a major correction again?Hello everyone, let's look at the 1D SOL to USD chart, in this situation we can see how the price is moving in the formed downward channel, where the price is currently recovering again.
Let's start by defining the targets for the near future that the price has to face:
T1 = 133 USD
T2 = 145 USD
Т3 = 155 USD
Т4 = 167 USD
Now let's move on to the stop-loss in case the market continues to fall:
SL1 = 121 USD
SL2 = 111 USD
SL3 = 103 USD
SL4 = 95 USD
If we look at the RSI indicator, we can see how the movement is constantly moving in the lower part of the range, where we have another downward bounce, and here we can see how we are approaching a test of the local uptrend that is close to breaking.

Bitcoin in a falling wedge / bull pennant It’s hard to say where it will. Break up from ths pennant, I put the dotted measured line in an arbitrary spot which will almost certainly have to be readjusted and most likely further down than where I placed it but if it were to somehow break up from the wedge by then and confirm that breakout the target would be in the 145k zone. *not financial advice*

Will BTC drop to further supports?Hello everyone, I invite you to review the current situation on BTC. When we enter the one-day interval, we can see how the BTC price is moving under the local downtrend line. What's more, we can see here how we broke the uptrend line at the bottom, but we are still above the main uptrend line.
Currently, we can see how the price is based on support at $ 79,339, but if we leave this support at the bottom, we still have strong support at $ 72,294, which is located at the golden FIB point 0.618, under it we can see the main trend line passing and then support at $ 62,217.
Looking the other way, in a situation when the trend reverses, we can expect resistance at $ 85,562, then resistance is visible at $ 90,843, the next significant resistance is at $ 97,888, behind which we already have a very strong resistance zone from $ 103,060 to $ 109,481.
On the MACD indicator, we can observe the continuation of the ongoing downward trend, in which at the moment there is no signal for the price to return. However, it is worth looking at the EMA Cross 50/200 indicator here, which, despite a strong decline, still maintains an upward trend, which may have a positive impact on the price in the coming weeks.

ETC/USDT 1D chart reviewHello everyone, let's look at the 1D chart etc to USDT, in this situation we can see how the price moves in a slight side trend in which you can see the output sideways from the downward trend line.
However, let's start by defining goals for the near future the price must face:
T1 = 22.25 $
T2 = = $ 25.63
Т3 = 28.48 $
T4 = 31.06 $
Let's go to Stop-Loss now in case of further declines on the market:
SL1 = 19.04 $
However, you can still see a strong support zone that strongly maintains the price from a larger decline zone from $ 17.11 to $ 15.82.
Looking at the RSI indicator, you can see a return to the center of the range despite slight price movements on the chart, however, there is still room for a potential new growth movement.

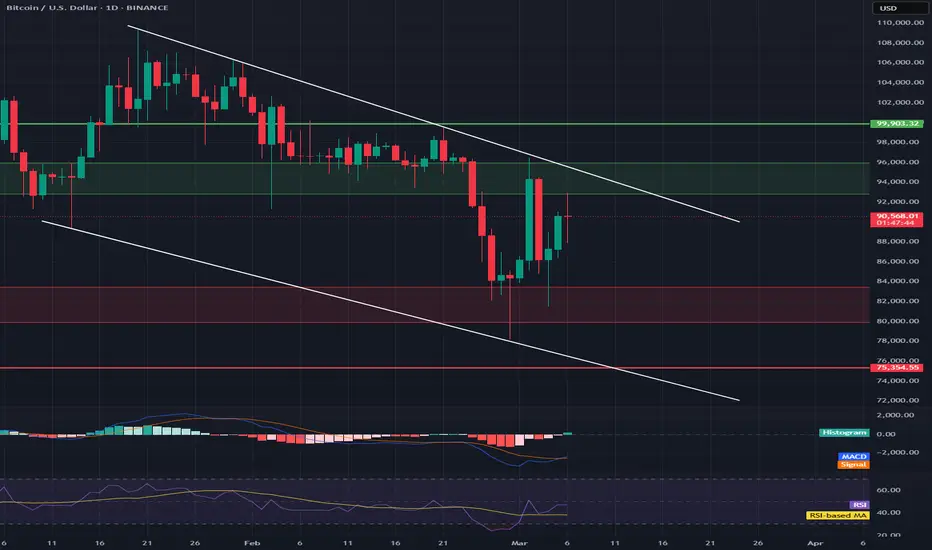
BTC/USD 1D Chart ReviewHello everyone, I invite you to review the current situation on BTC. When we enter the one-day interval, we can see how the BTC price is moving in the formed downtrend channel in which we are again approaching its upper limit.
Here you can see how the current rebound has approached the resistance zone from $ 92,851 to $ 95,975, which the price cannot break through, only when we exit it upwards will the path open towards resistance at $ 99,903.
Looking the other way, we can see that in the first place we have a significant support zone from $ 93,477 to $ 79,907, which currently manages to keep the price from larger declines. However, when the zone is broken, we can see the price going down to the level of $ 75,354.
On the MACD indicator we can observe a fight to return to the upward trend in which we have a lot of room for price increases, while on the RSI indicator we are approaching the middle of the range which still gives room for growth, however, at this level we could previously see a reaction, which is something to watch out for.
Will SOL start growing now that Trump has announced the reserve?Hi everyone, let's look at the 1D SOL to USD chart, in this situation we can see how the price is moving in an ascending channel where it is currently struggling to stay in the lower part of the channel.
Let's start by defining the targets for the near future that the price has to face:
T1 = 172.96 USD
T2 = 202.57 USD
Т3 = 223.84 USD
Т4 = 250.58 USD
Now let's move on to the stop-loss in case the market continues to fall:
SL1 = 139.90 USD
SL2 = 114.89 USD
SL3 = 94.76 USD
SL4 = 74.35 USD
It is worth looking at the MACD indicator where we can see how low we have gone much lower than during the previous declines, which could potentially indicate that the price will try to go up if the ongoing bullish trend is maintained.
