ETH - USDT, 1D Interval Resistance and Support Hello everyone, let's look at the ETH to USDT 1 day chart. As you can see, the price is moving in the downtrend channel, which is important in its lower part.
Let's start with setting support and as you can see ETH has a strong support zone from $1129 to $883 ahead, moreover looking at the recent move we can mark the $974 level as a strong place where the price may turn around.
Now let's move to the resistance line, as you can see the first resistance is $1301, if you manage to break it, the next resistance will be $1444, $1555 and $1669.
Looking at the CHOP indicator, we see that in the 1-day interval, the energy is strongly charged, the MACD indicator indicates the continuation of the downward trend, and the volume shows little interest on the part of sellers and buyers.
1daychart

An update/followup on the tezos inverse head & shoulder pattern Much like the algo chart, tezos has formed an inverse head in shoulders inside a slightly bigger inverse head and shoulders and now has 2 necklines which means 2 breakout targets. Still developing for now but it appears the it is confirming the first pink neckline as support here. *not financial advice*

Daily review of BTC interval 1DHello everyone, let's look at the BTC to USDT 1 day chart. As you can see, the price is moving below the downtrend line.
Let's start with determining the support and as you can see in the first place we have a strong support zone from $ 16,158 to $ 15,602, but if the price drops below this zone, we have the next support only at the price of $ 14,011.
In the case of resistance, we have a very significant zone between $18,543 and $19,236, only a breakout of this zone will open the way to around $21,437.
Looking at the CHOP indicator, we can see that on the 1-day interval, the energy is slowly starting to gain strength, while the MACD indicates a downtrend. What's more, on the volume indicator, we see the advantage of sellers.

ETH - USDT, 1D Interval Resistance and Support Hello everyone, I invite you to review the ETH/USDT chart on a 1-day interval, which can be noticed right away is a layout on the chart very similar to that of BTC. This is how we can mark the triangle in which the price is moving with the yellow lines.
Using the fib retracement tool, we can set support and here we see that we first have a strong support zone from $1180 to $1133, then we have support at $1075.
On the other hand, we can see that we have strong resistance in the zone from $ 1378 to $ 1450, only when we manage to break this zone we can go towards $ 1553.
It is also worth marking the local downtrend line that the price must overcome upwards in order to move towards the designated resistance zone.
As you can see on the CHOP index on the 1-day interval, the energy is exhausted, while the MACD confirms that we are moving in a downtrend.

Daily review of BTC interval 1DHello everyone, I invite you to a short review of the BTC situation in a pair to USDT on a 1-day interval and here we can mark a triangle in which the price moves.
Using the fib retracement tool, we can set support and here we see that we first have a strong support zone from $16582 to $16139 which coincides with FIB 0.61 and FIB 0.78, then we have support at $15591.
On the other hand, we can see that we have strong resistance in the zone from $ 18529 to $ 19233, it coincides with the level of 0.5 FIB and 0.61 FIB.
As you can see on the CHOP index on the 1-day interval, the energy is exhausted, while the MACD confirms that we are moving in a downtrend.

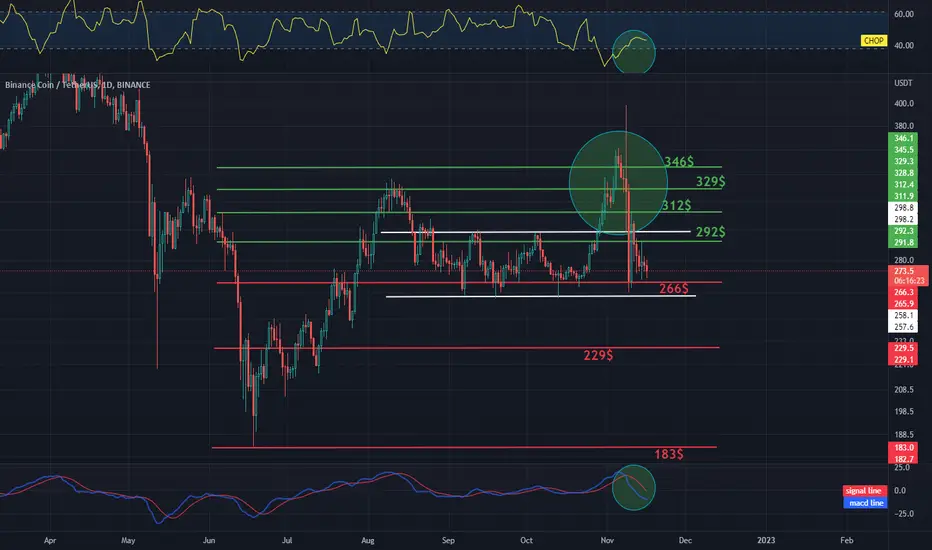
BNB / USDT 1D INTERVAL, Support and ResistanceI invite you to review the BNB to USDT chart on a 1-day interval.
Let's start by marking the sideways trend channel with white lines, which, as you can see, the price went down for a while, but quickly turned back and is currently staying in this channel.
Now let's move on to checking with the Fib Retracement tool what support the BNB price has in case of further declines and here we see that we first have support at $266, but if the price goes lower, we have further support at $229 and $183.
Now, in the same way, we will check what resistance we can expect when the price starts to rise and we see that the first resistance is at $292, the next resistance is $312, $329 and $346.
Please also look at the CHOP index which indicates that the energy is in consolidation, and the MACD indicator indicates that we are in a downtrend.
BNB / USDT 1D INTERVAL, Support and ResistanceI invite you to the BNB chart, just like its predecessors, on a 1-day interval. As we can see, the BNB price is moving in a triangle marked with blue lines.
At the beginning, it is worth checking what support BNB has on its way when the price of the token starts to fall again and so we see that in the first place we have a strong resistance zone that starts at $ 276 and ends around $ 261, this is an important zone that already previously held the price.
Now let's move on to the resistance line, as you can see the first resistance that the price has to face is $293, only when we manage to overcome it upwards we can move towards the next resistances at $313, the next at $329 and $346.
Let's now pay attention to the CHOP index, where you can see that the energy is growing very slowly, while the MACD indicator on the one-day interval indicates a downward trend.

Daily review of ETH interval 1DHello everyone, let's look at the ETH to USDT chart on a one-day timeframe. As you can see, the price is moving in a triangle marked with blue lines.
Let's start with the support line and as you can see the first support in the near future is $1209, if the support is broken then the next support is $1119 and $1046.
Now let's go from the resistance line, as you can see the first resistance is $1275, if you manage to break it, the next resistance will be $1310, $1342 and $1388.
Looking at the CHOP indicator, we see that the energy is exhausted on the one-day timeframe, and the MACD indicator indicates a downtrend.

VET / BTC 1Day IntervalAs you can see, VET in comparison to BTC is moving above the support zone, which has already defended the price against further declines.
We are currently moving in a local sideways trend channel, which can be used for short-term plays.
If the price starts to rise, it has a strong resistance zone from 181 to 237 satoshi on its way.

ETH - USDT, 1D Interval Resistance and Support I invite you to discuss the behavior on the ETH versus USDT chart. We can see that the price from June to September moved above the uptrend line, which we left the bottom on September 18, moving in the downtrend channel marked by blue lines.
Despite this, the price of XRP came up from this channel, after negative news about the FTX exchange, it dived quickly and returned to the downward channel.
In recent days, the price has moved above the local uptrend line, but now it has to overcome the downward trend in order to return above it.
Now, with the help of the Fibonache tool, we will mark the support zones for the XRP price, and as you can see, we have a support zone from one thousand three hundred twenty six dollars to one thousand one hundred thirty five dollars where the price is currently located, then we have support lines at a price of eight hundred eighty five dollars.
We can also check that a strong resistance zone, when the price starts to rise, we have from one thousand six hundred and seventy-four dollars to one thousand eight hundred and thirty-five dollars, but before that we have to overcome two places of resistance at one thousand five hundred and fifty-four dollars and before that, one thousand four hundred and forty-two dollars.
The CHOP index indicates that the energy is depleted on the one-day interval, the makdi indicator shows a downward trend, and on the volume we see a small red candle that says that sellers have an advantage on November 11th.

XRP / USDT 1daychartHello everyone, I invite you to review the XRPUSDT chart for one day. As we can see, the price dived strongly and quickly returned to the uptrend line.
It is worth noting that the price has two trend lines on its way that must be overcome, so we can see that XRP has already tried to overcome the first trend three times.
Now let's move on to the designation of the support line and in this situation we can see that the first support is at $ 0.35, the second at $ 0.32, the third at $ 0.30 and the fourth at $ 0.28.
Likewise, we will set the resistance lines that the price must overcome in order to continue rising. We have the first resistance at $ 0.40, the second at $ 0.46, the third at $ 0.55 and the fourth at $ 0.64.
Now let's move to the CHOP index which indicates that the energy is slowly starting to rise, on the MACD indicator we can see that on the one-day interval we are in a downward trend, and the volume shows a large green buying candle, while today the selling candle has a small advantage.

An even bigger inverse h&s pattern appears on ALGOOn our way to hit the 2 targets I posted about previously from former inv h&s neckline breakouts, algo has now brought price action above an even higher inverse head and shoulder neckline. Stoch RSI is pretty over extended at this point so it would not surprise me at all if we see a dip back down to retest the neckline or even a few wicks or a candle close below the neckline before we are ready to validate the breakout above this new neckline. Of course, it could also just decide it wants to pump all the way to our next measured move target with no correction at all. I will keep hodling, but if I was leveraged i would dial down a good portion of my leverage after hitting the previous targets and try to add it back in upon a successful retest of the new neckline as support…if we do dip below the neckline as long as it holds the 50ma as support any dip below should be temporary. We maintain overall support on the 50 and then solidify support on the white neckline here we will likely validate another inv h&s breakout by the time algo’s golden cross occurs. *not financial advice*

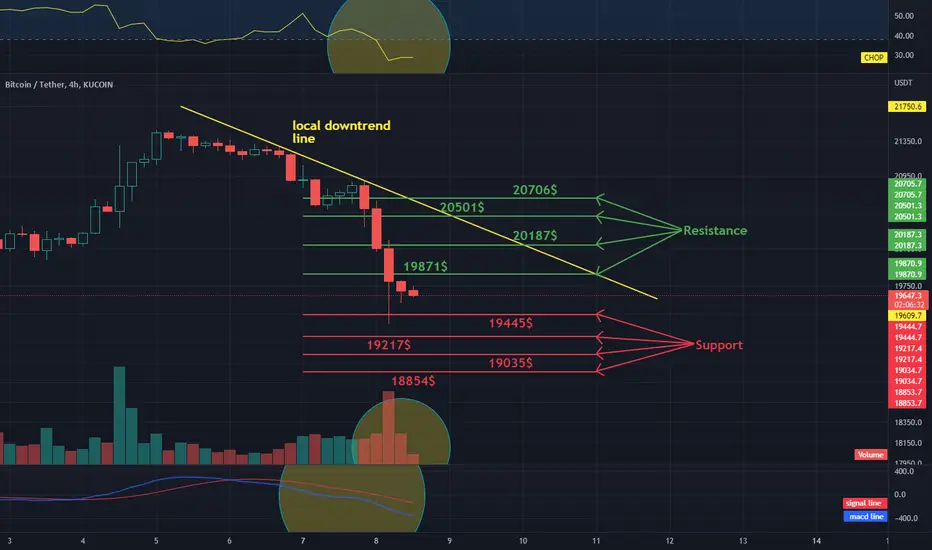
Daily review of BTC interval 4HHello everyone, let's take a look at the BTC to USDT chart, in the 4 hour timeframe. As you can see, the price is moving below the local downtrend line.
Let's start with the designation of the support line and as you can see the first support in the near future is $ 19,445, if the support breaks down, the next support is $ 19,217, $ 19,035 and $ 18,854.
Now let's move to the resistance line as you can see the first resistance is $ 19,871, if you can break it the next resistance will be $ 20,871, $ 20,501 and $ 20,706.
Looking at the CHOP indicator, we can see that in the 4-hour interval the energy has been depleted, the MACD indicator shows a local downward trend. It is also worth adding that the volume is getting smaller and we have the first small green candle.
UNIUSDT 1D Interval- Targets and StoplossPlease take a brief overview of the UNI versus USDT chart for 1 day.
All information is included in the chart.

AVAXUSDT 1D TARGETS and STOPLOSSHello everyone, let's take a look at the 1D AVAX to USDT chart as you can see the price is moving above the local uptrend line.
Let's start by setting goals for the near future that we can consider:
T1 - $ 18.74
T2 - $ 21.01
T3 - $ 23.32
T4 - 25.35
and
T5 - $ 28.14
Now let's move on to the stop loss in case of further market declines:
SL1 - $ 16.53
SL2 - $ 14.14
SL3 - $ 12.22
SL4 - $ 10.16
and
SL5 - $ 7.43
Looking at the CHOP indicator, we can see that in the 1D range the energy has increased significantly, and the MACD indicator shows a downward trend.

BNB / USDT 1D INTERVAL, Resistance and SupportI invite you to review the BNB / USDT chart, this time on a one-day intervale. As you can see, the price after a few attempts overcame the tendency.
Currently, we can see that we are moving in a triangle marked with yellow lines.
Now let's move on to marking the places of support that we can take into account in the near future. And as you can see, we have the first support at $ 331, the second support at $ 321, the next at $ 312 and $ 298.
Likewise, we mark the places of resistance for the BNB price, and here we see that the first resistance is at $ 351, if we manage to break it, we have the second resistance at $ 367, the third at $ 380 and the fourth at $ 392.
It is also worth adding that the current places of resistance create a strong resistance zone for the price and only after breaking it we can expect bigger increases.
Please take a look at the CHOP index, which indicates that energy is starting to rise, while the MACD indicator shows an upward trend. However, we can see that the blue line is starting to turn back and when it crosses the red one from above it will confirm the trend shift to downtrend.

Algorand appears to finally be triggering the inv h&s breakoutJust needs to flip the 1 day 200ma (in blue) to solidified support and it should reach both breakout targets not so long after. If it does I’m pretty confident it will see a golden cross in its near future. *not financial advice*

LTCUSDT 1D Interval - Targets and StoplossHello everyone, let's take a look at the 1D LTC vs. USDT chart as you can see we managed to come out of the first trend and we are currently moving above the local uptrend line.
Let's start by setting goals for the near future that we can consider:
T1- $ 76
T2- $ 87
T3- $ 98
T4-114 $
and
T5-134 $
Now let's move on to the stop loss in case of further market declines:
SL1- $ 65
SL2- $ 60
SL3-56 $
SL4-52 $
and
SL5- $ 47
Looking at the CHOP indicator, we can see that in the 1D range the energy has been used, while the MACD indicator shows an upward trend.

BNB / USDT 1D INTERVAL, Support AND ResistanceHello everyone, let's take a look at the BNB to USDT chart in 1D intervale. As you can see, the price came out of the sideways channel and is currently hovering over the local uptrend line.
Let's start with the designation of the support line and as you can see the first support in the near future is $ 335, if the support breaks down, the next support is $ 320, $ 308 and $ 296.
Now let's move from the resistance line as you can see the first resistance is $ 361, if you can break it the next resistance will be $ 374 and $ 390.
Looking at the CHOP indicator, we can see that the energy has been used on the 1-day intervale, and the MACD indicator shows an upward trend.

Speculative double bottom on digibyteDigibyte has done nothing to show that its about to reverse its downtrend yet, however we are starting to see the inklings of a possible double bottom forming. This is still so early in the pattern that its almost pure speculation on my part at this point. You should never try to trade a pattern until it has confirmed either a breakout or a breakdown. Although this could easily end up a fakeout that sends digibyte lower continuing its downtrend, with so many alts recently seeing bullish surges there is certainly a chance this double bottom could end up playing out. If it were to it would be close to a 180% gain from this level. WE can see there is also a possibility here in the near future of a golden cross. The fact that many other alt coins have recently seen successful golden crosses with QNT leading the way, gives us bullish confluence that increases the probability that digibyte could also experience a successful golden cross in the near future. Still mostly speculation at this point, but just enough bullish confluence to keep an eye on this one and see how it develops. *not financial advice*

Matic nearing a potential golden cross. 2 current bull targetsIf the golden cross occurs and sustains itself, we should see both of these bullish targets hit in the near future. We are currently above the yellow neckline and would reach the yellow target first. On the way there it would take us above the white channel, and flipping that channel to solidified support would validate its breakout and take us to the white price target. Best to keep an eye on the top trendline of the white channel as it is imperative that we flip its current resistance to solidified support in order to reach either target. *not financial advice*

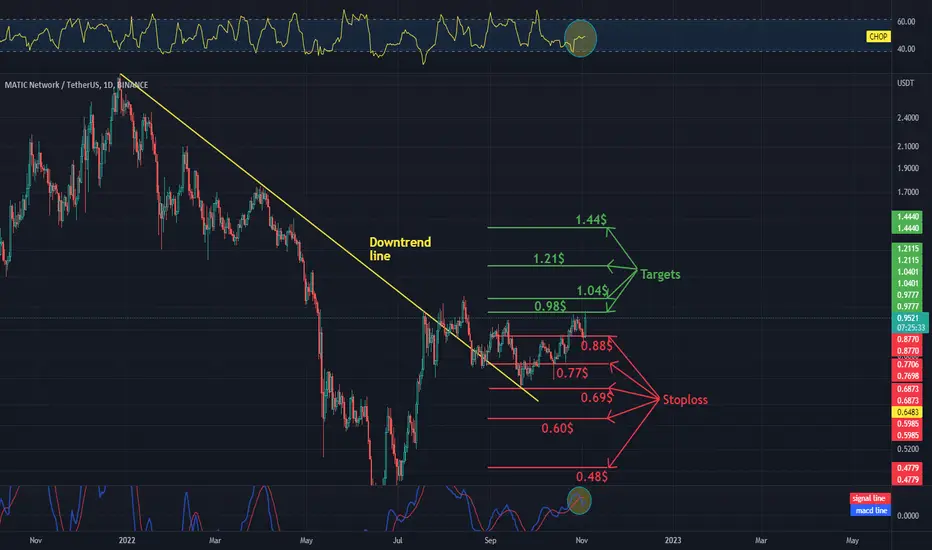
MATIC / USDT 1D chart Targets and StoplossHello everyone, let's take a look at the 1D MATIC to USDT chart as you can see the price is moving above the downtrend line.
Let's start by setting goals for the near future that we can consider:
T1 = $ 0.98
T2 = $ 1.04
T3 = $ 1.21
and
T4 = $ 1.44
Now let's move on to the stop loss in case of further market declines:
SL1 = $ 0.88
SL2 = $ 0.77
SL3 = $ 0.69
SL4 = $ 0.60
and
SL5 = $ 0.48
Looking at the CHOP indicator, we can see that in the 1D range we have more and more energy, and the MACD indicator shows a downward trend, but it turned sharply up when it crosses the red line from the bottom, confirming the upward trend change.
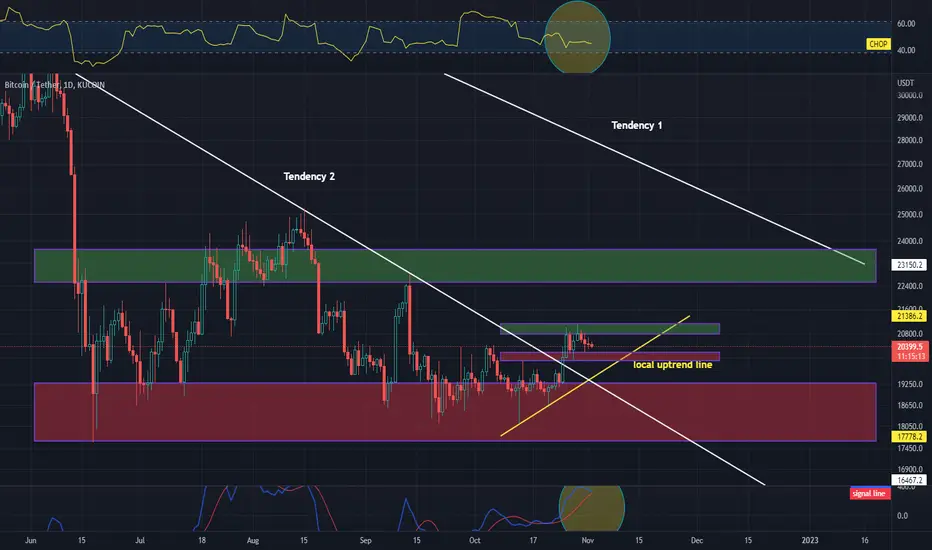
Daily review of BTC interval 1DHello everyone, I invite you to the BTC / USDT review on a 1 day interval, as you can see locally the price is above the uptrend line and above the first trend.
Let's move on to determining the support as you can see the first support zone in the near future starts from $ 20,225 to $ 19,974, while the next support zone is much larger and starts from $ 19,295 to $ 17,640.
If we look the other way around, we'll set the points of resistance and in this situation the first resistance zone starts from $ 2790 to $ 21119, while the second resistance zone starts from $ 22,510 to $ 23,675.
Please pay attention to the CHOP index which indicates that in the 1D interval most of the energy has been used, and the MACD indicator indicates that we are close to a downward trend change.