GMTUSDT review 1D IntervalHello everyone, let's take a look at the 1D GMT to USDT chart as you can see the price has come out of the downtrend channel and is moving on the verge of returning to that channel.
Let's start by setting goals for the near future that we can take into account, in this case we have two zones of resistance
First from $ 0.7405 - $ 0.8305
and
Second from $ 1.0913 - $ 1.2240
Now let's move on to support in case of further market downturns, and as you can see in the chart, we have two important support zones
The first zone from $ 0.6099 - $ 0.5310 where the price is currently located
Looking at the CHOP indicator, we can see that in the 4H range the energy slowly starts to rise, while the MACD indicator shows a local upward trend.
1daychart

Daily review of BTC interval 1DHello everyone, let's take a look at the BTC to USDT chart on a 1 day time frame. As you can see, after leaving the uptrend channel, we are now in the downward trend channel.
Let's start by determining the support that the btc price has on its way and we can see that the price is at the upper end of the support zone which we have from $ 19,229 to $ 17,601.
Now let's move on to the resistance that btc has to overcome in the event of a price increase and we see that first we have a resistance zone from $ 19,774 to $ 20,798, then we have resistance lines at $ 21,449, then a support zone from $ 22,497 to $ 23,661.
Looking at the CHOP indicator, we can see that we have a lot of energy in the 1-day interval, while the MACD indicator shows a local upward trend.

Daily review of BTC interval 1DHello everyone, let's take a look at the BTC to USDT chart on a 1 day time frame. As you can see, the price is moving below the local downtrend line
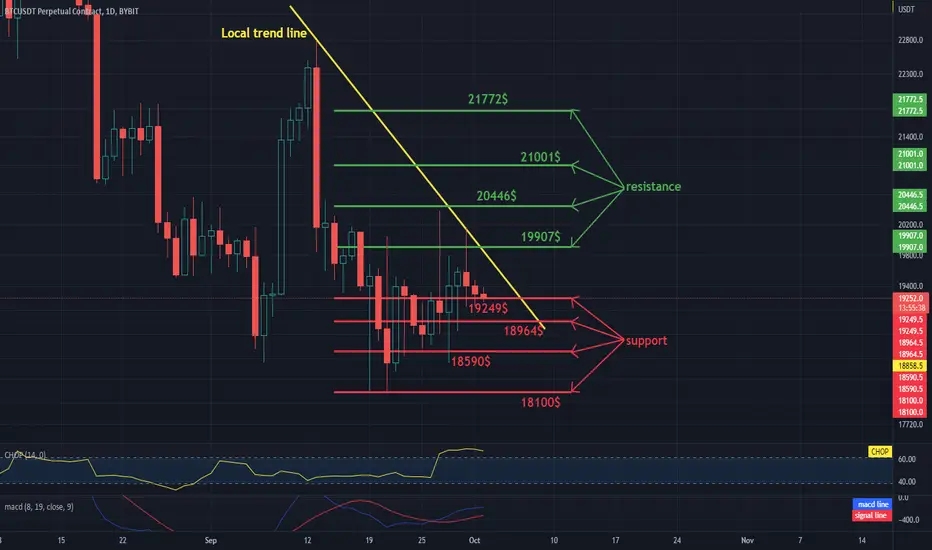
Let's start with the designation of the support line and as you can see the first support in the near future is $ 19,249, if the support breaks down, the next support is $ 18,964, $ 18,590 and $ 18,100.
Now let's move from the resistance line as you can see the first resistance is $ 19,907, if you can break it the next resistance will be $ 20,446, $ 21,001 and $ 21,772.
Looking at the CHOP indicator, we can see that we have a lot of energy in the 1-day interval, and the MACD indicator shows a local upward trend.
UNIUSDT 1D Interval- Targets and StoplossHello everyone, let's take a look at the 1D UNI to USDT chart as you can see the price is moving above the local uptrend line.
Let's start by setting goals for the near future that we can consider:
T1 - $ 6.65
T2 - $ 6.88
T3 - $ 7.08
T4 - $ 7.28
and
T5 - $ 7.56
Now let's move on to the stop loss in case of further market declines:
SL1 - $ 6.35
SL2 - $ 6.08
SL3 - $ 5.86
SL4 - $ 5.64
and
SL5 - $ 5.33
Looking at the CHOP indicator, we can see that in the 1D range we have recovered a lot of energy and the MACD indicator shows a local upward trend.

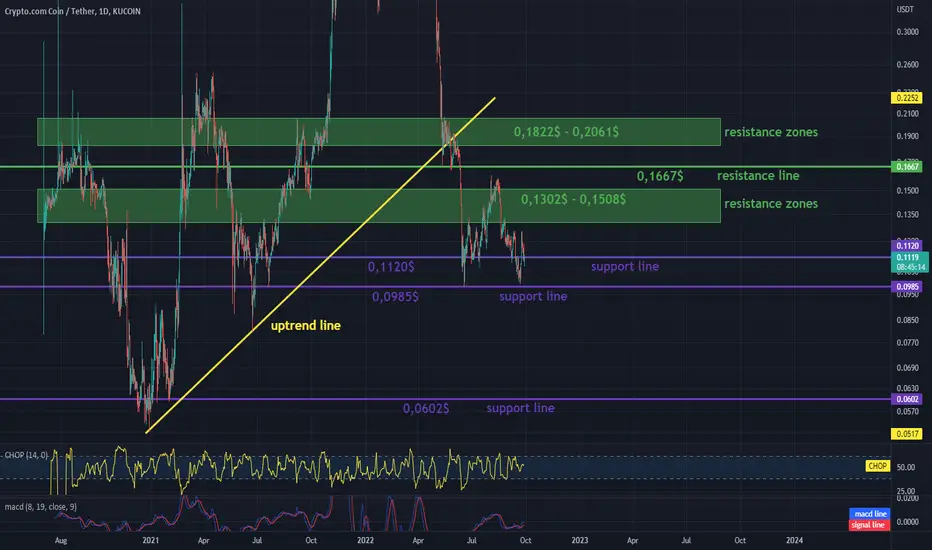
CRO / USDT 1D Interval- support and resistanceHello everyone, let's take a look at the CRO to USDT chart on a 1 day time frame. As you can see, the price is moving below the uptrend line.
Let's start with the designation of the support line and as you can see the first support that the cro is currently based on is $ 0.1120, if the support breaks down, the next support is $ 0.0985 and $ 0.0602.
Now let's move from the resistance line, as you can see, the first resistance is in the zone from $ 0.1302 to $ 0.1508, if you manage to break it, the next resistance will be $ 0.1667 and then we have a second resistance zone from $ 0.1822 to $ 0.2061.
Looking at the CHOP indicator, we can see that we have regained some energy in the 1-day interval, and the MACD indicator shows that we are in an upward trend.
XRPUSDT situation after recent increases of 50%Hi everyone, let's take a look at the XRPUSDT chart on the 1 day interval because in recent days you have seen the price increase by about 50%. We continue to follow the long-lasting downtrend channel, but in the short term we exceed the local downtrend line.
Let's start with determining the support that the xrp price has on its way and as you can see the first support is at $ 0.4568, but if it is broken, we already have a support zone from $ 0.38 to $ 0.24.
Now we will pay attention to the resistance we have to overcome so that the price can continue to go up. We have the first resistance at $ 0.5328, the next at $ 0.6782, then we have two strong resistance zones, the first from $ 0.92 to $ 1.22 and the second from $ 1.31 to $ 1.60.
It is worth paying attention to the CHOP indicator which shows that the energy has already been used, while the MACD indicator shows an upward trend.

Daily review of BTC interval 1DHello everyone, let's take a look at the BTC to USDT chart on a 1 day time frame. As you can see, the price is close to exiting the current downtrend channel.
Let's start by determining the support that the price has in the event of a further correction, and as you can see, we have a support zone from $ 18,979 to $ 18,123 in front of us.
Now let's move from the resistance line, as you can see, the first resistance is $ 19,222, if you can break it, the next resistance will be $ 19,899, the third resistance at $ 20,462 and the fourth resistance at $ 21,003.
Looking at the CHOP indicator, we can see that on the 1-day interval most of the energy has been used and the MACD indicator shows that the blue line is approaching the red crossing from below, which could confirm the upward trend shift.

Updating the SOLUSDT chart from 4H to 1D - targets and stoplossHi everyone, let's update today's SOL analysis on the 4H interval as you can see The price went up a lot and on 1D intervale we got out of the downward trend line, breaking the previously designated short targets.
Let's start by setting goals for the near future that we can consider:
T1 - $ 31.60
T2 - $ 31.86
T3 - $ 32.06
and
T4 - $ 32.27
Now let's move on to the stop loss in case of further market declines:
SL1 - $ 31.35
SL2 - $ 31.04
SL3 - $ 30.79
SL4 - $ 30.54
and
SL5 - $ 30.19
Looking at the CHOP indicator, we can see that in the 1D range we still have a lot of energy for further moves, while the MACD indicator shows that in the long term we are entering an upward trend.

XRP continuing to hit bullish breakout targets!We can see the price action has hit the measured move breakout target of the blue symmetrical triangle…it is also now pumping above the 1 day 200ma on its way to hit the next target of the green channel it has also broken out of…once we hit that target we may see a retrace or slight correction or sideways consolidation before it continues upward because as you can see there is on this chart an even bigger triangle pattern with yellow trendlines that we have also broken above…I will save the target of that larger pattern for another idea. XRP continues to look very bullish. *not financial advice*

XRPUSD above the symmetrical triangle on 1day chartShould it manage to flip the top trendline of the triangle to solidified resistance we could see it head to the breakout target of 48 cents in the not so distant future. *not financial advice*

PRTS - short breakout from horizontal supportbroke horizontal support
Setup:
NASDAQ:PRTS 1D chart
SL placed above last pullback
enter with limit order @ low of range level
TP @ level of previous resistance turned support from 2019/20

Algorand looks ready to trigger its inv h&s patternAfter doing a fakeout above the yellow neckline we now have price action for king above the white neckline….not sure which one will be the most valid but if the white neckline reaches its target they both do. I imagine it will be retesting the 1day 200ma before too long. *not financial advice*

XRPETH continues to rise above a bigger inv h&s necklineAfter reaching the breakout target of a much smaller inverse head and shoulder pattern, the price action on the xrpeth chart has continued to pump and is now sitting above 2 necklines of a much bigger inv h&s pattern. The only resistance it is yet to break above is the yellow horizontal neckline of a double bottom pattern that also doubles as a horizontal channel. Flipping that top yellow horizontal line to solidified support will be the final confirmation we need to know that the inv h&s pattern is going to get validated. There are 2 different breakout targets posted here for the inv h&s pattern. The smaller one is for if the white neckline is more valid and the larger target is for is the turquoise neckline is more valid. I get the feeling both targets will be reached in due time. I will post the chart of the previous idea that showed the smaller inv h&s not shown here down below. *not financial advice*

Ethereum needs to get back above the brown neckline asap. Ethereum is currently finding support near the bottom of the white descending channel. However, it needs to get back above the brown neckline of the head and shoulders pattern as soon as possible to avoid triggering the breakdown of the head and shoulders which has a target all the way down in the $800s. In order to do so it will essentially need to break upward out of the descending channel within the next few weeks. *not financial advice*

Review of the ETH / USDT chart on the 1D intervalHello everyone, let's take a look at the ETH to USDT 1 day chart. It is worth noting that after a long time when the ETH price was moving in the uptrend channel marked in yellow, however, a few days before the MERGE event, the price of eth started to decline and we entered the local downward trend channel marked in blue.
Let's start with the designation of the support line and as you can see the first support where the price is currently at is $ 1317, if the support breaks down and the price goes further down, it has a support zone from $ 1239 to $ 1083 in front of it.
Now let's move from the resistance line, as you can see, the first resistance is $ 1454, if you can break it, we have two zones to go. The first resistance zone is from $ 1564 to $ 1653, while the price eth will break it, another zone is from $ 1707 to $ 1864.
Let's pay attention to the CHOP indicator where we can notice that we have less and less energy for further moves, and the MACD indicator confirms that we are in a downward trend.

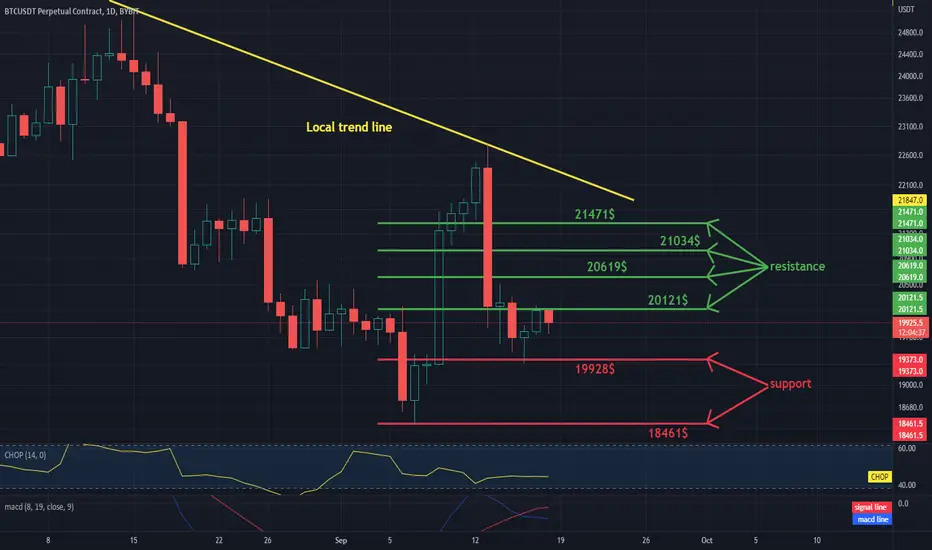
Daily review of BTC interval 1DHello everyone, let's take a look at the BTC to USDT chart on a 1 day time frame. As you can see, the price is moving below the local downtrend line.
Let's start with the designation of the support line and as you can see the first support in the near future is $ 19,928, if the support breaks down, the next support is $ 18,461.
Now let's move from the resistance line as you can see the first resistance is $ 20121, if you can break it the next resistance will be $ 20,619, $ 21,034 and $ 21,471.
Looking at the CHOP indicator, we can see that in the 1-day interval we have little energy and the MACD indicator shows a local downward trend.
XRP dominance is currently retesting the neckline of inv h&s.Currently one candle close above the neckline and the current candle is so far retesting that neckline as support. If this validates we should see xrp gain a considerable amount of market dominance back that it had lost over the last few years. May take a few candles to confirm..could also easily dip back below the neckline for a bit as well as is common on most inv h&s patterns after the first initial breach above the neckline. Also possible it could trigger in the next few candles *not financial advice*

Daily review of BTC interval 1DHello everyone, let's take a look at the BTC to USDT chart on a 1 day time frame. As you can see, price is moving above the local uptrend line.
Let's start with the designation of the support line and as you can see the first support in the near future is $ 20107, if the support breaks down, the next support is $ 19,375 and $ 18,442.
Now let's move from the resistance line as you can see the first resistance is $ 20,501, if you can break it the next resistance will be $ 20,938, $ 21,294 and $ 21,666.
Looking at the CHOP indicator, we can see that most of the energy has been used in the 1-day interval, while the MACD indicator shows that we are maintaining an upward trend.

Daily review of BTC interval 1DHello everyone, let's take a look at the BTC to USDT chart on a 1 day time frame. As you can see, the price is moving below the local uptrend line.
Let's start with the designation of the support line and as you can see the first support where the price is currently at is $ 20.02, if the support breaks, the next support is $ 19,401 and $ 18,618.
Now let's move from the resistance line as you can see the first resistance is $ 21,068, if you can break it the next resistance will be $ 21,737, $ 22,223 and $ 22,738.
Looking at the CHOP indicator, we can see that on the 1-day interval, the energy slowly begins to increase, while the MACD indicator shows that despite the decline, we are in an upward trend.

Daily review of ETH interval 1DHello everyone, let's take a look at the ETH to USDT chart on a 1 day time frame. As you can see, price is moving above the local uptrend line.
Let's start with the designation of the support line and as you can see the first support in the near future is $ 1639, if the support breaks down, the next support is $ 1519 and $ 1402.
Now let's move from the resistance line as you can see the first resistance is $ 1728, if you can break it the next resistance will be $ 1800, $ 1898 and $ 2034.
Looking at the CHOP indicator, we can see that some energy has been used in the 1 day interval, but we have a lot to continue moving, and the MACD indicator shows an uptrend.

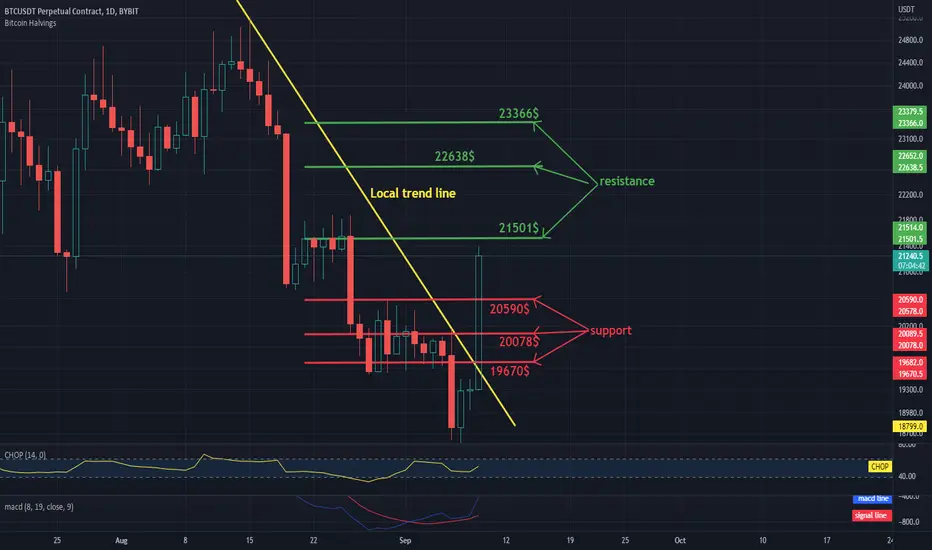
Daily review of BTC interval 1DHello everyone, let's take a look at the BTC to USDT chart over a 1 day timeframe. As you can see, the price has risen above the local downtrend line and has rebounded nicely from the recent declines.
Let's start by marking the resistance line, as you can see, the first resistance is $ 21,501, if you can break it, the next resistance will be $ 22,638 and $ 23,366.
Now let's move on to the designation of the support line and as you can see the first support in the near future is $ 20,590, if the support breaks down, the next support is $ 20078 and $ 19,670.
Looking at the CHOP indicator, we can see that on the 1-day interval, the energy begins to slowly increase, and the MACD indicator shows that we have changed the downward trend into an upward trend.
DXY appears to be triggering a rising wedgeShown here on the 1 day chart is a rising wedge that is probably most valid on a 4-8hr time frame. However I wanted to show the 1 day 50ma (in orange) so I decided to post this idea on the 1 day time frame. We can see a big red candle has formed here and almost already reached the breakdown target of the wedge of 108. My thought was it was going to wait until the 1 day 50ma climbed up to the 108 zone for the breakdown to reach this target and the retest the 1 day 50ma’s support but it appears to be heading to this breakdown target much more quickly than I expected. We can see the green target I have above the wedge was almost reached to its full target but fell ever so slightly short…falling short of reaching 100% of the target suggests the bullish momentum for dxy may be waning and we could see a trend change to the down trend sooner than later. Especially if this current bearish pattern reaches 100% of its breakdown target or even more so, loses the 1 day 50ma as support. If we hit the full target and then it flips the 1 day 50ma to solid resistance the downtrend will likely be confirmed. If so it could mean yet another lower high has been established for DXY meaning that in the grand scheme of things the DXY would be very much still in a macro bear trend, despite all the FED induced”strength” it has seen as of yet…the recent surge in strength while everything else has plummeted does seem to bear the hallmarks of some sort of final exit pump but that is of course mostly speculation on my part. Al eyes on the 1 day 50ma *not financial advice*

Update Long-term BTC analysisHi everyone.
Today we have marked an uptrend channel with yellow lines, which has been broken downwards and now the price is below the local downtrend line.
As you can see, we have an important support zone:
- support zone, where the BTC price is currently from $ 20,957 to $ 17,669, if the price drops below the designated zone, we can expect further drops to around $ 12,000.
Then we have the first resistance zone from $ 22,368 to $ 23,058, if we break it, we have a resistance zone from $ 24,696 to $ 26,196. A break from this zone may cause further gains towards the resistance at $ 28,754.
Also noteworthy is the CHOP indicator, which indicates that most of the energy has been used, and the MACD indicator, which indicates that at this moment we have broken the downward trend and we are in an uptrend locally.
