What goals for ZEUS?Hi everyone, let's look at the 1D ZEUS to USDT chart, as we can see the price is moving in a local uptrend channel, where there is still potential for growth. However, here it is worth looking at the RSI indicator, which clearly indicates the crossing of the upper limit and the level at which the price usually reacted with a correction, which may indicate a potential change in the direction of the movement.
In such a situation, it is worth starting by setting a stop-loss in case the market decides to go into a downtrend:
SL1 = 0.904 USD
SL2 = 0.839 USD
SL3 = 0.733 USD
SL4 = 0.661 USD
SL5 = 0.571 USD
However, if the market decides to go further up in such a situation, we have clear goals for the near future, which the price must face:
T1 = 1.016 USD
T2 = 1.141 USD
T3 = 1.274 USD
T4 = 1.499 USD
1daychart

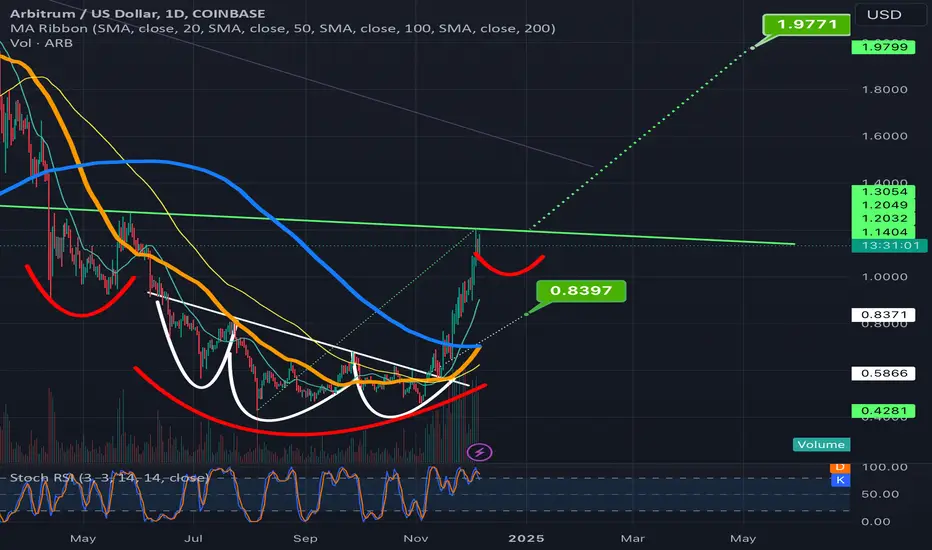
ARB breaking up from a bullflag that can take it above necklineArbitrum looks like it has probably founded the lowest depth of the right shoulder of it’s inverse head and shoulders here as it has now broken upward from this purple bullflag here and is now back above the 1 day 50ma(in orange). The breakout target of this flag will take price action above the neckline of the inverse head and shoulders pattern if it hit its full breakout target. We can also see that the bearish h&s that we were under the neckline of for several daily candle closes never progressed into getting validated as is often the case with bearish patterns in this phase of the bull market. I suppose there’s still a chance we could head bck under that light colored tannish neckline again but probability favor the upside at this point. *not financial advice*

Ada breaking up out of a Bull pennant.Target for the pennant hound be around $1.86 . I also noticed the.bitcoin dominance chart’s 200ma looks like its finally flipping back to resistance which if so will increase the probability of ADA hitting this pennant target as well as alt season finally officially starting. *not financial advice*

Firstsource solution 1 day chart suggesting bullish breakoutFirstsource sloution is looking in the uptrend .
Trendline is forming from 300 price levels to 360 . suggesting uptrend
Volume is Supporting in this uptrend .
RSI momentum is showing with breakout today. Signaling bullish momentum.
If price closed above 388 on daily chart further bullish Moment can be expected .
If price closed below 355 which is previous swing low on daily chart further bearish Moment can be expected .

Raymond 1 d chart signalling price action Raymond is looking in the uptrend after making a low near 1326. It is reversing from there on daily chart .
Ascending triangle pattern is forming and is about to complete the same .
Volume is Supporting in this uptrend .
RSI momentum is showing intact with higher high with Price in conjunction. Both are in same tandem . Signaling bullish momentum.
If price closed above 1829 on daily chart further bullish Moment can be expected .
If price closed below 1428 on daily chart further bearish Moment can be expected .

LINK/USDT 1D chart review Hello everyone, let's look at the 1D LINK to USDT chart, in this situation we can see how the price is moving in the local downward trend channel which we are currently fighting to go up.
Let's start, however, by defining the goals for the near future that the price must face:
T1 = $22.29
T2 = $23.98
T3 = $26.65
T4 = $28.54
Now let's move on to the stop-loss in case the market continues to decline:
SL1 = $19.65
SL2 = $16.58
SL3 = $14.54
SL4 = $12.73

Campus 1 dayChart Pattern : Inverse Head and shoulder Pattern
Increasing Volume
15% away from previous high
RSI > 60
Looks Bullish

Bitcoin Ascending Bullflag Breakout Target 140kI am still expecting significant resistance in the 120-130k range so to see this having a full target of 140k is pretty wild to me. Perhaps we have. Correction before reaching its full breakout target, or perhaps price sends a large wick above the resistance up there to hit this target before that resistance rejects price for a significant correction. Either way I do anticipate we rise to at least 120k on this next move up. *not financial advice*

Ondo’s parabolic move on the 1day chartThis is the same chart I jsut posted except this time it’s shown here on the 1day timeframe” It’s difficult to call what ondo just broke upward from a cup and handle because the handle is extremely small even on small time frames as small as the 1hr timeframe, however there is some bullish confluences that if you treat it the same way you would treat a cup and handle to ensure the breakout target, you find that the target is exactly at the 1.618 Fibonacci level which is a very common breakout level that things tend to climb two when the breakout up from a previous pattern and surpass their previous highs. Due to this confluence. Think we have enough to go by here to make a rough speculative guesstimate at least of what price target ondo may currently be heading towards. *not financial advice*

Bitcoin currently in an ascending bull flagI made a rough estimate of where the flag make breakout for where I placed the dotted measured move breakout target line. There’s a chance it could not hit the entire flag tRGET and instead only reach the breakout target of just the channel portion of the flag itself which would be a much lower target. Also always a possibility arising channel breaks to the downside though at the beginning of a parabolic phase during a bull market they usually break upwards. We will see what happens soon enough *not financial advice*

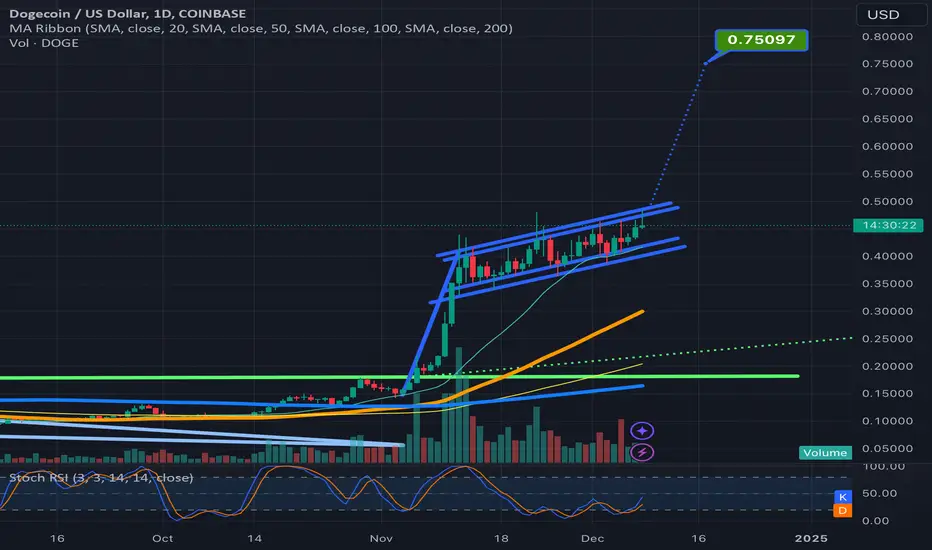
Doge can reach $.75 if it breaks upwards from ascending bullflagUsually an ascending channel like the one that is part of the bullflag on dogecoin’s 1 day chart beaks to the downside, except inside a parabolic phase of the bull market cycle. In the parabolic phase of a bull market cycle you can see several back to back rising wedges and ascending channels break to the upside so since we are really only 1-2 daily chart pattern breakouts into this current parabolic phase for the alt coin market, I think probability favors this ascending channel breaking upwards. If it does we also have the benefit of it being not only a channel but a bullflag as well and the target for such a breakout is around 75 cents. Furthermore if you flip to the weekly channel you would see that there is potential for the pole to be even longer than shown here on the daily timeframe, so I wouldn't be surprised if doge were able to overshoot the 75 cent target even. I noticed that the channel had valid trendlines on both the wicks and the candle bodies on both the bottom and top thats why the trendlines are doubled up, *not financial advice*
Bonk can pump 82% if it validated the bullflag bullish breakoutNo guarantee this pattern will break out, it could also extend the consolidation and morph into a completely different pattern, but at the moment it seems the best probability is a breakout upward considering we are only 1 big chart pattern breakout into the current long awaited altcoin market uptrend. *not financial advice* Please bonk responsibly.

Floki has an impressive chessboard at the momentMultiple overlapping bull patterns that will trigger eachother like a domino effect, It tart with the bull flag which we are already seeing begin to break out here. Fro here to the highest chart target is 111%. On the previous chart I posted on Floki, it had not yet been added to coinbase but we were speculating it would be and now it has. *not financial advice*

More proof Goldencross works immediately in this phase of bullJust like the char I posted before this one, I’m posting this simply to lllustrate how the golden cross (orange line crossing above the blue line) immediately resulted in a very pivotal bullish pump that coincided with a major fulcrum point on the chart recently on multiple different charts. More times than not in the other market cycles, when a golden cross occurs it usually takes a few weeks afterwards to know whether that cross will have its desired outcome or instead end up being a fakeout but lately I’ve noticed multiple charts have seen an instantaneous pump on the exact day of the golden cross, which is making me think that once we enter the 2nd parabolic phase of a bull market that that is when you can anticipate a golden cross to have its immediate intended effect its suppose to have with much much higher probability than all the other market phases including even the 1st half of the bull market. Anyways I wanted to illustrate that hypothesis here with the XLM chart as you can clearly see it’s a text book example, and I will try to put a link below to the previous example where this occurred as wel a link to the total2 chart which will have its golden cross in the next 102 daily candles.l One major reason I want to illustrate this is because within the next 1-2 daily candle closes the Total2 (aka altcoin market) chart is going to have its golden cross and it is currently trying to confirm the breakout upward from a cp and handle pattern which is a huge fulcrum point for it. So should the trend of instantaneous golden cross pump effects occurring the same daily candle as the cross itself, this could clue us into exactly when the real full on alt season will be about to kick off (which if correct, will be ignited by a big confirmation breakout pump within the next 1-3 daily candles). *not financial advice*

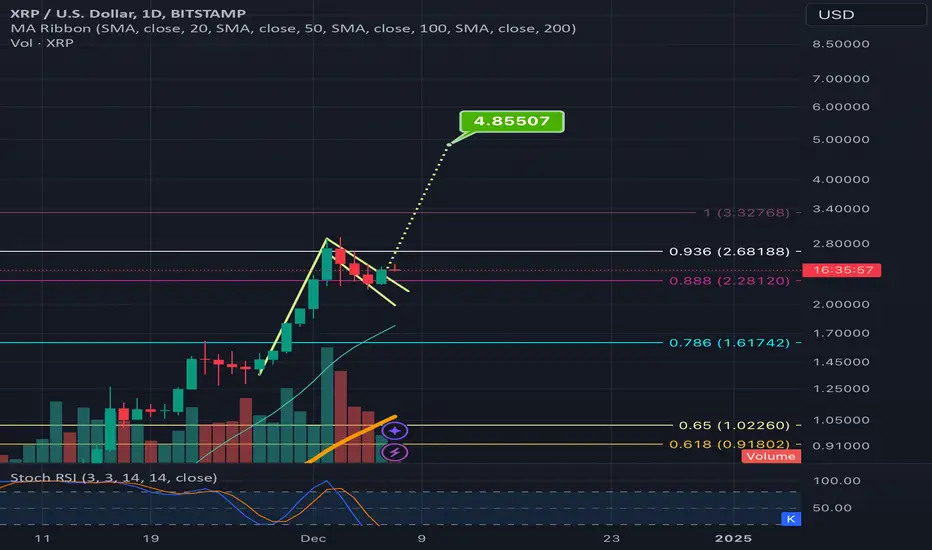
Logarthmic bullflag has an even larger breakout targetBrace yourself and fair warning this post is gonna get slightly more esoteric than some are comfortable with as it delves into numerology, so fair warning. I found it extremely interesting from a numerological standpoint when I saw @chartguy had predicted that this current xrp correction would ultimately find support on the .888 Fibonacci retracement level and as of now it appears it has. The number 38 as well as 888( aka 3 8s) has been coming up like crazy all the time for me this entire year, but then I also noticed it more than a few times specifically in reference to ripple and xrp. For example Ripple now has 38 billion xrp remaining locked in escrow. I found an iage during XRP’s 2016 pump of Brad on CNBC or fox business ot some channel like it and enxt to them they had put a graphic up on screen along side Brad Garlinghouse that said XRP had gone up 38,000% percent. Next fast forwarding back to a little earlierthis year, the last low xrp had put in as a bottom before finally slowly climbing back up to the blast off point was 38 cents. Because I had been seeing all these connections with 38 in regards to xrp and ripple but also in many other elements in my personal life, I bought some more xrp at 38 cents feeling like it would actually mark the most recent bottom and low and behold it did. Also the all time high for xrp on a few different exchanges is $3.80. Like I said above, another way to represent 38 is with 3 8’s aka (888). So on the lion’s gate portal this year 8/8/2024, 2024 numerologically reduces to 8 as well giving us the first time in quite awhile we have had 8/8/8 date like that, I was expecting something noteworthy to occur being that it’s a time that’s known for manifestation and abundance every year but with 3 8s instead of just the usual 8/8 it should be even more so, and sure enough ti was right on this weekend that Judge Torres issued her final judgement in the RIpple vs SEC case after 4 long years of waiting patiently for it to arrive. All this being said, when I then see that XRP corrected down exactly to the .888 Fibonacci level and is holding support there, if it does continue upwards from this level, it will simply be more confirmation and confluence to me that there is something significantly special and interrelated between xrp, and the numbers 38.88,888, 11, and 1111. I won’t go into the 11 significance too much in this idea as I’d prefer to focus on the 8s instead….so I’ll leave the numerology talk there for now and focus instead of the actual TA behind this logarithmic bullflag
Ankr’s breakout target from invh&s can bring 95% gains if soonAnkr is very close to completing its right shoulder on this fairly thicc inverse head and shoulders pattern it has formed. Hard to tell exactly when it will breach the neckline but one would assume that it’s probable for it to happen soon. *not financial advice*

XDC beginning to head to its bullish breakout targetsPosting an update this chart so I can show a zoomed in look at the daily price action with the measured move lines readjusted to the exact breakout points of the two chart patterns to provide ore accurate breakout targets. I will link the original chart idea i posted of these 2 patterns below. *not financial advice*

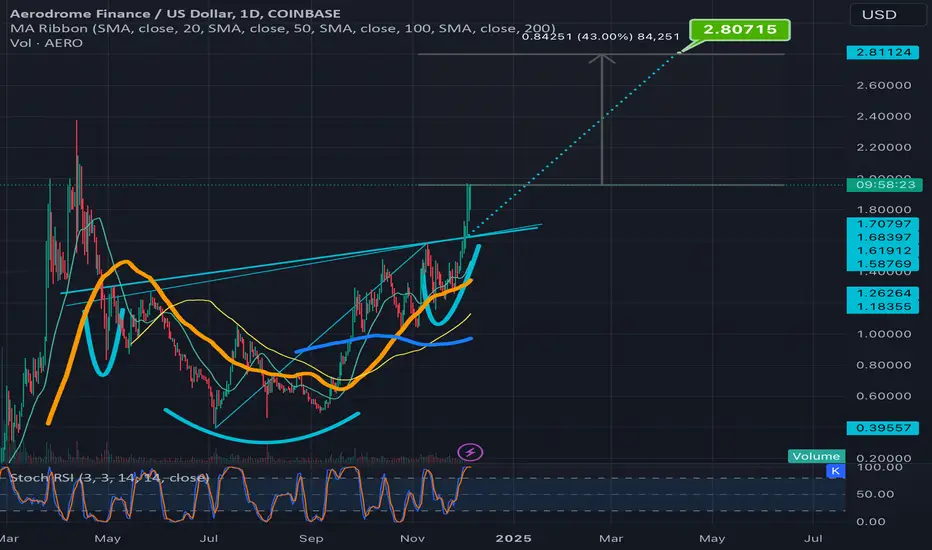
Aerousd breaking upwards from ascending inverse head & shouldersStill has about 41 percent of gains left to make between here and its full breakout targer. Will net a new all time high in the process. Not sure where it will go from there. could always overshoot or undershoot the target as well but most alts lately have been either hitting the target precisely or overshooting then. I like this particular unconventional inverse head and shoulders because it has 2 necklines both with the same breakout target. *not financial advice*
NEAR breaking up from invh&s and soon from symmetrical triangleIn order to reach the full inverse head and shoulder breakout target, NEAR will have to send price action well above the top trendline of this turquoise symmetrical triangle, in the process likely validating the breakout of that pattern too. *not financial advice*

Waves in a sleepy head inverse head & shoulders patternOnce price action wakes up the sleepy head pattern it can rise to $4.60 which is like a 10% gain from here if it were to hit the full breakout target. *not financial advice*

Arbitrum set to goldencross on next daily candle; invh&s in playWe can see after triggering the breakout of the smaller inverse head and shoulders and blowing past that target arbitrum has reached the perfect level that will cause this new inverse head and shoulders to materialize by correcting here and forming a right shoulder. We can also see that Arbitrum is just 1 day away from having it’s daily golden cross and considering many inverse head and boulder patterns in the altcoin market lately have been forming remarkably tiny right shoulders, Arbitrum also could follow suit and break up from the inverse head and shoulder neckline far sooner than you would normally ever expect these kind of patterns to do so. Also a chance it could form a normal shoulder here as well we wll know soon enough *not financial advice*
Dash filling out right shoulder after burj khaifa moveBy correcting here after dash’s big golden cross vertical slingshot in price action it is in the perfect zone to form a right shoulder to a newly materializing inverse head and shoulders pattern. The common theme for many inverse head and shoulders patterns this alt season has been very tiny right shoulders so there’s a decent chance it breaks above the neckline of the inverse head and shoulders before where the hypothetical right shoulder I have drawn on the chart reached it’s end. Always a chance it bucks the trend and ends up being even wider than what I drew too as the width of the shoulder would traditionally be. We will know soon enough As always dash and zcash see to be having some similar chart patterns. Nice to see privacy coins still matter enough to have a chance to make big gains this bull run and perhaps even surpass the previous all time highs if it keeps this up long enough *not financial advice*

Dash breaking up from double bottom on same day as goldencrossI’m starting to think my hypothesis has been proven at this point as yet another alt coin has its massive breakout pump on the exact same day pill candle it has its golden cross on. Dash now joins the countless other alt coins who have also broken up from the chart patterns with a big pum the day fo their golden cross. *not financial advice*
