1h

USDCAD BULLISH IMPULSEThe price reached the 38.2 fibo retracement, RSI value is around 40 with a big retracement cause of correction, MFI is high and STC give us a signal to go long

Possible restest to continue down after break of upward wedge At 1D we see a an upward edge that broke the trend line and the support line with a gap. Currently it looks like if it was retesting back to the gap and the resistance line (that used to be support). If it does retest, it would be a nice entry to the short side at the 1H after confirmation.
PS. I already entered the trade a little bit before that and it looks like it is coming back down.

NZDCHF BEARISH CORRECTIONThe price reached the lvl 127 bullish impulse and the historical price is near to reach. RSi has a divergence as MFI. NZD on CSI is on mid lvl and weakening and CHF is oversold and could be strengthened


LTCUSD 1H KELTNER CHANNEL BREAKOUTTrading Breakouts with Keltner Channel
When it comes to breakout trading, the Keltner Channel is a very powerful indicator. The Keltner Channel breakout system works best when volatility rises. However, the Keltner indicator measures not just the volatility, but it can also show anomalies in the price behavior.
Since the Keltner channel indicator is lagging in nature, we can use a secondary tool like the ADX indicator to give us more confluence. These two indicators can help us catch explosive breakouts.
With the ADX we measure the strength of the breakout. Generally, an ADX reading above the 20 level is considered to be the beginning of a bullish/bearish trend. Any reading below 20 signals is a period of consolidation.
The ADX needs to continue to rise to suggest that the trend is strong. When the Keltner Channel is used in combination with the ADX indicator, you can trade breakouts with objectivity.
Trigger conditions for buying breakouts:
Keltner Channel bands need to turn flat.
Price needs to break above the upper band.
ADX needs to cross above the 20 level.
Follow the above trading rules if you want to avoid most of the false breakouts.

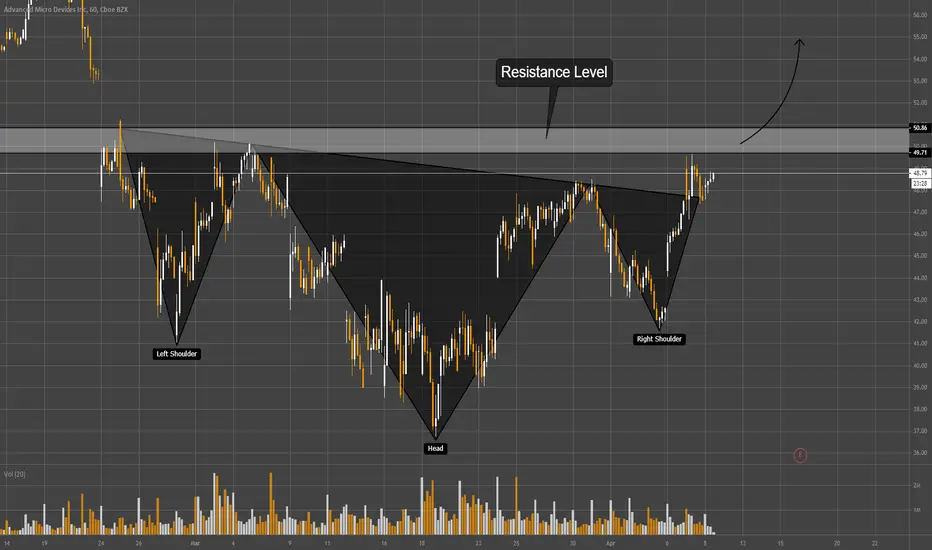
Inverse Head And Shoulders on AMDIf the resistance level 49.71-50.86 is broken, I expect growth of quotations.

GBPAUD 1H SCOTT BARKLEY "TRADE OF THE WEEK"THIS IS NOT A TRADE SIGNAL - All trade ideas are for educational purposes only,

GBP/USDThis is my latest on GBP/USD, using a muti-time framed analysis. This pair has been extremely bearish from a Monthly perspective and has found support around 1.2200, also included on the Weekly.
I have pulled a Fibonacci on the Daily from the impulse of March 10th, where price retraced to the 0.618 fib level and has now found support at the 0.5 (1.2200 price).
An opportunity lurks on the 4 hour perspective with a potential short and from a break out strategy perspective, we will wait for price action to break support and bottom of the bullish channel and make a push to the downside.
Please feel free to leave a comment and share your thoughts.
How does your analysis look?
Remember this analysis is not 100% accurate. No single analysis is. To make a decision follow your own thoughts.
This information given is not Financial Advice.


Head and Shoulders on J&JPrice consolidates below the resistance level 134.25-136.55 and the trend reversal model was formed. If bulls manage to break through this level, I expect price growth.


EurNZD smaller tf analysisEURNZD 1h tf analysis …...im looking to go short soon I see a nice rejection but I will not enter immediately, watch out for market gap

BTCUSD HEAD $ SHOULDERS ??????Hello guys
It seems to made head and shoulders but in my opinion its not good head but market can do anything
i will take position with stop loss guys
take this position it can give us good profit
its risky position


BTC Reversal Or Death!COINBASE:BTCUSD
BTC Scared the hell out of all of us last week but it looks like sunshine could be on the horizon.
Development of a rising triangle during recovery
4H volume looks like its dropping towards something large
1H volume looks like we have one more "Shoulder of an incomplete Inverse H/S pattern" dip until this larger 4H move
3 Consecutive higher Lows with RSI trending higher in tandem
A peak at the ZECUSD chart shows a quick move towards its 4H 50MA with a initial denial but still recovers higher then where we are now with the other alts and majors
Zcash could be an interesting leader during times like this as LTC and ETH have done in the past.
If BTC breaks the orange line and confirms a 4H + candle above the green, I'd say we are quickly returning to 8k in a hurry...

USDJPY 1D/1H - HOW TO PROFIT FROM TRADING PULLBACKSTRADING PULLBACK RULES
1 - Find Daily uptrend with HH's & HL's.
2 - Switch to the 1h Time Frame
and Wait for a Pullback
against the Uptrend.
3 - Place Fib between last swing
high and low levels,
prior to the pullback.
4 - Buy Anywhere Between 50% and 61.8% Fib.
5 - Place Stop Loss below Swing Low.
6- Take Profit at break above the
previous Swing High.

Reversal Head and ShouldersI expect growth of the price, if the bulls manage to break through the neck line.

ETHUSD 1D LONG or 1H BEARISH CONTINUATION1D ASCENDING TRIANGLE BULLISH BREAKOUT.
Wait for a Daily Candle Close above triangle.
1H PULLBACK TRENDLINE BEARISH CONTINUATION BREAKOUT.
Wait for a 1H Candle Close below Pullback Trend line.
Or wait for a Bearish Continuation Break-Hook-Go candle pattern.

BTC/USD OUTLOOK GRIM? LOWER MTFA ENGLISHNOVICE SPECULATION:
Well, BTC is migrating to the lower end of 8! Where will we go!
On this chart, you can see multiple opportunities for high volume trading, or entries for a long term short.
As this month closes, we may see a retrace to 9, but my personal opinion is we are going to continue to drop to 8.3 to <7.
As always, it is hard to analyze where we go since, generally speaking, we are always combatting whales and exchanges *one in the same usually* so watch out for the weekly and daily time frames.
LOGIC BEHIND SHORT:
-Paper trading, so I feel no pain or regret, thus can safely make speculative paper trades on such a chart.
-Bitcoin formed a double top on the 4H
-Normal bouncing around, as usual.
-Be careful out here...You could short and wake up to a 11k BTC.
TRADE AT YOUR OWN RISK
