XRP/USD H1 Educational Market Analysis – Support-Based XRP/USD H1 Educational Market Analysis – Support-Based Long Opportunity
🔍 Structure Overview:
• Support Zone: $3.21 – $3.23
This level has acted as a strong liquidity pool and base for past bullish moves. Price has tapped into it, showing signs of potential demand returning.
• Resistance Zone: $3.65 – $3.70
Acts as a key supply zone, where previous bullish attempts failed. Targeting this area after a rebound is technically sound if structure confirms.
⸻
🔄 Price Action Insights (H1):
• Price broke down through EMAs (20/50/100/200), confirming short-term bearish pressure.
• A rejection wick from support hints at possible absorption of selling pressure.
• If price forms a higher low structure above $3.25 and reclaims EMAs, a potential bullish reversal may unfold.
⸻
🧠 Educational Note:
• H1 charts are ideal for intraday strategies, and this structure provides a clear example of:
• Support-resistance dynamics
• The use of EMAs as trend confirmation tools
• Reversal vs. continuation setups
⸻
🎯 Intraday Bullish Scenario:
• If price holds above $3.21 and breaks above the $3.40 (EMA cluster), bulls may push toward the $3.55290 target.
• This level aligns with the mid-range of the resistance zone, offering scalp-to-swing potential.
⸻
🚫 Bearish Risk:
• Failure to hold $3.21 could lead to a deeper correction toward $3.10 or even $3.00.
• Confirmation of bearish continuation would be a lower high rejection from EMAs without reclaiming them.
⸻
📌 Summary:
On the H1 chart, XRP is at a critical support. Watch for a clean bounce and break above EMAs for a move toward $3.55. However, losing $3.21 could attract further downside. Use price action confirmation before entries.
1hourchart

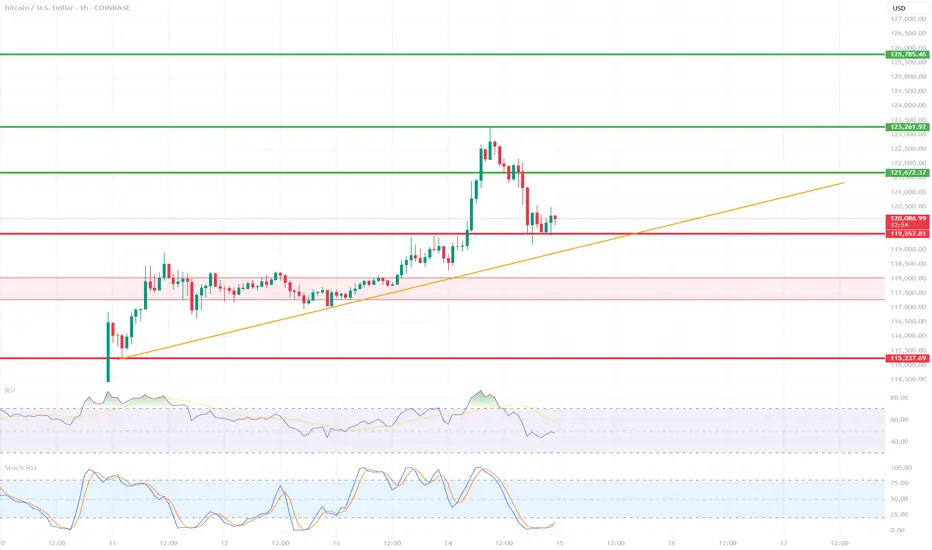
BTC/USD 1H ShortTerm🔍 Trend:
The short-term uptrend remains in effect, supported by the orange trendline.
The price has tested dynamic support but has not yet broken it.
🟥 Supports (Important Levels):
🔻 1. 119.550
Key support.
The price is currently testing it. Holding = potential upside rebound.
Breaking = greater downside risk.
🔻 2. 117.260–118.040 USD
Clear demand zone (reinforced by prior consolidation).
If the price breaks below current support, this is the next logical stopping point.
🔻 3. 115.237–115.500 USD
Strong weekly support – very important in the event of a stronger correction.
Historically, it has responded many times.
🟩 Resistance:
🔼 1. USD 121.673
The nearest local resistance – this could pose a problem for further growth.
🔼 2. USD 123.961
The last local high. Breaking it confirms the continuation of the uptrend.
🔼 3. USD 125.785
The next resistance – a potential target after a breakout to the upside.
📈 Technical Indicators:
RSI (classic):
Still below 50, but starting to reverse slightly upward – neutral with a slight potential for a rebound.
Stochastic RSI:
Gives a long signal – the lines have crossed in the oversold zone and are pointing upward.
📊 Scenarios:
🟢 Bullish:
Maintaining the current support zone (119.5–120k).
Breakout above 121.673 → target: 123.961.
Breakout of 123.961 = trend confirmation and target: 125.8k+
🔴 Bearish:
Break of the trend line and support at 119.550 → possible quick decline to 117.2k–118k.
If this doesn't hold, target: 115.2k
✅ Summary:
Decisive moment – tested trend line + support = rebound or breakout point.
The Stochastic RSI indicates a potential upside breakout, but the RSI needs confirmation.
Careful monitoring of volume and reaction to 120k in the coming hours.
BTC/USD 1H chart short-term🔻 Trend:
• Currently visible inheritance channel - confirmed by the yellow inheritance trend (decreasing peaks).
• The price tests resistance in the area 117.564 - possible to break out, but requires confirmation of the volume.
⸻
📊 levels of support and resistance:
• resistance:
• 117,564 (here we are now - resistance test)
• 117,939
• 118,206 (key level - potential breaking from the channel)
• Support:
• 117,205 - a recent hole, valid short -term
• 116,905
• 116,680 - deeper support, possible target with further decline
⸻
📉 Macd:
• The histogram begins to decrease, but the MacD line and the signal line still below zero → still weakness.
• Possibility to build a base for reversing the trend, but there is no clear signal intersection.
⸻
📉 RSI (Relative Strength Index):
• RSI below 50, but it starts to reflect slightly.
• MA RSI is still falling → no strong growth dynamics.
⸻
🔍 Applications:
• The downward trend still dominates, but the price is trying to pierce local resistance (117.564).
• If it breaks above 117,939–118,206 and persists, a possible change in the direction at a short interval.
• If he rejects the resistance - a quick descend to 117.205 or lower (116,900-116,680).
⸻
⚠️ Signals for observation:
• Closing the candle 1h above 118.206 - Bullly Breakout.
• Rejection of level 117.564 and descent below 117,200 - confirmation of further decline.
• MacD and RSI - 50 - potential change of direction.

Gold 1H Breakdown: Top Confirmed, Trend ReversedJust price, structure, and volume — tracked in real time.
🧠 Chart Breakdown:
✅ Trend Start / Structure Reclaim — Price regained key support and moving averages with momentum. Structure flipped bullish and trend began.
⛔ Top Exhaustion — Price reached new highs but began to stall. Volume dropped, and candles began curling — signaling a loss of momentum.
⚠️ Bounce Setup — After the pullback, buyers attempted to step back in — but structure never confirmed. No follow-through = no entry.
🚨 Breakdown Trigger — Sellers regained full control. Price broke below key levels with conviction. Volume confirmed the shift.
👀 Current Move — Price is pushing into new lows. Breakdown structure remains active until proven otherwise.
Always happy to be helpful.

Bullish Pennant in ARDR: A Pause Before Another RallyAfter an aggressive surge marked by a big green candle, BINANCE:ARDRUSDT is now moving sideways. This sideways action represents a "voting phase" between buyers and sellers — a battle to decide who will take control next.
Looking at the current price structure, this consolidation is setting up a potential continuation move toward the next target zone at 0.15199 – 0.15900.
Technically, the sideways movement is forming a bullish pennant pattern — a classic sign where price briefly pauses after a strong rally, gathering momentum before continuing its upward trend.
One thing to watch: after breaking the previous high (marked by the red arrow), price should not fall back into the pennant structure. A re-entry would weaken the bullish setup.
As long as price holds above the key support at 0.12273, the bullish scenario remains intact.
What's your view on this setup?

Why This Bearish Trend Is Actually a Bullish Opportunity?Understanding the Multi Timeframe Analysis – Part 2 of 2
Alright from the prior post we talked about how the corrective move on the 4H timeframe turns out to be a bearish trend on the 1H chart. Now, let’s dive deeper into that 1-hour chart.
In this 1H chart, we can observe a trend shift from bullish to bearish.
Before the red arrow, we can clearly see a bullish structure:
Blue arrows continue to form higher lows, and
Orange arrows form higher highs (except one minor failure, which still maintains the bullish structure because price doesn’t break the previous low).
But everything changes after the red arrow:
Orange arrows fail to create new highs,
Blue arrows start forming lower lows,
→ confirming a bearish reversal on the 1H timeframe.
So… How Can We Use This Bearish Trend as a Bullish Opportunity?
Here's where it gets interesting — instead of seeing the bearish trend as a threat, we use it for better entry with an improved risk-reward ratio.
But here’s the catch – some conditions must be met:
Make sure the bigger timeframe (4H) still supports a bullish trend.
Wait for price to drop lower than the last blue arrow (prior low).
Look for bullish divergence + candlestick confirmation before entering.
Once you get the signal, you can place your stop loss below the confirmation candle to limit your risk.
What If Price Breaks the Orange Arrow (Prior High)?
If price invalidates the bearish structure by breaking the previous high, that means:
The 1H bearish trend is over.
The pullback on 4H timeframe is done.
And price is likely resuming the main bullish trend.
So, whether price goes lower or higher — you’re ready either way.
Alright, that’s my take on using multiple timeframes—hope it helps clear up any confusion you had! Let me know your thoughts in the comments. See you in the next post!

EUR/USD: Bullish Falling Wedge Breakout Towards TargetLet’s analyze the 1-hour candlestick chart of EUR/USD (Euro / U.S. Dollar) on TradingView, published by GoldMasterTraders on April 2, 2025, at 19:04 UTC. The chart highlights a trading setup based on a Falling Wedge pattern, indicating a potential bullish breakout. I’ll describe the chart pattern and the trading setup in detail.
Chart Pattern: Falling Wedge
Pattern Description
Type: The chart identifies a Falling Wedge pattern, which is a bullish chart pattern that typically signals a reversal or continuation of an uptrend. A Falling Wedge forms when the price consolidates between two downward-sloping trendlines that converge over time, with the upper trendline (resistance) sloping more steeply than the lower trendline (support).
Appearance on the Chart:
The Falling Wedge is clearly marked with two converging trendlines:
Upper Trendline (Resistance): Connects the lower highs, sloping downward.
Lower Trendline (Support): Connects the lower lows, also sloping downward but at a less steep angle.
The pattern began forming around March 19, after a sharp decline from 1.9400 to 1.8700, and continued until the breakout on April 2, 2025.
Breakout Direction:
Falling Wedges are typically bullish, meaning the price is expected to break out to the upside. The chart shows the price breaking above the upper trendline of the wedge around April 2, 2025, with a strong bullish candle, confirming the breakout.
The breakout level is around 1.90840, and the price has moved slightly above this level, closing at 1.90864 at the time of the chart.
Key Levels and Trading Setup
1. Support Level
A horizontal support zone is marked around 1.90730 (approximately 1.9070–1.9080).
This level acted as a base during the wedge formation, with the price bouncing off this zone multiple times (e.g., on March 23 and March 30).
The support level aligns with the lower boundary of the wedge, reinforcing its significance as a key area of buying interest.
2. Resistance Level
A resistance zone is marked around 1.92000 (approximately 1.9190–1.9210).
This level corresponds to a previous high reached on March 19, before the wedge formation began. It represents a significant barrier where selling pressure previously emerged.
After the breakout, the price is expected to test this resistance as part of the bullish move.
3. Target
The target for the breakout is projected at 1.92110.
This target is likely calculated by measuring the height of the wedge at its widest point (from the highest high to the lowest low within the pattern) and projecting that distance upward from the breakout point.
The chart indicates a potential move of 0.00435 (0.40%), which aligns with the distance from the breakout level (around 1.90840) to the target (1.92110).
4. Stop Loss
A stop loss is suggested below the support level at 1.90730.
This placement ensures that if the breakout fails and the price falls back into the wedge, the trade is exited with a manageable loss.
The stop loss is just below the breakout level (1.90840), with a distance of approximately 0.00110, representing the risk on the trade.
Trading Setup Summary
Entry:
The setup suggests entering a long (buy) position after the price breaks out above the upper trendline of the Falling Wedge, which occurred around April 2, 2025. The breakout is confirmed by a strong bullish candle closing above the trendline at approximately 1.90840.
Stop Loss:
Place a stop loss below the support level at 1.90730 to protect against a false breakout or reversal. The distance from the breakout level (1.90840) to the stop loss (1.90730) is 0.00110, or about 0.06% of the entry price.
Take Profit/Target:
Aim for the target at 1.92110, which is near the next significant resistance level. The distance from the breakout level to the target is 0.01270, or a 0.40% move.
Risk-Reward Ratio:
The risk is 0.00110 (from 1.90840 to 1.90730), and the reward is 0.01270 (from 1.90840 to 1.92110), giving a risk-reward ratio of approximately 11.55:1 (0.01270 / 0.00110). This is an exceptionally high risk-reward ratio, making the setup very attractive, though traders should ensure the breakout is well-confirmed due to the tight stop loss.
Additional Observations
Price Action Context:
Before the wedge formed, the price experienced a sharp decline from 1.9400 (March 13) to 1.8700 (March 19), indicating a strong bearish trend.
The Falling Wedge represents a consolidation phase within this downtrend, and the upside breakout suggests a potential reversal or at least a corrective move higher.
Volume and Momentum:
The chart doesn’t display volume or momentum indicators (e.g., RSI, MACD). However, a typical confirmation of a Falling Wedge breakout would include:
An increase in volume on the breakout candle, indicating strong buying interest.
Bullish momentum signals, such as an RSI above 50 or a bullish MACD crossover.
Traders might want to check these indicators for additional confirmation of the breakout’s strength.
Timeframe:
This is a 1-hour chart, so the setup is intended for short-term trading, with the target potentially being reached within a few hours to a day.
Market Context:
EUR/USD is influenced by factors like U.S. dollar strength, Eurozone economic data, and interest rate differentials. A bullish move in EUR/USD could be driven by a weaker dollar (e.g., due to dovish U.S. economic data) or positive Eurozone developments.
Conclusion
The TradingView idea presents a bullish setup for EUR/USD based on a Falling Wedge pattern on the 1-hour chart. The price has broken above the wedge’s upper trendline, confirming a bullish move with a target of 1.92110. The setup includes a stop loss at 1.90730 to manage risk, offering an impressive risk-reward ratio of 11.55:1. Key levels to watch include the support at 1.90730 and the resistance at 1.92000. Traders should consider additional confirmation from volume and momentum indicators, as well as broader market conditions, before executing the trade. Since this chart is from April 2, 2025, market conditions may have evolved, and I can assist with searching for more recent data if needed!

BTC/USDT 1h chart reviewHello everyone, let's look at the 1H BTC chart to USDT, in this situation we can see how the price moves in the downward trend, the reflection from the downward trend line was currently visible. However, let's start by defining goals for the near future the price must face:
T1 = 94661 $
T2 = 95162 $
Т3 = 95521 $
T4 = 95969 $
T5 = 97241 $
Let's go to Stop-Loss now in case of further declines on the market:
SL1 = 93804 $
SL2 = 93279 $
SL3 = 92421 $
Looking at the RSI indicator, we see
How we stay below the lower range of the range, which may potentially indicate the end of the current relaxation.

Btc 1 Hour Bullish Btc 1 Hour Bullish Making Bullish Flag Pattern and Continuous Upward trend
Entry Stop Loss And Tp are mentioned. Trade According to your portfolio Size.
Happy Trading

price seems bearishly diverged rejected from $1whether its psychological resistance, ovextention of distribution or availability, or volatility from profit taking, the rejection at #1 has led to a sizeable pullback on the 1 hr chart. if we dont break through this high bulls will look to confirm a higher daily low and try again at $1.
i think its clear this stock will remain under $1, even if it goes to $2 over enough time.

BNB/USDT 1H ChartHello everyone, let's look at the 1H BNB to USDT chart, in this situation we can see how the price is moving below the uptrend line and was struggling to maintain the level.
Let's start by setting goals for the near future, which include:
T1-$554
T2-$562
T3-$583
Now let's move on to the stop-loss in case the market continues to decline:
SL1 = $544
SL2 = $537
SL3 = $527
SL4 = $509
Looking at the RSI indicator, we see that we are above the upper line of the range, which may contribute to an attempt at a price recovery.

GBPUSD Medium cycleGBPUSD is in a bullish channel.
its have 2 hunts to this channel lines.
i think normal time for third hunt is at next 22 bars in 1.29840 price.
now if its hunt sooner its show that the power of bearish trend increasing.
and if its hunt later show that the bullish trend power is increasing.
why do i thinks so ? because i compare that whit its last hunt.
also the DXY had strong bearish trend and its resting now.
i think the bearish trend can continuo.
Its just my personal comment please don't trade whit this.
I have no responsibility for your money.

Is ABTUSD already triggering c&h w/a handle only on small TFs?ABTUSD just recently hit the full target of its linear chart’s recent bull flag breakout and in the process filled out this beautifully sculpted cup that I thought would take several daily candles to complete a handle of before continuing to move upward….to my surprise price decided to only let the handle develop on the 30minute-2hr chart before breaking above the neckline. So it is currently now most valid on the 35-45 minute chart…making it far more likely the pattern can be nullified on such a small tie frame, however as of right now it is well on the way to the full c&h breakout target…a few dives back below the neckline especially on such a small time frame are quite possible too before it musters up the strength to hit the full target. If it does hit that target it is well on the way of finally hitting my much higher target of the Log charts bullflag breakout which I will link that idea below. Keep in mind because it is the log chart its measured move target from breaking up from the flag is considerably higher than the one that was on the linear chart. *not financial advice*

HelenP. I Bitcoin can fall a little and then bounce up to $64000Hi folks today I'm prepared for you Bitcoin analytics. A not long time ago price rebounded from the trend line and made impulse up to the support level, which coincided with the support zone and soon broke this level. After this, BTC continued to move up to the resistance level and even entered to resistance zone, but soon turned around and fell below the 64000 level. Some time later Bitcoin broke this level again and rose even higher resistance zone, but then it started to decline and fell almost to the support level, breaking the resistance level one more time. Next, BTC rebounded and tried to rise to the resistance level, but failed and declined to the 60100 support level again. After this movement, price started to rise near the trend line and even later BTC rebounded up, but recently declined back to this line. So, just now, the price continues to trades near the trend line and I expect that Bitcoin will decline a little lower than the trend line and then rebound up to the resistance level. For this case, I set my target at the 64000 level. If you like my analytics you may support me with your like/comment ❤️

BTC 1 Hour AnalysisFollowing the 1 hour chart, the consolidation is coming to a point where it might break past the support line its been hanging on or keep going. Watched this before publishing and its been sticking right with the trend lines.

BTC Short-Term Chart 1HSupports and resistances for BTC in pair with USDT taking into account the time frame of one hour. As you can see, the price returned above the local upward trend line.
After unfolding the Fib Retracement grid, it can be seen that the price is struggling to maintain the resistance at $43,872, and still needs to overcome the strong resistance zone from $44,762 to $45,875.
Looking the other way, you can see support at $42,927, then at $42,050, and then the support zone from $41,421 to $40,620.
Looking at the RSI indicator, we can see a dynamic increase with room for further movement, while the STOCH indicator is reflecting from the upper limit, which may result in a price recovery.

Nearby supports and resistances for BTCNearby supports and resistances for BTC. As you can see, the price remains above the local upward trend line.
After unfolding the trend based fib extension grid, you can see the support zone from $42,370 to $42,228, and then we have support at the level of 41,821.
Looking the other way, we see resistance at $42,706, while further we have a strong resistance zone from $43,080 to $43,281.
We have exceeded the upper limit on the RSI, but looking at the STOCH indicator we can see a greater price recovery.

ETH 1HInterval Chart Short-TermHello everyone, let's take a look at the ETH to USDT chart on a one hour time frame. As you can see, the price came out at the top of the indicated triangle.
When we unfold the Trend Based Fib Extension grid, we can determine the support level at $1948, and then we have a support zone from $1928 to $1913.
Looking the other way, we see that the price is approaching the resistance zone from $1984 to $1995, and then must overcome the resistance at $2010 before further increases.
Looking at the CHOP indicator, we see that there is energy to continue the movement, the RSI indicator, despite the increase, has room for the price to go further, while the STOCH indicator has exceeded the upper limit, which may result in a correction in the coming hours.

BTC 1HInterval Short-TermHello everyone, I invite you to check the current situation on BTC in the USDT pair, taking into account the one-hour interval. First, we will use the blue lines to mark the local channel of the upward trend, in which the price tried to break out at the bottom, but quickly returned to the ongoing channel.
Going further, we will use the Fib Retracement tool, and here we can see that the price decline was maintained by a strong support zone from $34923 to $34090, but now that the price has quickly rebounded, we should keep in mind the support at $36096, where the price can currently resist.
Looking the other way, we will similarly check the current resistance points that BTC will have to face again in further increases. And here you can see that the first significant resistance should appear at the level of $36,777, and then the price will be able to move towards a strong resistance zone from the level of $37,326 to the level of $38,026.
When we turn on the EMA Cross 10 and 30 indicator, we can see that the red ema corss 10 line is approaching the intersection of the green ema cross 30 line from below, which will potentially confirm the return to the local uptrend.
Please pay attention to the CHOP index, which indicates that there is still some energy left for movement, the RSI indicator shows a dynamic increase with room for the price to go higher, but the STOCH index exceeded the upper limit, which may result in a local price recovery.

BTC/USDT 1HInterval reviewHello everyone, let's look at the BTC to USDT chart taking into account the timeframe of 1 hour. First, we will mark the local downtrend line under which the price is moving.
We will use the fib retracement tool to plot support and we see a support zone from $28996 to $28956, then there is a second zone from $28914 to $28854 and then strong support at $28779.
Now let's go from the resistance line, as you can see the first resistance is the zone from $29031 to $29108, if you manage to break it further we have the second zone from $29187 to $29296 and then strong resistance at $29438.
Looking at the CHOP indicator, we see that there is still energy for the current move, the RSI is at the lower limit, which in combination with the STOCH indicator on which we crossed the lower limit can give a local price increase..

ETH/USDT 1HInterval Review ChartHello everyone, I invite you to review the ETH chart on an hourly interval. First, we will mark with yellow lines a local triangle in which the price is at the upper limit for the third time. In this arrangement, we can see an exemplary price movement in which the fourth time we will see an upward exit from the triangle.
After unfolding the fib retracement tool, we can mark a strong support zone above which the price is currently holding, however, when we fall below this zone, we can see a drop around the next support at $ 1808.
Looking the other way, we can similarly determine the places of resistance that the price has to face. And here we see that the price has to break through the support zone from $1844 to $1852 first, then it can move towards the resistance at $1864 and then continue to the resistance at $1879.
The CHOP index indicates that there is a lot of energy to be used, on the RSI we can see that a small increase in price gives a large increase on the indicator, which creates room for another decrease. The STOCH indicator is also approaching the upper limit, which may affect the trend reversal and the transition to a downward trend.

BTCUSDT 1H Chart ReviewHello everyone, I invite you to review the chart of BTC in pair USDT taking into account the time interval of one hour. First, we will use the blue lines to mark the local downtrend channel that btc lagged upwards, and entered the uptrend channel from which the exit was down. What's more, the exit from the first channel was close to the high of the channel, if the exit from the current channel behaves similarly, we can see a correction around $28,000.
Now we can move on to marking the places of support in the event of a correction. And here, in the first place, it is worth marking the support zone where the price is currently from $ 29,485 to $ 28,733, but when we fall below this zone, we can see a drop around the previously mentioned place of $ 27,996, and the next support is at $ 26,928.
Looking the other way, in a similar way, using the trend based fib extension tool, we can determine the places of resistance. First, the price has to break the resistance at $30,644, then we have a second resistance at $31,487, and then a third very strong resistance at $32,344.
The CHOP index indicates that there is little energy for the next move, the RSI rebounded from the upper edge and there is still room for the price to go lower, but on the STOCH indicator we see that the energy is running out at the moment, which may give a temporary sideways trend.

nas100 30min demand zone reationnas100 30min demand zone reaction
demand zone reaction 1hr, 15min
possible inverted head and shoulder pattern on 5min chart
nas100 seems to be in an uptrend today and can close higher
