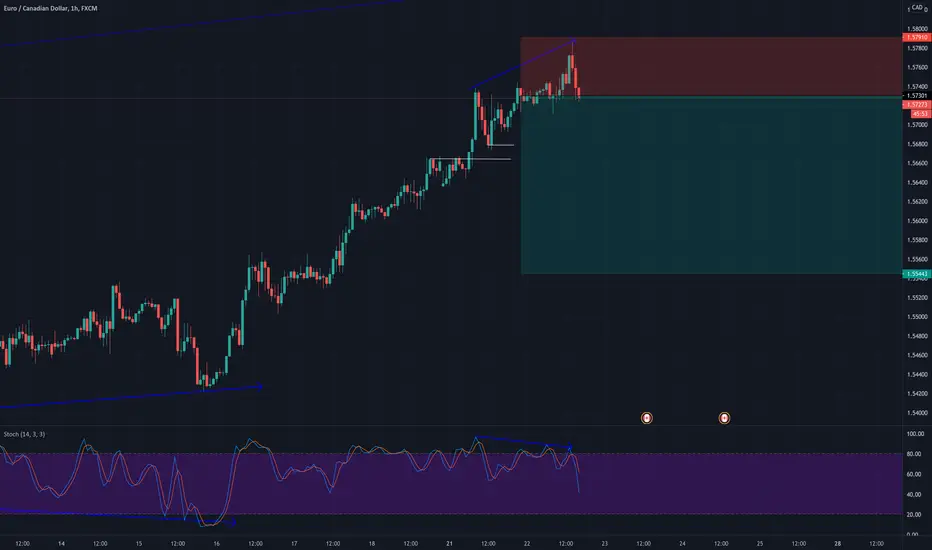
EUR/USD Tehnical Analysis for Today Will be Updated Stay TunedPurple Line = Daily SNR /Trendline
Red Line = 4 Hour SNR /Trendline
Orange = 1 Hour SNR /Trendline
Will be Updated During the Day Stay Tuned
If this help you with your trading Please Like, Share and Follow that give me motivation to make another Trading Ideas
If you have some suggestion, comment or other opinion feel free to write it in comment
Wish you succesfull and consistent trading with profits!
This is not an investment advice.
"CFDs are complex instruments and come with a high risk of losing money rapidly due to leverage. Between 74-89% of retail investor accounts lose money when trading CFDs. You should consider whether you understand how CFDs work and whether you can afford to take the high risk of losing your money."
1hourchart

USD/JPY Multi Time Frame Analysis - Possible UptrendPurple Line = 4 Hour SNR
Red Line = 1 Hour SNR
Yellow = 5 Minute SNR
4 Hour candle close above 4 Hour support level and on 5 Minute chart we can see clear triangle which is break in uptrend and now if we see pullback price should go high at least till new 4 Hour Trendline Resistance
If this help you with your trading Please Like, Share and Follow that give me motivation to make another Trading Ideas
If you have some suggestion, comment or other opinion feel free to write it in comment
Wish you succesfull and consistent trading with profits!
This is not an investment advice.
"CFDs are complex instruments and come with a high risk of losing money rapidly due to leverage. Between 74-89% of retail investor accounts lose money when trading CFDs. You should consider whether you understand how CFDs work and whether you can afford to take the high risk of losing your money."

EUR/USD multi time frame analysis, Trading Idea #3Purple Zones = Daily SNR
Red Zones = 4 H SNR
Orange Zones = 1 H SNR
Yellow Zones = 5 Min SNR
Blue Lines = Opportunity for trade
1.) SHORT TRADE REVERSAL
When Candle close bellow Resistance and next candle form as Bearish ( better if it is some Bearish reversal candlesticks like bearish engulfing candle or bearish evening star etc....) open short trade;
- Stop Loss above resistance zone
- Take profit little bit above next support (or if see that candlestick break next support (new Bearish candlestick open bellow next support zone ) keep open trade to get more profit)
- Check Economic calender to be sure that avoid trade on double (15 Min before and after news) and tripple news (30 Min before and after news), and also speak with double and tripple star (2 H before and after speeach) =Check www.forexfactory.com
2.) SHORT TRADE CONTINUATION
When Bearish Candle close bellow support zone place Short trade (better if is some strong bearish candle) Open short trade
- Stop Loss above resistance zone
- Take profit little bit above next support (or if see that candlestick break next support (new Bearish candlestick open bellow next support zone ) keep open trade to get more profit)
- Check Economic calender to be sure that avoid trade on double (15 Min before and after news) and tripple news (30 Min before and after news), and also speak with double and tripple star (2 H before and after speeach) =Check www.forexfactory.com
3.) LONG TRADE REVERSAL
When Candle close Above Support and next candle form as Bullish ( better if it is some Bullish reversal candlesticks like Bullish engulfing candle or Bullish Morning star etc....) open Long trade;
- Stop Loss Bellow Support zone
- Take profit little bit Bellow next Resistance (or if see that candlestick break next Resistance (new Bullish candlestick open above next Resistance zone ) keep open trade to get more profit)
- Check Economic calender to be sure that avoid trade on double (15 Min before and after news) and tripple news (30 Min before and after news), and also speak with double and tripple star (2 H before and after speeach) =Check www.forexfactory.com
4.) LONG TRADE CONTINUATION
When Bullish Candle close above Resistance zone place Long trade (better if is some strong Bullish candle) Open Long trade
- Stop Loss Bellow Support zone
- Take profit little bit Bellow next Resistance (or if see that candlestick break next Resistance (new Bullish candlestick open Above next Resistance zone ) keep open trade to get more profit)
- Check Economic calender to be sure that avoid trade on double (15 Min before and after news) and tripple news (30 Min before and after news), and also speak with double and tripple star (2 H before and after speeach) =Check www.forexfactory.com
If this help you with your trading Please Like, Share and Follow that give me motivation to make another Trading Ideas
If you have some suggestion, comment or other opinion feel free to write it in comment
Wish you succesfull and consistent trading with profits!

NZD/USD multi time frame analysis, Trading Idea #2Purple Zones = Daily SNR
Red Zones = 4 H SNR
Orange Zones = 1 H SNR
Yellow Zones = 5 Min SNR
Blue Lines = Opportunity for trade
1.) SHORT TRADE REVERSAL
When Candle close bellow Resistance and next candle form as Bearish( better if it is some Bearish reversal candlesticks like bearish engulfing candle or bearish evening star etc....) open short trade;
- Stop Loss above resistance zone
- Take profit little bit above next support (or if see that candlestick break next support (new Bearish candlestick open bellow next support zone) keep open trade to get more profit)
- Check Economic calender to be sure that avoid trade on double (15 Min before and after news) and tripple news (30 Min before and after news), and also speak with double and tripple star (2 H before and after speeach) =Check www.forexfactory.com
2.) SHORT TRADE CONTINUATION
When Bearish Candle close bellow support zone place Short trade (better if is some strong bearish candle) Open short trade
- Stop Loss above resistance zone
- Take profit little bit above next support (or if see that candlestick break next support (new Bearish candlestick open bellow next support zone) keep open trade to get more profit)
- Check Economic calender to be sure that avoid trade on double (15 Min before and after news) and tripple news (30 Min before and after news), and also speak with double and tripple star (2 H before and after speeach) =Check www.forexfactory.com
3.) LONG TRADE REVERSAL
When Candle close Above Support and next candle form as Bullish( better if it is some Bullish reversal candlesticks like Bullish engulfing candle or Bullish Morning star etc....) open Long trade;
- Stop Loss Bellow Support zone
- Take profit little bit Bellow next Resistance (or if see that candlestick break next Resistance (new Bullish candlestick open above next Resistance zone) keep open trade to get more profit)
- Check Economic calender to be sure that avoid trade on double (15 Min before and after news) and tripple news (30 Min before and after news), and also speak with double and tripple star (2 H before and after speeach) =Check www.forexfactory.com
4.) LONG TRADE CONTINUATION
When Bullish Candle close above Resistance zone place Long trade (better if is some strong Bullish candle) Open Long trade
- Stop Loss Bellow Support zone
- Take profit little bit Bellow next Resistance (or if see that candlestick break next Resistance (new Bullish candlestick open Above next Resistance zone) keep open trade to get more profit)
- Check Economic calender to be sure that avoid trade on double (15 Min before and after news) and tripple news (30 Min before and after news), and also speak with double and tripple star (2 H before and after speeach) =Check www.forexfactory.com
If this help you with your trading Please Like, Share and Follow that give me motivation to make another Trading Ideas
If you have some suggestion, comment or other opinion feel free to write it in comment
Wish you succesfull and consistent trading with profits!

BPCLBpcl approaching towards the gap .
Buy opportunity can be seen at the levels marked .
For swing trade .
Opportunity yet to be formed .
Keep track of it

BTC BULL FLAG PATTERNWe can see easy Bull flag pattern on 1 hour chart, We need reclaim 200 MA, to go higher, but it's very strong.
patient pay ;)

BNBUSDT Trading in strong Support ZoneHi Friends, BNB/USDT is currently trading on big support zone, possible targets with yellow.
¡Trade Safe!
Regards and Love.
Engineer Alexa.

Long position Trade Idea (Day trading)Using trendlines here, we can spot an opportunity in the day tradin'. The channel is bullish, marked entries all sitting on support


Possible C&H on XRPUSDT 1H chartThis is my prediction for XRP. The cup and handle is so far looking pretty good, so keep your eyes peeled for this one. I already missed the breakout leading up to this point so hope i get some gains from this. Not a financial advisor, beginner at this. Comment your thoughts on this below.

BTCUSDT Inverted Head and ShouldersHi everyone. This is BTCUSDT 1h chart which is indicating a beautiful head and shoulders pattern with a nice Goodbye kiss! I think it's time for a long with 57k target.
*Not financial advice


#btc.d #btcdominance #1HHi guys..its the latest analyze chart of bitcoin dominance in 1H timeframe .if you are interested any crypto that you want analyze with me and any questions please do not hesitate and comment below the chart!
if u like it press like-comment and folow me.thx

Litecoin (LTCUSD) support and resistance zonesLitecoin is now in neutral zone. We have to wait for support zone and build a long position.
check my proffile

Ethereum in a Symmetrical Triangle. Expect Break Up in 12 HoursEthereum in a Symmetrical Triangle. Expect Break Up in 12 Hours.
Historically symmetrical triangles break with the prevailing trend, which in this case is bullish.

SHORT Don't really trade the Christmas break, but this year with the lockdown has got me stuck at home looking to take this cheeky short.
Breaking Resistance On The 1 HRVerizon is about to break through resistance on the 1 hour chart and has potential to reach an all time high. I will be following this stock closely as I have 50 calls for it to be worth $61 a share by 12/11. I need it to hit $62 a share this week to 5x my money. Looking to make big profit but as soon as I see a reason to drop out I will. Stay tuned for more!

EURUSD lots of pips toward the weekly resistanceEURUSD might go down towards the big weekly resistance once the price reach the upper 1h and daily dinamic resistance. I'm waiting for some kind of reaction around 1.7777. Also notice how the RSI is reaching the overbought area. This might be the start of a nice weekly downtrend.

S&P500 Potential Supply Area 1 Hour Chart 28 Sep 2028 September 2020
Fresh Potential
Supply Level
If Price Pulls
Back. S&P 500
1 Hour Chart OANDA:SPX500USD


GBPUSD ANALYSIS UPDATEFOREXCOM:GBPUSD
Hello guys, If you have any question, drop it below in the comment section. Remember to always react to the market.

GBPJPY ANALYSIS UPDATEFOREXCOM:GBPJPY
Hello Traders, drop a comment below to ask questions or make suggestions. Remember that market is reactive and not predictive.

EURJPY ANALYSIS NOTE: (MARKET IS REACTIVE AND NOTE PREDICTIVE)
(LIKE AND COMMENT BELOW TO SHARE IDEAS TO SUPPORT )
From a daily perspective we can see price has been in a bullish market.
REMEMBER: MARKET IS REACTIVE AND NOT PREDICTIVE.
On the four hour chart if price can push through the resistance zone we can initiate a long position to the level of 118.559 zone.
Monitor this pair from a 4Hour perspective for entries.
If you have any suggestion, drop in the comment section below. FOREXCOM:EURJPY
