1inch break out !!1inch break out !!
now its bullish and will up soon
good to buy a bag
good luck
my chanell id : @ut_arzedigital
1inch

1INCHUSDTHello to you all. Mars Signals team wishes you high profits at all times.
The price has been able to break its resistance line and is fluctuating. We have drawn a channel line for you that can move from any side of the price. We have identified the area of support and resistance for you.
Warning: This is just a suggestion to you and we do not guarantee profits.
Wish you luck!

1INCH - Broke downtrend1INCH broke out of the downtrend channel right now but all platforms show a Sell situation,
Also the upper Bollinger is holding the price down which shows that we might have a small correction.
There are supports and resistance areas shown on chart, but personally I think we're going to see the price go down for now.
So for a safe strategy: Don't buy for now. Either hold or long when the price hit any of the support areas.
Current Market Price: $3.1180
Good Luck
Tell me your ideas. Like and Share


1INCH - 6h. Be careful around the range of $3.6-3.75 The loss of the critical liquid range of $3.6-3.75 had a very negative impact on the 1INCH market participants. After a powerful wave of decline, which began on May 9, sellers managed to lower the price of 1inchusdt by 76%. The main trading volumes were recorded on May 19, when sellers began to break through the liquid price zone of $3.6-3.75.
After unsuccessful attempts of buyers to regain control of this range, the price of 1inchusd continued its decline, however, at lower volumes . The decrease in investor interest below the range of $3.6-3.75 is clearly visible on the daily timeframe:
As you can see, a systematic decrease in trading volumes even during local growth speaks of the fear of market participants and a reluctance to take risks in such a situation. Therefore, at the moment , a positive scenario for buyers will be a test of the range of $3.6-3.75.
A new wave of decline will most likely start from this range. From how strong it will be, it will be clear how likely the scenario of the completion of the correction and the beginning of a new wave of growth is.
For a positive scenario, buyers need to keep the range of $2.45-2.6. Otherwise, we will see an update of the local low.
________________________________
We create both short-term ideas (for a local understanding of the market situation) and medium-term forecasts of price movements.
Subscribe to us and get daily concise analytics!


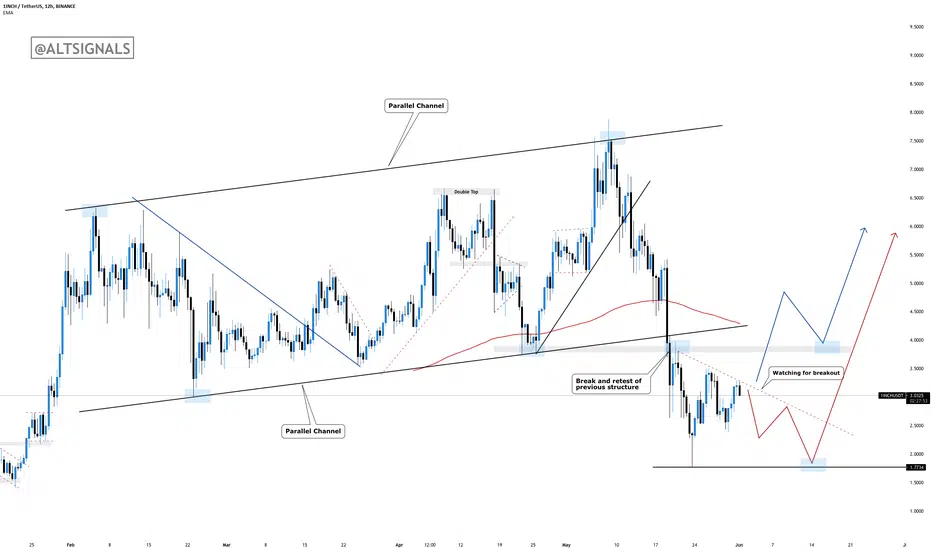
1INCH - Breakout Soon!Similarly to every other crypto pair, 1INCH recently underwent a massive drop and cancelled out all the gains it made this year. We could be setting up for another surge very soon if we break the 100EMA and the previous structure indicated in the chart. The price to watch is the $3.80 level which is our structure point.
The other level we are watching is the recent bottom at $1.77. If we move correctively back down to that level, it could act as a spring to take us back up to all time highs!


1INCH/BUSD BINANCE1INCH/BUSD BINANCE
4H hollow candlesticks.
Price breakout at the end of the yellow asymmetric triangle as happened before.
MACD extremely bullish.
Volume rising.
1inch Price (1INCH) = $3.18 +18.75%
0.00008587 BTC +13.22%
0.001218 ETH +7.35%
Good Luck
CryptoHellas Team

#1inch Update#1inch
Price to retest important trendline.
Broken on 21-May, the trendline which acted like support is now flipped into resistance.
If it gets rejected we might see the price retesting the short-term support (white dotted line).
Eyes on $ETH & $BTC evolutions as well.

1INCH - Strong Sell!1INCH is still fighting the downtrend channel... and all platforms sign it as a "strong sell". The sell volume is high and it's super risky for now.
So what scenarios are there?
If the price manages to breakout the downtrend channel (Dynamic resistance), after a 4H closure outside the channel, we can consider it as a bullish sign.
But if the price keeps getting rejected by the channel, then the support areas for "short" traders are shown on the chart.
Good Luck
Tell me your ideas. Like and Share


🆓1inch (1INCH) May-23 #1INCH $1INCH1INCH is decreasing sharply and 2$ zone is an important support zone now. If it could stop the decline at this zone, it will have a big chance to recover up to 2.5$, 3$ and 4$ in the next few days
📈BUY
-Buy: 1.9-2.1$ if A. SL if B
📉SELL
-Sell: 2.4-2.6$. SL if A
-Sell: 2.9-3.1$. SL if A
-Sell: 3.9-4.1$. SL if A
♻️BACK-UP
-Sell: 1.9-2.1$ if B. SL if A
-Buy: 1.45-1.55$. SL if B
❓Details
🕯Timeframe : 1 Day
📈Red Arrow : Main Direction as BUY and SELL section
📉Blue Arrow : Back-Up Direction as BACK-UP section
🟩Green zone : Support zone as BUY section
🟥Red zone : Resistance zone as SELL section
🅰️A : The Close price of candlestick is Above the zone
🅱️B : The Close price of candlestick is Below the zone


1INCH formed another bullish Shark for upto 166% big rallyHi, dear friends, hope you are well, and welcome to the new update on the 1inch token.
The previous Gartley pattern of 1inch token produced more than 65% profit.
Now this time on the weekly time frame chart, the price action of 1inch has formed a harmonic bullish Shark pattern.
Buying and sell targets for Shark move:
Buy between: $3.41 to $2.52
Sell between: $4.56 to $6.72
Stop loss:
The maximum extent of the potential reversal zone to $2.52 can be used as stop loss.
Possible profit and loss ratio:
As per the above targets, this trade has a profit possibility of 166%, and a high loss possibility up to 27%.
Note: Above idea is for educational purpose only. It is advised to diversify and strictly follow the stop loss, and don't get stuck with trade.


How many inches can 1INCH go from here? 🤩Yep… 1INCH is breaking out from its EMA vs USD and also vs BTC ready for new ATH. And with ETH new ATH in the cards, things look promising for ERC20 Alts in general.
Do you agree? If so, what is the new ATH against BTC that you see? Feel free to share how did you reach that conclusion.

1INCHUSDT Good Entry!1INCHUSDTUSDT(4H CHART) Technical Analysis Update
Falling Wedge
1INCH/USDT currently trading at $5.20
Buy-level: $5.00- $5.20
Stop loss: Below $4.40
Target 1: $5.60
Target 2: $5.90
Target 3: $6.00
Target 4: $6.50
Max Leverage: 2X
ALWAYS KEEP STOP LOSS...
Follow Our Tradingview Account for More Technical Analysis Updates, | Like, Share and Comment Your thoughts.

