PEPE – Highest Weekly Close in 6 Months: Eyes on New HighsMajor Breakout Level:
Last week’s candle closed above the 1W S/R (~0.000013845), marking the highest weekly close in half a year.
Bullish Structure:
Price reclaimed and closed above a crucial weekly resistance. This flips the structure bullish, increasing odds of continuation.
Next Targets:
Immediate resistance lies near the 1M S/R (around 0.000020193–0.000020272). Break and close above opens way toward the 1.27–1.618 Fib extensions (0.000029793+).
Invalidation:
Failure to hold above the 1W S/R and a weekly close back below (~0.000013845) would invalidate the breakout, putting risk back toward mid-range support (0.000009697).
The weekly close above key resistance signals strong buyer interest and market acceptance of higher prices, especially after a multi-month consolidation. This “highest close in 6 months” is a classic trend continuation setup. The next natural target is the higher time frame resistance (1M S/R), with Fibs aligning to previous price action. Failure to hold the breakout level would suggest a failed move and likely mean-reversion.
1w

ETH — Perfect Long Play: Pullback & 1W Breaker Reclaim
After the strong move, price is likely to retrace as longs get trapped and late buyers take profit.
Best scenario: ETH pulls back to the 1W breaker zone ($3,141–$3,456), which previously acted as resistance and could now flip into support.
Watch for bullish reaction and confirmation in the 1W breaker zone.
If support holds, enter long — targeting a return to the range high and then the liquidity zone ($4,108+).
Invalidation if ETH closes below the 1W breaker or loses range low ($2,876) support.
ETH has rallied hard. After such a move, it’s normal for price to pull back and test old resistance as new support. The ideal long is on confirmation of a bounce from the 1W breaker zone, which keeps risk controlled and sets up for a continuation move higher. This approach avoids FOMO and protects against reversal if the breakout fails.

BTC Volatility at Lows: Next Expansion Will Reshape the CycleBTC Volatility Index is at a major support zone, where past cycle lows led to massive trend reversals and strong price expansions.
Every time BTC volatility reached this level (highlighted boxes), it was followed by a sharp move upward in both volatility and BTC price.
Currently, ETH and altcoins are leading, showing strong performance in the “catch-up” phase, but this typically precedes the main BTC-led move.
Next expected phase: A volatility spike (potentially in Q4) that sends BTC into a parabolic uptrend.
During this phase, alt/BTC pairs usually drop sharply (“nuke”) as capital rotates back to BTC.
After BTC’s explosive move, a true altseason begins as capital rotates back into alts.
Key signal: Watch for an expansion in BTC volatility from these historic lows as the “real fun” starts.
BTC volatility is at cycle lows, a zone that historically triggers major directional moves. Previous bounces from this area have coincided with powerful market expansions, first led by BTC, then followed by altcoins. While ETH and alts are currently showing strength, history suggests the cycle’s final stage begins with a BTC volatility spike—pushing BTC up rapidly, causing alt/BTC pairs to drop, and only then ushering in a real altseason. The next volatility expansion (likely Q4) could mark this transition.

APTOS Weekly Bottom Formation — Early Signs of Reversal
APT has retested and held the long-term weekly support zone (green box) multiple times, confirming strong demand and buyer defense.
Current price action is pushing off the support with a series of higher lows, suggesting the start of a new bullish cycle.
Scenario A (Bullish):
— If APT holds above $5.40 and weekly closes stay above this green zone, expect gradual momentum toward the $15–$19 resistance (red box).
— First target is $15.30, with extension to $19.50 if trend accelerates.
Scenario B (Invalidation/Bearish):
— If price fails to hold $5.40 and breaks back below $3.40, setup is invalidated. In this case, expect retest of lower support at $3.00 or lower.
Aptos is showing a classic bottoming structure on the weekly timeframe, with clear accumulation at major support. Sellers have repeatedly failed to break the lows, while buyers step in on every dip. This increases the probability of a mid-term reversal toward the upper resistance band. Weekly structure remains bullish above support; only a major breakdown below $3.40 would invalidate the scenario.

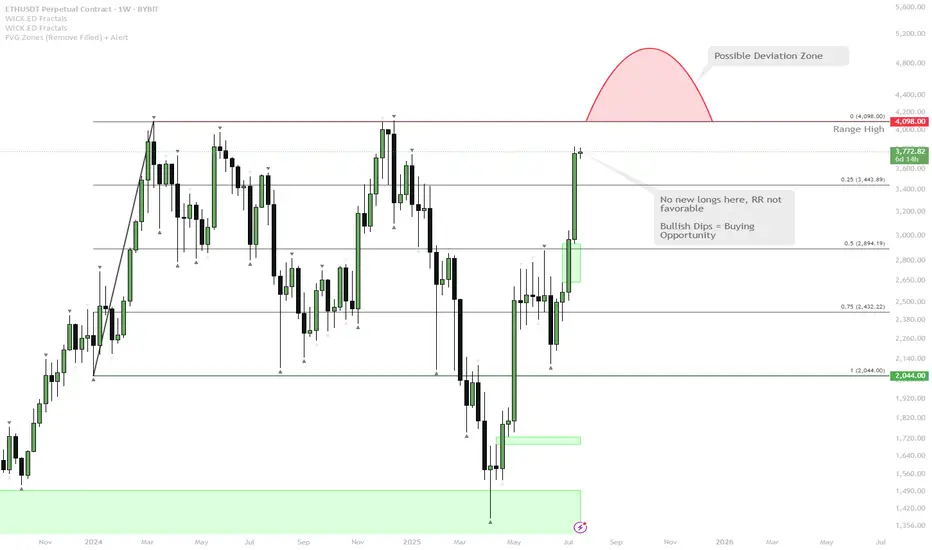
ETH Approaching Major Resistance — Watch for Range High Deviatio
ETH has rallied strongly and is now testing the range highs around $4,100.
The most likely scenario is a direct tap or wick above the range highs — this is a classic spot where the majority expects continuation, but also where deviations (fakeouts) frequently occur.
If price closes above and holds, it could trigger further upside. However, the risk/reward (RR) for fresh longs here is not attractive after such an extended move.
A deviation above range high (quick push above, then close back inside) is possible and would be a bearish signal in the short term.
After this wave, any deep dips in ETH will likely be a high-conviction buy, given the strong bullish momentum.
ETH is showing extremely bullish momentum as it approaches a major weekly resistance at the range high. The obvious play here is a sweep or break of this level, but with the move being so extended, a deviation or fakeout becomes increasingly likely. While momentum is still up, waiting for a dip or failed breakout (deviation) is a better risk/reward play than chasing longs here. Any meaningful pullback will likely present an excellent buying opportunity given the macro strength.
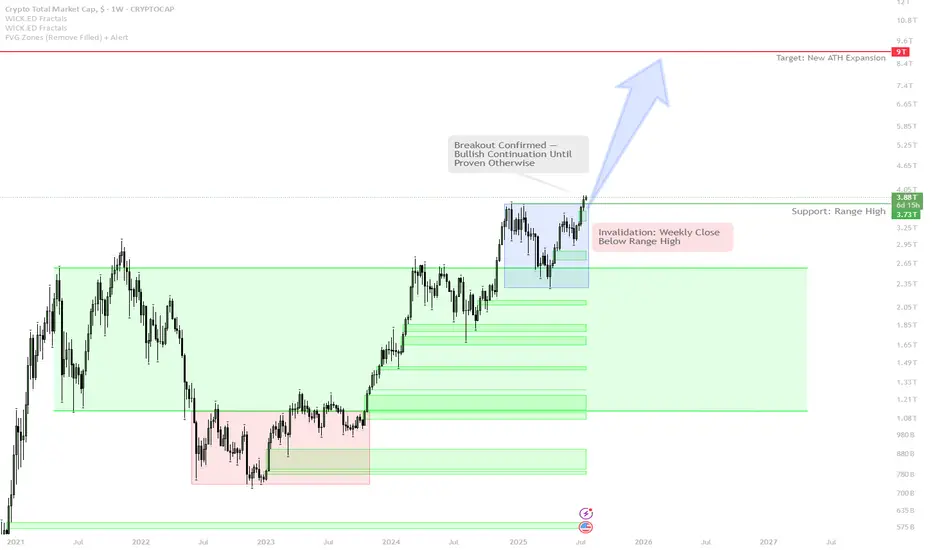
Total Crypto Market Cap: Weekly Breakout Signals Bull Run Contin
The weekly candle has closed above the key range high — this is a major bullish signal, similar to the breakout seen in early 2021.
As long as price remains above this breakout level, the scenario is a continuation uptrend — expect further expansion and strong price action.
If the market fails and closes back below the range high, the breakout will be invalidated — this would signal a potential range or pullback phase.
Current strategy is to trade with the trend:
Hold spot exposure and add on confirmed breakouts.
Do NOT short without a clear breakdown and structure reversal.
If a failed breakout occurs (weekly candle closes back below range high), take profit quickly and switch to risk-off mode.
Market psychology: Most buyers hesitate at lows, but FOMO after a strong move is classic. The disciplined approach is to buy the setup, not the hype.
This is a textbook technical breakout with historical precedence for explosive upside. As long as Total Market Cap holds above the range high, the path of least resistance is up. Attempting to fade the breakout is risky unless there is a clear weekly close back below the level. Trend continuation is favored until proven otherwise. The correct approach is to stay with the trend and manage risk only if a breakdown occurs.
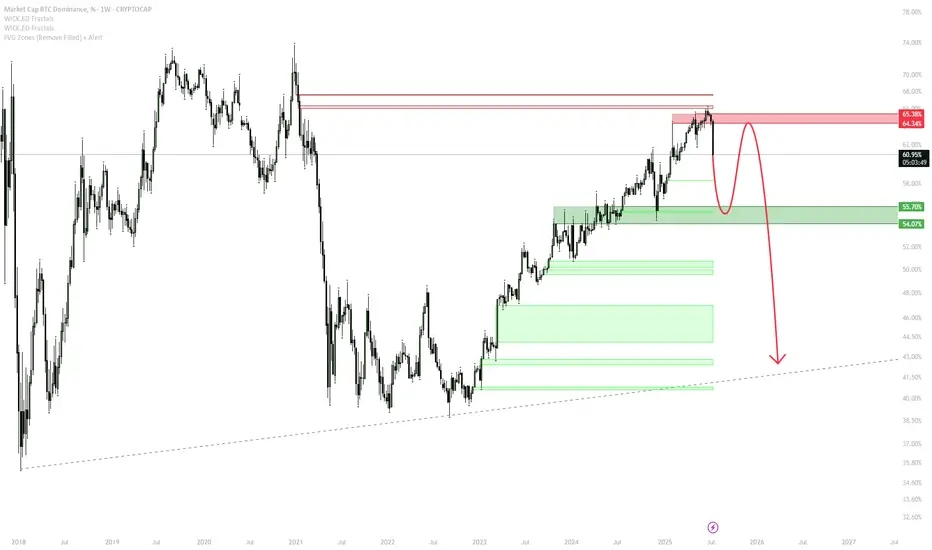
BTC Dominance: Local Top Forming – Prepping for Major Rotation
BTC Dominance ( CRYPTOCAP:BTC.D ) is hitting the major weekly resistance (red box, ~64–65%).
Expectation is for a short-term rejection here, as BTC rotation into ETH and alts begins.
A pullback toward the green support area (54–56%) is likely as ETH and altcoins start outperforming BTC.
After the initial drop, anticipate a strong bounce in BTC.D as late BTC buyers rotate back in, typically mid-altseason.
This bounce often provides the best opportunity for altcoin entries, historically marking a sweet spot for outperformance.
Where the bounce ends (possibly around 56% or lower) will be a question for future analysis; for now, focus is on the rejection and initial drop.
BTC dominance is testing a historically significant resistance zone after a prolonged uptrend. This level has previously marked local tops and initiated sharp reversals into altseason. The scenario is supported by rotation narratives—capital typically flows from BTC into ETH and alts as dominance peaks. A retracement to the green support zone is probable, after which a sharp bounce could trap late BTC buyers before another leg down. Watching the initial rejection and first bounce zone will help identify the next major altcoin opportunity.
FET Setup: Reclaim, Retest, RallyScenario:
Price reclaimed the 1W order block (OB), confirming strong support in the $0.60–$0.70 area.
If price consolidates above this weekly OB, expect continuation toward the $0.96 equilibrium/resistance zone.
A pullback to retest the 1W OB as support (especially in August) is possible and would be a high-probability entry zone for longs.
Failure to hold the 1W OB would invalidate the bullish setup, so stops should be placed below this level.
Reasoning:
The successful reclaim of the weekly order block signals a structural shift from bearish to bullish. Holding above this area invites further upside, as demand is confirmed. A retest and bounce from the 1W OB would provide a strong confirmation for additional upside, while failure to hold would indicate the move was a deviation. Patience for a clean retest is likely to reward, with targets toward the equilibrium near $0.96.

USDT.D — 1W FVG Test & RSI Bull Div | Caution for RiskUSDT Dominance is testing a major 1W FVG support area while developing bullish divergences on the 4H RSI. Although a short-term bounce and market correction are likely, the overall bullish trend in BTC means a sharp reversal is not guaranteed. Risk management is a priority here — no high-risk positions until the RSI resets and market context is clearer.
1W FVG support + 4H RSI bull div
Bounce likely = correction on risk assets
RSI needs reset to 50 before reassessing
If lost — risk-off, possible slice down
Reasoning: Support + momentum, but trend is bullish — not risking gains here

FET — AI Market Wake-Up Above $0.801. Watch for breakout & close above $0.80
2. Enter on confirmed weekly hold > $0.80
3. TP: $1.12–1.25 (major resistance)
4. Key support: $0.73–0.71 (must hold)
5. Stop: below $0.71

IMX — Double Bottom & Weekly RSI Div1. Buy sweep of all-time low, spot weekly RSI divergence
2. Entry: Confirm double bottom or strong bounce
3. Main target: $0.81+ (super bullish if break/hold above)
4. Stop: Below all-time low — scenario invalid

Sonic (FTM) — RR Sweep & Accumulation Setup1. Wait for full sweep of weak lows (target $0.15)
2. Enter long only after reclaim above support zone
3. Macro target: $3.47+
4. If no strong low or reclaim, stay flat

ETH Eyes Key Resistance — Bullish Structure Holds!🎯 Trading Plan:
Scenario 1 (Bullish Continuation):
Buy or hold as long as price holds above VWAP
Target move toward $3,000 –$3,430 (resistance zone)
If breakout above $3,430 — watch for acceleration
Scenario 2 (Rejection at Resistance):
Wait for confirmation of rejection (e.g., weekly SFP or bearish engulfing) in $3,000 –$3,430 zone
Consider short/hedge if rejection is confirmed, targeting a move back toward $2,600–$2,222
Invalidation:
Structure turns bearish only if price closes below $2,222
🔔 Triggers & Confirmations:
Uptrend intact as long as price is above VWAP
Confirmation required for shorts: look for SFP or clear reversal pattern at resistance
📝 Order Placement & Management:
🔼 Buy/Hold: While price is above $2,222
🛡️ Stop: Close below $2,222 (monthly close)
🎯 Targets: $3,150 → $3,430
🔻 Short/Hedge (optional): On confirmed weekly rejection at resistance
🎯 Short Target: $2,600–$2,222
🚨 Risk Warning:
Main structure is bullish; any shorts are strictly countertrend and require strong confirmation

SPX | HTF Breakout Confirmed, Watching for Pullback EntryHTF still bullish — watching W iFVG & weekly OB below as major bid zone.
Breakout to 2.13 next if structure holds.
Lose W OB? Full reset.
Best R:R for swings if we get a flush into 0.75–0.95.

SEI | 1W range reclaim in progress.Holding above $0.20 (range low & demand zone) — expecting a move towards the mid-range ($0.48), where a stack of equal highs is waiting.
Lose $0.20 — invalidation, back to lower support.
Key idea: Range play, targeting liquidity at the mid-range. Macro resistance at $0.75 if breakout extends.
Accumulation still visible, bullish bias above range low.

API3 loves to scam pump when DeFi coins runBINANCE:API3USDT
Mini range and trend support holding so far.
— Holding above $0.65–0.70 = base for a squeeze toward $1.40–2.00.
— Flip $1.10–1.20 = mid-term trend shift.
— Main resistance at $2.33, then macro targets $3.2–5.5.
— Lose trend support? Expect new lows inside the channel.
Key level: watch how it acts above $0.65.

FET | — No Longs Until LowerNYSE:FET is showing weakness after failing to reclaim the $0.80 level, which now acts as invalidation for any bullish setups. Price continues to grind below a key FVG resistance, with no clear breakout.
Plan:
🔻 No Long Setup While Below $0.80
• Bearish bias as long as price remains below reclaimed resistance
• Watching for potential move into lower FVG zones
• No interest in longs unless we see a sweep of key liquidity
🟩 Main Buy Zone: $0.30 (Weekly FVG)
• High-conviction area for long positioning if reached
• Deep liquidity pocket with HTF demand — ideal for spot entries
🎯 Reclaim of $0.80 = Invalidation of Bearish Bias
• Clean weekly close above flips structure bullish again
📌 Let the market flush first. No reason to catch a knife — play from strength, not hope.

$BTC multi-timeframe analysisCRYPTOCAP:BTC is currently at a critical juncture, with three distinct trends emerging on the same chart:
Weekly Bearish Downtrend (Green):
This 1W bearish channel remains intact. Despite bullish optimism, CRYPTOCAP:BTC has not broken out of this green channel, meaning we are technically still in a bearish trend.
Daily Recovery Bullish Uptrend (Red):
On the 1D timeframe, CRYPTOCAP:BTC has been following a recovery bullish channel. However, this channel is now colliding with the top of the bearish weekly channel, creating significant resistance.
Hourly Bearish Downtrend (Yellow):
A new bearish downtrend on the 1H timeframe has formed as a result of CRYPTOCAP:BTC failing to break through the top of the 1W green bearish falling wedge.
Potential Scenarios:
Bullish Scenario 1:
If CRYPTOCAP:BTC breaks through the $90k resistance level and exits the weekly bearish channel (green), it could signal a strong long position and confirm the end of the downtrend, marking a reversal.
Bearish Scenario 2:
If CRYPTOCAP:BTC continues to follow the yellow downtrend and breaks down through the red recovery channel, this would invalidate the recovery and indicate further downside potential.
Outlook and Timeframe:
In my bearish warning from February 2025, I projected the end of the bearish consolidation by May 2025. If the bearish Scenario 2 plays out, it will confirm that this early warning was once again accurate.
However, if CRYPTOCAP:BTC manages to pump above $90k and sustain this level for at least a week, it would signal an early consolidation (one month ahead of schedule) and suggest that we are out of trouble.
Conclusion:
Watch for a confirmed breakout or breakdown.
Patience is key; wait for confirmation before making significant moves.
As always, DYOR (Do Your Own Research).

BTC POST HALVING History doesn't repeat itself, but it often rhymes...
We're now in the post-halving part of the Bullrun, and we can look back into Bitcoins history to help predict what might happen next.
Typically A bull cycle lasts 1065 days from the low to the high with the halving event in the middle. If we use that same timeframe and apply it to this Bullrun we can expect the peak for BTC to come in early October of 2025.
Now we know that once BTC has had it's top, altcoins regain some of the market dominance in an "Alt season" which is often a manic period of profits from BTC being poured into increasingly risky projects until the whole thing comes crumbling down, which then leads too...
The bear market which historically lasts for a full year from top to bottom. The bear market comes when most people least expect it as they are so used to price going up, complacency and greed can cost you all of the gains made in the last 3+ years. It's also important to note that BTC routinely goes through 25-30% corrections on the way up, and this is where many fall down. Knowing the difference between a correction and a top is the difference between making it and roundtripping everything. Have an exit strategy, take profit at key areas, don't let greed win.
The Fibonacci levels can be very useful when a project goes into price discovery as well as big even levels, your 100, 150, 200's etc. When Fib levels line up with these big evens you can expect resistance and therefor look to protect your capital.
Bitcoin is very close to a breakout from the '21 ATH level, we've been above SWB:69K before but swing failed to hit $56K, I am still a little worried about the GETTEX:52K +VE Orderblock as shown in green, it would make sense to revisit that area at some point however it does depend on this current SWB:69K S/R level.

SasanSeifi| Will It Rebound or Drop Further?Hey there, ✌In the weekly timeframe, as you can see, Atom's price has been in a downtrend from the $8.50 range and has now corrected to the crucial weekly support level at $4. Currently, the price is trading around $4.
In the long-term timeframe, maintaining the $4 level is crucial. The price has reacted to this important support, and if it consolidates here with confirmation on lower timeframes, we could expect a potential rebound with positive fluctuations toward the $5 and $6.50 levels.
If positive momentum develops, we should watch how the price reacts to the $6.50 level. To continue the bullish trend and reach the target supply zone of $7 to $8, breaking the $6.50 level is necessary.
On the other hand, if the $4 level breaks and the price stabilizes below it, the likelihood of further correction increases, with potential downside targets of $3.20 to $2.30.
🔶The chart is in logarithmic scale.
This analysis is my personal viewpoint and not financial advice. If you found this helpful, please like and comment – I’d love to hear your thoughts! Happy trading! ✌😊

SasanSeifi|Will It Break Resistance or Test Lower Supports?Hey there, ✌ On the weekly timeframe, BINANCE:LTCUSDT price movement, after ranging around $84, faced a downward trend and corrected to the $50 level. Currently, the price is trading in a range around $63 with limited fluctuations.
In the long-term weekly timeframe, key support levels for Litecoin are at $50 and $42. To continue the upward trend, it’s essential for the price to break the critical resistance at $85 and hold above it. If this resistance is broken, the likelihood of further price growth increases.
For a clearer understanding of the price movement, it’s crucial to closely monitor Litecoin’s reaction to the $70 to $85 range. If the price fails to sustain above these levels, we may see a correction and a potential return to the major support zones.
🔶The chart is in logarithmic scale.
This analysis reflects my personal view and is not financial advice. If you found this helpful, feel free to like and comment – I’d love to hear your thoughts! Happy trading! ✌😊

NEAR protocol on the WEEKLY NEAR is a project that covers all the bases. A Web3 Layer 1 with the capability for unlimited transactions per second (TPS) that's transparent and accessible to everyone. NEAR protocol has begun venturing into the AI space pushed by Co-Founder Illia Polosukhin who is an AI researcher himself, with an AI marketplace as he believes AI is one of the core verticals for the NEAR ecosystem going into the future.
The near chart is a promising one for the future. Having already experienced the 2022 altseason, we can gauge where NEAR will meet resistance, and sellside pressure areas and of course previous ATH. Using Fibonacci levels combined with range quarters we can split up an otherwise daunting chart into sections of a large range. Since the rally began in the beginning of 2024 price has broken above the 0.75 line and has been retested for support, of which it held and is now key support. With BTC's rally on the recent CPI numbers, the stronger altcoins followed suit and now NEAR is targeting the MIDPOINT of the range at $10.72 (0.5 level). From then on there is a clear FVG resistance before hitting the highs.
I have used the Fib levels as long term Take Profit areas, who knows how long it may take to get there or even if we get there at all. However the fundamentals of the Project are very strong, with a great team and expanding into high interest narratives like AI all add up to a very promising project. The one downside is that circulating supply is not capped and will grow at 5% each year. Therefor the tokenomics are not as favourable to investors as for example Injective INJ which has a capped at 100,000,000 coins and currently has 94% of that circulating and that limits dilution of token value.
I'm very bullish on NEAR in the long run, the current LTF bearish pullback has been punishing for the majority of alts however NEAR has held up very well. The AI narrative backing it as well will surely help it progress and the accessibility of being available on all the major exchanges.

SasanSeifi 💁♂Weekly Price Analysis and Growth ExpectationsHey there!
In the weekly time frame, as observed, after breaking out of the range, the price has managed to rise to the price range of $238. It is currently within the $230 price range. The expectation we can have in the weekly time frame is that, if it consolidates above the significant resistance range of $230, we might witness further growth toward the price range of $250 and the liquidity range of $260. In the case of growth, for a better understanding of the continuation of the price movement, we need to see how the price will react to the resistance zones.
🟢 Keep in mind, it's essential to perform your own analysis and take into account additional factors prior to making any trading choices. Best of luck! ✌️
❌ (DYOR) - Do Your Own Research...⚠️⚜️
Of course, if you have any more inquiries or require further clarification, don't hesitate to reach out. I'm here to assist you!
If you found my analysis beneficial, I would be grateful for your support through likes and comments. Thank you! 🙌
