DOMINOs PIZZA 1W BLUG FLAG LONG TRADEBull Flags are repeatable Range trading chart patterns.
Bull Flag chart pattern will have a directional bias depending on the previous incoming trend.
Each chart pattern will have defining trendlines of the support/resistance levels creating the pattern.
What ever time frame you are trading this chart pattern, wait for a candle close outside of the trendline in the direction of the breakout candle. (Our time frame preference is the Daily chart).
Add volume indicator - Volume is the amount of $ that went into a particular candle or in Forex the # of trades that took place.
Add ATR indicator - Volatility is the amount of price movement that occurred. Use the ATR to measure the price movement.
When you see descending Volume bars and descending ATR line (which indicates volatility) this shows
a dis-interest in traders to invest in this pair creating consolidation which creates the chart pattern.
Trade Management after there is a breakout candle close.
1 - Position size (compare volume bar to volume ma line).
a - Breakout candle must be 100% of average volume for a full position size.
b - If 75% of average volume then ½ position size. (To find 75% of Volume
look at the charts volume settings – divide smaller # into larger # = 75%+)
2 - Enter two trades.
3 - SL for both trades will be 1.5 x ATR.
4 - 1st trade TP will be 1 x ATR.
5 - No TP on 2nd trade – letting profit run and adjusting SL to follow price.
6 - When 1st TP hit – move 2nd trade SL to breakeven.
7 - Adjust the 2nd trade SL to follow price.
*8 – After Breakout candle – if price closes back into chart pattern close trade
*9 - When breakout candle is more than 1 ATR from breakout candle open.
a - Enter 1st trade at candle close with ½ position size.
b - Enter 2nd trade with a pending limit order that is 1 ATR of breakout candle open.
c – Price should pullback to that pending limit order for 2nd trade.
d – If Price returns back into chart pattern close trade before SL is hit.
1w

EURCHF 1W DESCENDING TRIANGLE SHORT TRADEDescending Triangles are repeatable trading chart patterns.
Descending chart patterns will have a directional bias depending on the previous incoming trend.
Each chart pattern will have defining trendlines of the support/resistance levels creating the pattern.
What ever time frame you are trading this chart pattern, wait for a candle close outside of the trendline in the direction of the breakout candle. (Our time frame preference is the Daily chart).
Add volume indicator - Volume is the amount of $ that went into a particular candle or in Forex the # of trades that took place.
Add ATR indicator - Volatility is the amount of price movement that occurred. Use the ATR to measure the price movement.
When you see descending Volume bars and descending ATR line (which indicates volatility) this shows
a dis-interest in traders to invest in this pair creating consolidation which creates the chart pattern.
Trade Management after there is a breakout candle close.
1 - Position size (compare volume bar to volume ma line).
a - Breakout candle must be 100% of average volume for a full position size.
b - If 75% of average volume then ½ position size. (To find 75% of Volume
look at the charts volume settings – divide smaller # into larger # = 75%+)
2 - Enter two trades.
3 - SL for both trades will be 1.5 x ATR.
4 - 1st trade TP will be 1 x ATR.
5 - No TP on 2nd trade – letting profit run and adjusting SL to follow price.
6 - When 1st TP hit – move 2nd trade SL to breakeven.
7 - Adjust the 2nd trade SL to follow price.
*8 – After Breakout candle – if price closes back into chart pattern close trade
*9 - When breakout candle is more than 1 ATR from breakout candle open.
a - Enter 1st trade at candle close with ½ position size.
b - Enter 2nd trade with a pending limit order that is 1 ATR of breakout candle open.
c – Price should pullback to that pending limit order for 2nd trade.
d – If Price returns back into chart pattern close trade before SL is hit.

EURUSD 1W WOLFE WAVE STRATEGY - Rising Wedge is a Bearish Bias When trading the best wolfe strategy you will find that after the entry is triggered your position should show you an immediate profit. This is because the reversal pattern that emerges from the wolfe wave chart pattern is very violent.
Once we’ve got the first five waves we have the general setup of the wolf wave. After the last wave has broken above the ascending wedge channel it’s the time to get ready for some action.
Step #1: Prior to the Bearish Wolfe Wave Formation look to have a clear Bullish Trend.
Firstly, before the first wave to develop we need to have a clear trend that needs to be reversed. For high probability trades, we want to see a prior bullrish trend before the bearish wolfe wave develops.
This step is quite essential if you want to correctly trade the wolfe pattern.
Now that we’ve identified a trend, it's time to apply the wolfe wave rules to the price chart. This brings us to the next step of our reversal strategy.
Step #2: Try finding a 5 wave move that can be contained in a channel. The last wave 5 must break above the wedge channel.
A valid wolfe wave is composed of 5 waves that follow some simple rules. However, the most important rules are that wave 2 and 4 must be contained within the channel created by Wave 1 and Wave 2.
Secondly, wave 5 breaks above the trendline created by wave 1 and wave 3.
Step #3: Sell after we break above and then a candle close back inside the Wedge Price Channel.
At the moment when the price enters and closes back into the price channel, we want to enter a short position. We like to wait for the close inside in order to eliminate possible fake breakouts.
Note*: If we don’t get a close back into the wedge price channel we don’t have a valid trade signal.
Another sign to look for is how quickly it goes back into the channel. We prefer to only trade the wolfe patterns that retrace very quickly back into the range.
This is a sign that a smart money reversal is at work.
Remember, in trading, you only want to trade the high probability trade setups.
Step #4: Draw a trendline that connects the wave 1 high and wave 4 low and extend it in the future. Take profit when the EPA line is hit or candle close below it..
The line that connects the wave 1 high and wave 4 low is called the wolfe wave EPA line.
The EPA line stands for Estimated Price at Arrival and it’s an effective take profit strategy. The EPA line main purpose is to show at what price the market will extend after it reversed the previous trend.
Note*: If the EPA line is too steep, often time it means that the price will never reach it. In this case, you want to take profits early.
Step #5: Hide Protective Stop Loss above Wave 5.
The protective stop loss can be located above the last wave or wave 5. This strategy gives us a very tight stop loss which is good for our risk management strategy.
Obviously that a break above wave 5 means we also break first above the channel and this will invalidate the validity of the wolfe wave chart pattern.
Note** the above was an example of a SELL trade using the best wolfe wave strategy. Use the same rules for a BUY trade.
Conclusion - Best Wolfe Wave Strategy
The wolfe wave strategy is a trading strategy built around waves the same like Elliott Wave trading. We use other trading concepts like channeling and price symmetry to find the best possible trade signals.
If the trade works in our favor then we have a really good chance to have a good trade in terms of risk to reward ratio. With trading experience, it will become much easier to spot the wolfe wave patterns.

Netflix Breakout to All-Time HighSorry I've been away for a bit. Had personal things to take care of, but I have a lot in store for the upcoming weeks. Let's get right back into it!
In this chart we're looking at Netflix on the 1W chart as price has consolidated into a beautiful symmetrical triangle. Price is currently breaking through the descending boundary and is attempting to confirm breakout after a clear 1W candle close above the $373 area.
This symmetrical triangle has a price target of around $527 for about a ~45.5% gain.
This chart pattern breakout is occurring above the 200EMA, so the probability for price continuing to the upside is even higher.
If you would like to see more of these ideas on a regular basis, follow me as I will be posting many more exciting chances to earn on chart pattern breakouts this upcoming year!
Drop a like or comment if you found this idea informational or helpful in any way!
Cheers!

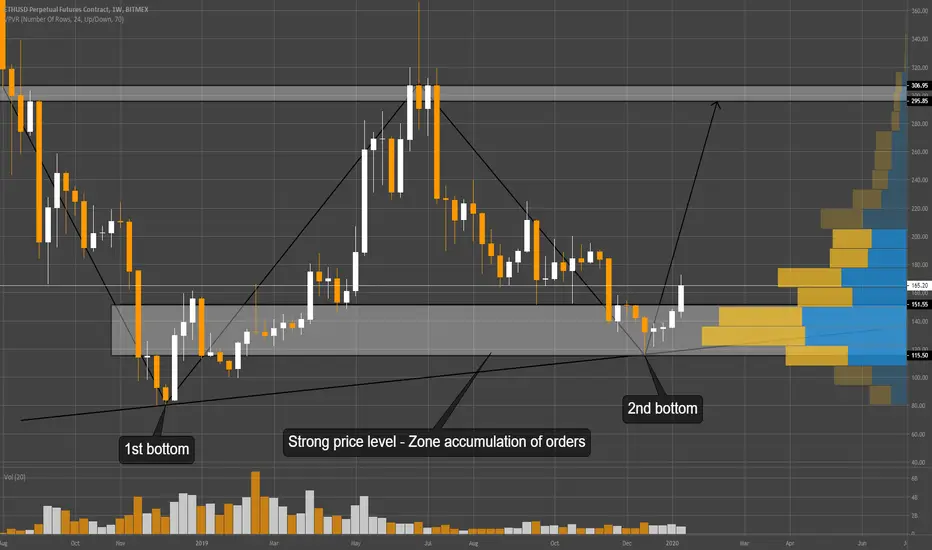
Ethereum - global trend reversalA global trend reversal of ETHUSD is being prepared. The price of ether may double, or at least grow significantly.
There are two arguments for long Ethereum:
1) Double bottom on timeframe 1 week.
2) The bulls again managed to get the price out of the 115$-150$ zone. A large volume is accumulated in this range. This is confirmed by both the horizontal and vertical volume profile.
So, the priority now is to buy this coin.
PKI Breakout to All-Time HighIn this chart we're looking at PKI on the 1W chart as price has consolidated into an ascending triangle . Price has broken through the horizontal boundary around $98. After price prints a 1W candle through $101.28 breakout will be confirmed.
This ascending triangle has a price target of around $125 for about a ~27% gain.
If you would like to see more of these ideas on a regular basis, follow me as I will be posting many more exciting chances to earn on chart pattern breakouts this upcoming year!
Drop a like or comment if you found this idea informational or helpful in any way!
Cheers!

NVO Breakout to All-Time HighIn this chart we're looking at NVO on the 1W chart as price has consolidated into an ascending triangle . Price has broken through the horizontal boundary around $58. After price prints a 1W candle (1 day left) through $59.77 breakout will be confirmed.
This ascending triangle has a price target of around $85 for about a ~46% gain.
Price has good momentum as it has found support on the 200EMA and is breaking out of its chart pattern boundary well above the 200EMA.
If you would like to see more of these ideas on a regular basis, follow me as I will be posting many more exciting chances to earn on chart pattern breakouts this upcoming year!
Drop a like or comment if you found this idea informational or helpful in any way!
Cheers!

USDMXN - HOW TO TRADE WEEKLY SIGNALS WITHOUT BREAKING THE BANKThe weekly trade signals are very powerful to trade but the weekly stop losses are so large it makes you trade very small size positions.
It takes a long time for a weekly entry to hit it's first target.
This technique takes that built up explosive energy in a huge weekly pattern.
But to trade a size that will make it worth while and to get in and out of the trade more quickly.
The weekly chart shows the week of Dec. 9th is the candle that triggered the trade.
It closed on Dec 13th at an ATR of .3457.
This pair moves a hugh amount of pips every day.
Weekly ATR = .3457
Weekly candle close entry @ 19.00
Weekly SL is 1.5 x ATR (.3457) = .5186 pip SL or SL @ 19.5156
Weekly 1st TP is 1 x ATR = .3457 pip TP or TP @ 18.65
Use the free trade size calculator at our TSG website under free tools.
Demo Acct Size $10,000 Risk Percentage 1% (open two positions of 1% each) & SL of 5186 pips =
You can trade 3.62 Micro Lots or 3 micro lot trade size.
You still watch weekly chart for breakout setup but use 1st Daily chart for SL & TP.
Your alternative option is to use the Daily SL & TP for the daily breakout candle close.
Dec. 9th Daily Close breakout candle.
Daily ATR = .1361.
Daily candle close entry @ 19.24.
Daily SL is 1.5 x ATR (.1361) = .2041 pip SL or SL @ 19.44.
Daily 1st TP is 1 x ATR = .1361 pip TP or TP @ 19.1039.
Free Trade Size Calculator - Demo Acct Size $10,000 Risk 1% with SL of .2041
You can trade 9.59 Micro Lots or 9 Micro lots.
Your Daily 1st TP is closer now also at 19.1039 which your are trading with 9 miro lots.
1st TP was hit on 4th day.
USDMXN 1W trade was tied up for 5 weeks with 6 micro lots without hitting 1st TP.
Use Weekly Chart Pattern Trade set.
But use 1st Day Candle Breakout Close for Trade Management data.
No reason to use full week numbers on a weekly trade signal.
This applies to all markets that you trade.
We often see big patterns on indexes and metals where you can use this technique to shorten your trades.
This also allows you to use a bigger size.
Much better to see your TP hit in a day or two.

BOEING 1W DESCENDING TRIANGLE BREAKOUT SHORT TRADE Descending Triangles are repeatable trading chart patterns.
Descending chart patterns will have a directional bias depending on the previous incoming trend.
Each chart pattern will have defining trendlines of the support/resistance levels creating the pattern.
What ever time frame you are trading this chart pattern, wait for a candle close outside of the trendline in the direction of the breakout candle. (Our time frame preference is the Daily chart).
Add volume indicator - Volume is the amount of $ that went into a particular candle or in Forex the # of trades that took place.
Add ATR indicator - Volatility is the amount of price movement that occurred. Use the ATR to measure the price movement.
When you see descending Volume bars and descending ATR line (which indicates volatility) this shows
a dis-interest in traders to invest in this pair creating consolidation which creates the chart pattern.
Trade Management after there is a breakout candle close.
1 - Position size (compare volume bar to volume ma line).
a - Breakout candle must be 100% of average volume for a full position size.
b - If 75% of average volume then ½ position size. (To find 75% of Volume
look at the charts volume settings – divide smaller # into larger # = 75%+)
2 - Enter two trades.
3 - SL for both trades will be 1.5 x ATR.
4 - 1st trade TP will be 1 x ATR.
5 - No TP on 2nd trade – letting profit run and adjusting SL to follow price.
6 - When 1st TP hit – move 2nd trade SL to breakeven.
7 - Adjust the 2nd trade SL to follow price.
*8 – After Breakout candle – if price closes back into chart pattern close trade
*9 - When breakout candle is more than 1 ATR from breakout candle open.
a - Enter 1st trade at candle close with ½ position size.
b - Enter 2nd trade with a pending limit order that is 1 ATR of breakout candle open.
c – Price should pullback to that pending limit order for 2nd trade.
d – If Price returns back into chart pattern close trade before SL is hit.

$BDX Breakout to All Time HighIn this chart we're looking at Becton Dickinson & Co on the 1W chart as price has consolidated into an ascending triangle . Price has recently broken through the horizontal resistance around $263 with a strong weekly candle. Breakout was confirmed after price broke through $271. I just came across this company's stock this weekend, so I missed the initial breakout. Even though the initial breakout was missed, we had a small pullback and then another strong weekly candle to show this instrument has strength. There is still plenty of upside to be taken advantage of.
This ascending triangle has a price target of around $319 and we have already seen a small pullback before what seems to be continuation to the upside.
Nonetheless, if we see another larger pullback, I expect price to find support on the horizontal chart pattern boundary around $263.
If you would like to see more of these ideas on a regular basis, follow me as I will be posting many more exciting chances to earn on chart pattern breakouts this upcoming year!
Drop a like or comment if you found this idea informational or helpful in any way!
Cheers!

$CRM Breakout to All-Time HighToday we're looking at Salesforce.com on the 1W chart as price has consolidated into an ascending triangle. Over the past week price has broken through the horizontal resistance around $166 with a very strong weekly candle.
This ascending triangle has a price target of around $214.25 but we may see a small pullback before continuation.
If we see a pullback I expect price to find support on the horizontal chart pattern boundary around $166.
If you would like to see more of these ideas on a regular basis, follow me as I will be posting many more exciting chances to earn on chart pattern breakouts this upcoming year!
Drop a like or comment if you found this idea informational or helpful in any way!
Cheers!

XAUUSD 1W ASCENDING TRIANGLEAscending Triangles are repeatable trading chart patterns.
Triangles and ranges are consolidation chart patterns that can breakout either direction.
Ascending and descending chart patterns will have a directional bias depending on the previous incoming trend.
Each chart pattern will have defining trendlines of the support/resistance levels creating the pattern.
What ever time frame you are trading this chart pattern, wait for a candle close outside of the trendline in the direction of the breakout candle. (Our time frame preference is the Daily chart).
Add volume indicator - Volume is the amount of $ that went into a particular candle or in Forex the # of trades that took place.
Add ATR indicator - Volatility is the amount of price movement that occurred. Use the ATR to measure the price movement.
When you see descending Volume bars and descending ATR line (which indicates volatility) this shows
a dis-interest in traders to invest in this pair creating consolidation which creates the chart pattern.
Trade Management after there is a breakout candle close.
1 - Position size (compare volume bar to volume ma line).
a - Breakout candle must be 100% of average volume for a full position size.
b - If 75% of average volume then ½ position size. (To find 75% of Volume
look at the charts volume settings – divide smaller # into larger # = 75%+)
2 - Enter two trades.
3 - SL for both trades will be 1.5 x ATR.
4 - 1st trade TP will be 1 x ATR.
5 - No TP on 2nd trade – letting profit run and adjusting SL to follow price.
6 - When 1st TP hit – move 2nd trade SL to breakeven.
7 - Adjust the 2nd trade SL to follow price.
*8 – After Breakout candle – if price closes back into chart pattern close trade
*9 - When breakout candle is more than 1 ATR from breakout candle open.
a - Enter 1st trade at candle close with ½ position size.
b - Enter 2nd trade with a pending limit order that is 1 ATR of breakout candle open.
c – Price should pullback to that pending limit order for 2nd trade.
d – If Price returns back into chart pattern close trade before SL is hit.

$MDU Consolidation Before BreakoutTo wrap up the year I'm going to leave you all with one more idea I have my eyes on. In this situation, we're looking at $MDU.
MDU Resources Group is a stock that we have seen consolidate into two different patterns over the course of the last nine years. Both respective patterns have yielded excellent results as both have reached their respective targets. Now it is almost time for our third pattern to breakout.
This time we are seeing price consolidate into a three and a half year long rectangle.
I'm looking for a clear break (1W candle close) above the price of $30 (dotted purple line.) After we get a clear breakout above that level, I'm looking to enter a long position targeting the price of $36.20 for a gain of ~22%.
To further support the idea of a bullish breakout, we can see the 200 EMA resting below the breakout level, which adds to my conviction that we will see a breakout to the upside.
If you would like to see more of these ideas on a regular basis, follow me as I will be posting many more exciting chances to earn on chart pattern breakouts this upcoming year!
Drop a like or comment if you found this idea informational or helpful in any way. I wish everyone a happy and healthy new year!
Cheers

$INTC Bullish Consolidation Before Possible BreakoutAs this week of trading is nearing an end, I wanted to share another potential trading setup I've had my eyes on. In this setup we're looking at Intel Corp.
Back in late 2014/early 2015 this instrument began consolidating into an ascending triangle (bullish continuation pattern) and sure enough, price broke through the top side of the triangle and continued heading up to the point we're at now. Following the breakout of the previously mentioned ascending triangle, we can see price is now consolidating into a rectangle.
The 200 EMA has been resting comfortably below both setups as added support - giving me more conviction that we're about to see another break upwards.
I'm looking for a clear break and close above the $59.50 (dotted purple line) area.
Price is attempting to break that boundary with this week's 1W candle close.
If we get a clear close above this chart pattern boundary, I'm targeting price to reach previous all-time highs around $72.50
I hope everyone is having a great holiday season.
If you found this idea informative or helpful in any way, please leave a like or comment to let me know!
Cheers

WHY PLANET FITNESS IS THE #1 STOCK TO BUY ON PULLBACKS Start for $1 - Monthly membership is $10 - $20 mo. go to any location
Free T-shirts, bagels, pizza
Clean beautiful gyms
Equipment well maintained - Employees always nice with a no judgement zone
They have dialed in this gym experience
Weekly chart shows they have dialed it in for years
Most of weekly volume spikes are on bullish weeks
People are interested in this chart - volume is going up - volatility is going up
There is a continuous increase in the trend line angle
Anytime your trend line does a dramatic increase like this is called a bump and run.
The bump and run trend line is usually considered bearish but there are strong bullish signs still
Drilling down to 1D chart , notice hugh gap down on May 3rd
Gap down on positive earnings news
Drove down to 15m chart to find where volume spike came from
First few 15m candles drove price back up so gap spike from 1D came from positive moves
Most of the traders want this pair long
When most traders want price to go long you are probably in for a pullback
Price has been pushing up for some time so expecting some consolidation
Watch for an ascending triangle to develop
Sell when you see pullback on reduced volume and volatility
Buy at trend line bounce
If pullback did not come with reduced volume/volatility then enter with smaller size.
Use ATR to determine SL (1.5xATR)and TP (1xATR). When in profit take some off and move SL to break even.

Bitcoin will hit the MA 50 like a wallBTC just touched the 50 Moving Average on the Weekly chart (more relevant) and retracted quickly.
As of now it doesn't look like it has the "umpf" to go above it.
We will see in the next days.
My personal feeling is that the bulls need to regroup at this time as more buying power can be gathered at lower prices.
This is not trading advice, just my personal opinion.

SHAQ STRATEGY APPLIED TO PAPA JOHN'SShaq O'Neal was appointed to the Board of Directors to Papa John's
Price has taken a sharp rise
Let's see if the strategy for Papa John's works

Bitcoin Drop to $3000 area??As the bulls have slowed their progress in BTC and other cryptos like the lonesome LTC in its push upwards, it seems a correction is definitely not out of the question for the coming months. The downward channel in BTC is still clear and still unbroken and as we see a push up to the top side of the channel we have had a large amount of resistance from the bears. It is a risky time to gamble on a position in BTC as a bull so tread carefully. I think a push to $3000 is possible, this is where we will see a large support if we fall that low. I hope that will be the bottom for BTC but nothing can be said for sure, we will just have to wait and see.
On another note, what if we see a short squeeze instead of a drop to $3000 as the bears are gearing up to short BTC? Im not counting on it but if this is all speculative then why not imagine what might happen on the flip side.
I am very much a beginner and just want to make observations and learn from them! My simple analysis is for fun and learning, please do not make trading decisions based on my observations - like I said I am just a beginner.
Thanks so much for reading my analysis, please follow me and like my post!
- Max K.

gbpnzd short term bullish but long term bearishon the gbpnzd, price formed a large rising wedge pattern while creating a smaller version straight after. I believe price will touch support zone as it has been tested many times from the two patterns.
lower timeframe consists of different setup so stay online for that one.

usd/chf short term bullish, long term bearishOn the usd/chf, I see a major bearish move from the resistance zone. Waiting for minor bullish flag to break out and retest the resistance. Looking for market to delve into lower prices at around approx 0.94 and 0.92 area range
Break from the bullish flag could be used for short term long trade while waiting for price to reach resistance zone.
Around the resistance zone is where I will be looking for entry on lower timeframe.

GBPJPY outlook: Short term & Long term view.1W:
GBPJPY broke out of a descending trend line last week, exposing the pair to further potential upside movement.
A retest of the trend line may occur before price starts to increase.
4H:
On the 4H chart we can see price broke and closed below a short term ascending trend line, opening up possibility for a short term decline in price.
Trading plan:
Going into the week ahead we would like to sell the pair short-term upon a retest of the broken 4H trend line & a bearish 4H candle close.
We would then wait for bullish price action signal when price reaches the reversal zone & find entries to long-term buy trades.
Be aware of any upcoming high impact economic news for GBP & JPY. Brexit speeches/news which may cause large spikes.
Updates will be posted as this trade plays out.

aud/nzd simple bullish setupon the aud/nzd, support seems to be respected from the weekly/daily chart. On the 4hr chart I am hoping that that price breaks out from the trendline so I can find a way to enter.

EUR/USD: Net-Long Traders Flood In Since Last WeekNET-LONG POSITIONS SPIKE 52.7% SINCE LAST WEEK
FOLLOW Our Profile- www.tradingview.com
EURUSD: Retail trader data shows 56.9% of traders are net-long with the ratio of traders long to short at 1.32 to 1. The number of traders net-long is 4.7% higher than yesterday and 52.7% higher from last week, while the number of traders net-short is 9.0% lower than yesterday and 30.9% lower from last week.
To gain more insight to how we use sentiment to power our trading, join us for our weekly Trading Sentiment webinar.
BEARISH BIAS LURKS OVER EUR/USD
We typically take a contrarian view to crowd sentiment, and the fact traders are net-long suggests EURUSD prices may continue to fall. Traders are further net-long than yesterday and last week, and the combination of current sentiment and recent changes gives us a stronger EURUSD-bearish contrarian trading bias.
TO get more information and hourly alert analysis FOLLOW Our Profile- www.tradingview.com
