KASPA Structure Analysis – Downtrend BreakoutAfter retesting the $0.05 demand zone (previous resistance dating back to August 2023), BITGET:KASUSDT reclaimed the 50-day EMA (yellow) and tested the 200-day EMA (orange), before a brief pullback with the 50-day EMA acting as support.
Key Levels
• $0.050-$0.060: Main demand zone
• $0.083: Current support, reinforced by 50-day EMA
• $0.105: Current resistance, reinforced by 200-day EMA
• ~$0.120: HVN and potential resistance
• $0.155-$0.160: HVN, previous S/R and potential resistance
• $0.180-$0.200: Main supply zone
Here's a weekly chart with volume profiles for more context:
Considerations
• The breakout from the recent downtrend, and the break above the 50-day EMA followed by a retest as support, is a good sign for the bulls.
• If the 200-day EMA is successfully reclaimed, it could offer a good shot at retesting the main supply zone in the $0.180-$0.200 area.
• Conversely, a sustained break back below the 50-day EMA could lead to another test of the $0.050-$0.060 main demand zone.
Neutral outlook until a break above 200-day EMA or below 50-day EMA.
200

CORE Rectangle BreakoutBITGET:COREUSDT appears to be breaking out of a 2 1/2 months long rectangle, and is currently challenging the 100-day EMA.
Confirmation: Daily close above $0.58
Invalidation: Break back below the rectangle resistance
Target: Previous support at $0.77 (resistance reinforced by 200-day EMA)

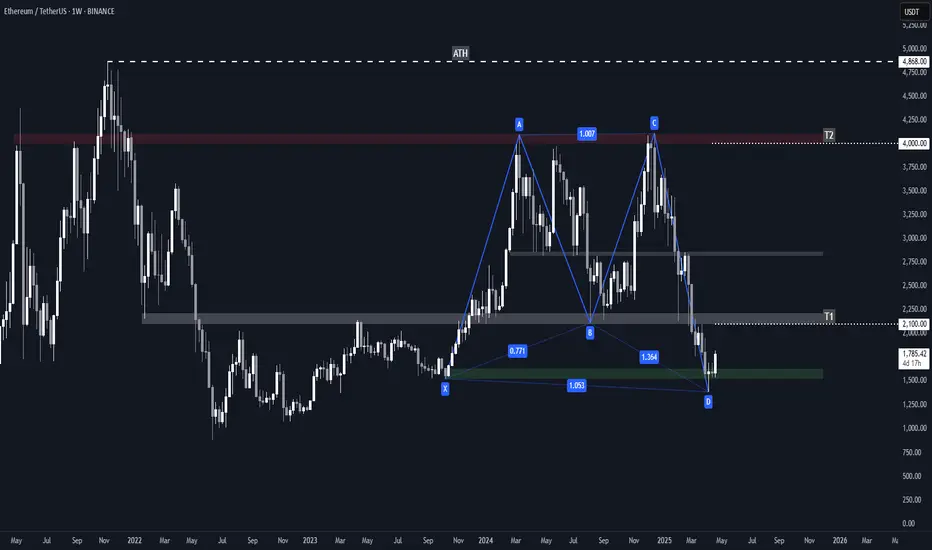
ETH Bullish Navarro 200 Harmonic Pattern + Key Levels / TargetsHarmonic Structure: Navarro 200
Ethereum's weekly chart showcases a fully formed Navarro 200 pattern, identified by:
• A deep B-to-D leg extension (~1.364) — beyond typical harmonic norms, validating the Navarro classification.
• Precise internal Fibonacci alignments:
- XA retracement to B = ~0.771
- BC extension to D = ~1.364
• Completion of point D in a historical demand area around $1500, indicating a potential reversal zone (PRZ).
This harmonic pattern suggests a bullish reversal scenario, contingent on price holding above the $1500 level.
Demand Zone: $1500–$1600
This green box zone represents a major accumulation range from early 2023:
• High volume support — confirmed by prior consolidations.
• On-chain data supports this as a major ETH acquisition zone (1.5M+ ETH bought).
• Current bounce from this area following a liquidity sweep reaffirms it as a strong demand base.
Failure to hold this zone could invalidate the bullish harmonic setup.
Target Zones (Based on Navarro 200 Mechanics)
• T1: $2100–$2200
- Historically significant support-turned-resistance.
- Converges with structural highs and prior breakdown area from mid-2024.
- First logical profit-taking or reaction point following a D-point reversal.
• Mid-Zone: ~$2800
Though not labeled as a target, this is a key supply region to monitor:
- Past consolidations and price rejection.
- Mid-range of the overall pattern.
- Also aligns with prior bullish support in 2024 that flipped to resistance.
• T2: $4000–$4100
- Strong weekly supply zone marked in red.
- Aligns with point C of the pattern.
- Also a psychological barrier near the previous all-time high area ($4,868).
- Likely to see heavy resistance if price rallies that far.
Risks to Watch
• Failure to hold the $1500–$1600 demand zone could send ETH into deeper retracement.
BITCOIN NETWORKWhen Bitcoin was first introduced by the pseudonymous Satoshi Nakamoto in 2008, it generated a wide range of reactions and predictions from various sectors, including technology enthusiasts, economists, and financial experts. Here are some of the early predictions and opinions about Bitcoin:
1. **Skepticism and Dismissal**:
- Many mainstream financial experts and economists were highly skeptical of Bitcoin. They saw it as a speculative bubble, similar to previous economic bubbles. For instance, economist Nouriel Roubini famously dismissed Bitcoin, predicting its eventual collapse.
- Warren Buffett, a renowned investor, called Bitcoin "rat poison squared" and cautioned investors to stay away from it.
2. **Enthusiasm from Technologists**:
- Among technologists and early adopters, there was significant enthusiasm. They saw Bitcoin as a revolutionary technology with the potential to disrupt the traditional financial system. The decentralized nature of Bitcoin and the underlying blockchain technology were particularly praised.
- Hal Finney, a noted cryptographer, was one of the earliest supporters and received the first Bitcoin transaction from Satoshi Nakamoto.
3. **Libertarian Support**:
- Bitcoin garnered considerable support from libertarians and those advocating for financial privacy and freedom. They viewed Bitcoin as a tool to circumvent government control and provide individuals with greater financial autonomy.
4. **Media Coverage**:
- Early media coverage was a mix of curiosity and skepticism. Some articles highlighted the potential of Bitcoin to change the world, while others focused on its association with illicit activities due to its pseudonymous nature.
5. **Comparison to Gold**:
- Some early proponents referred to Bitcoin as "digital gold," emphasizing its potential as a store of value. This comparison was made due to Bitcoin's limited supply (21 million coins) and its potential to act as a hedge against inflation and economic instability.
6. **Volatility Concerns**:
- Many critics pointed to Bitcoin's extreme volatility as a major drawback, arguing that it would prevent Bitcoin from being used as a stable medium of exchange or store of value.
Here are a few notable early quotes and predictions:
- **Satoshi Nakamoto (2008)**: "I've been working on a new electronic cash system that's fully peer-to-peer, with no trusted third party."
- **Hal Finney (2009)**: "Thinking about how to reduce CO2 emissions from a widespread Bitcoin implementation."
- **Paul Krugman (2013)**: "Bitcoin is evil" - reflecting his strong skepticism and belief that Bitcoin would not succeed.
Despite the mixed predictions and opinions, Bitcoin has grown significantly since its inception, influencing financial markets, inspiring numerous other cryptocurrencies, and sparking widespread interest in blockchain technology.

The daily chart and the 200 day MA The daily chart and the 200 day MA are known to provide a really good trading opportunity – not always but frequently. When price has spent some time below or above the MA and it crosses over to the other side, you should be watching this. If price retests the MA and gets rejected, you may have an opportunity to catch a multi-day runner.
In the USDTHB chart here, you can see that price has crossed over above the 200dma. It is starting to pull back towards it now and possibly will stall either at the major support at 35.20 or the MA. If we get a clear sign of being rejected and a bullish candle prints above the MA, it is a good sign to take a long. If such PA develops, you could be in for massive profits IF you stay patient and committed.
Also, check out AUDUSD for a similar setup.
Once again, we are only watching and trading this on the daily chart.
Nothing is 100% in trading, so as always, use sound money and risk management and stay patient in all your trades. If you like my content, please give it a “thumbs up” and follow me to get even more.

ETH Weekly Death Cross ? ETH/USD #ethusd #eth #ethereumWell...I know the market can be hard to read sometimes but the ETH weekly chart above seems like it will have a Death Cross soon on our weekly chart . That's the main thing I see here . You see that light blue 50 MA ? And it looks like it will cross down through the dark blue 200 MA perhaps sometime this month ,in April . That's called a Death Cross of the 50/200 MAs or moving averages .It's bearish and price could definitely go down though it remains to be seen if the cross actually occurs . Bitcoin had a similar Death Cross on it's weekly chart in early February - and though it did dump a bit it also had a pump above weekly 200 MA recently . If we are going to avoid this cross ETH would really need to pump from here though . Not sure it will. Let's see how it plays out .

ASX200 double topASX200 is at a double top, if momentum holds this would be a powerful breakout the chart lines up for a market exhaustion at tax time =)

My Price Analysis of LINKBTC on December 10, 2022Hello friends. Today, according to the LINKBTC chart, I noticed that the chart is generally going down and I have drawn the short-term channel in the 1-hour time frame. The formation of EMAs of 50, 100 and 200 assures that the market is bearish. On the other hand, this arrangement is being formed in the 2-hour time frame. On the other hand, the MACD indicator gives a buy signal. My analysis of this signal is that it can either be a fake signal or a short-term signal that will return to its downward channel after encountering the upcoming resistance. and continue its downward trend.

200/110/2 Day MA SP500Chart configured to plot 200, 110, and 2-Day Moving Averages for the SP 500
Sorry, this is my first attempt at sharing a TV graph.
9581826.com

A First for CME BTC to Test 200 Weekly EMA, Did not Exist BeforeBTC CME has just recently populated the weekly 200 moving averages, both the Exponential and the Simple. BTC is now testing the 200 Weekly 200 SMA for the first time. It took 234 bars to do so. The law of math equates that a 200 simple average will be tested or cross on average every 200 bars...

GMT/USDThi.
Keep an eye on this currency, because although it has made a profit of over 200%, it is still on the rise.

Long ATT. Dividned still good enough after spinoff as wellBullish longterm outlook. RSI, MACD, EMA plus thepullback all point to a great entry.

Dogecoin LONG to 200$Dogecoin is getting ready for its hyper pumps. 200$ targets Make sure to have at least some
Zoom in for more understanding of the idea this is for super long targets

$SPX correction ? From Gann's time cycle analysis, i am forecasting a top around Aug 13 and bottom on Aug 19 (around the 4350 level)
The bottom should touch on the MA100 and backup again.

Doge; 200 daily EMA In my last doge post, I stated what we needed to do in order to continue upwards but, if doge couldn't achieve those said goals then we were to meet the 200 Daily EMA.
WELL, here we are! At the 200 Daily EMA after doge failed the box phase. 📦
Expect volatility now which could be good for swing trades.
I'm looking for DOGE to recoup big off the 200 with a higher low povit incoming but ain't gonna be hasty just yet.
I'll make a new phase to study soon but for now,
let's see what happens!

BTC.USDT bitcoin price, warning Hiiii all traders
this is kind of warning for whole market, why?? due to reasons below👇
1. USDT.D seems to be prepare for a height jump according to symmetrical triangle(guess what would happen then?!)
2. tow strrrrong resistant in BTC chart( Kijun Sen( red line) and MA200(blue line))
3. as it seen the MA50 and the MA200 are about crossing in next few days, which can be alarm for BTC price to another big fall
4. and some other fundamental & technical evidence...
in my opinion these could lead BTC to touch it's long_term bottom,between 19k-21k(sweet price for long position)
be aware and prepare 🤞🤙

Bitcoin 200-day EMA Rejection ShortPlay on rejection of 200-day EMA after bulls fail to break the downtrend with tight stop loss.
Entry: 41,000
Stop Loss: 44,000
Target Price #1: 35,000
Target Price #2: 30,000
Target Price #3: 25,000
At each price target move stop loss to 10% over target value.
Reasoning:
First dip below 200-day EMA of the bull run. Sharp rejection possible.
Potential government intervention in US and China.
High volume selling along with increased volatility.
Risks:
Celebrity pumps can trigger tight stop losses on shorts.
Rapid bounce after first drop indicates strong buying power ready to deploy.
Bullish L2 news could cause rapid trend reversal to highs.

SNDL; the 200 EMA kissWe are about to "kiss" the daily 200 EMA line again with a familiar pattern leading into it as well.
Sellers have had a very successful run BUT still have not made a "lower-low" after SNDL's quick surge to ~$5
This may be the time for bears to finally make a new low, or it could mean it's to time take a page out SNDL's history book and blast off once more.
Let's see what happens!

FTM bullish bounce off the 200 moving averagehere you can clearly see it was a nice buy signal off the bounce on the 200ma on the hourly chart, bullish imo

Ridethemacro | $MRNA Buying Opportunity (near Term) Target $200Trade Analysis Based on Price Action & Fundamentals Analysis.
With Risk Management you Will Never loss
Thank you

GOLD200 DAY MOVING AVERAGE HAS BEEN THE KEY FOR GOLD FOR A LONG TIME. WE HAVE REACHED THAT AREA TO BUY BY DECEMBER 15 IT WILL HAVE ALREADY STARTED THE MOVE UPWARDS

BNB SHORT TERM SHORT POSSIBILITY. WEDGE BROKEN.BNB broke through the September – October wedge, as well as the MA200 on the 4H chart.
Most bullish scenario would be a quick bounce off the $26 area to continue its long-term bullish path.
In case it breaks through the $26 resistance, resistance 2 @ $22 and resistance 3 @ $18 are next. The latter being quite unlikely.
In case you’re looking for a short opportunity, take a look at the shorting zone around $27.5.
...................................................................................................................................................................
If you like this analysis, please like, subscribe and comment.
...................................................................................................................................................................

