The EURUSD Continues to WeakenLast post: May 24th. See chart .
Review: Price had established a bear trend below the daily 200sma and the round number 1.2000.
Update: Price has since weakened further but is approaching key support levels including the weekly 200sma.
Conclusion: Standing aside for now until support levels are confirmed as resistance levels and when we will look to place short trades.
Any comments or questions, do not hesitate to leave them below. Give us the thumbs up if you share our sentiments!
Sublime Trading
200sma

Bearish Bias on The GBPUSDLast post: April 22nd. See chart.
Review: Price had failed to break and close above January 2015 and the weekly 200sma resistance zone.
Update: Price is now trading below the daily 200sma suggesting an overall bearish market.
Conclusion: We will be looking for shorting opportunities if this weakness continues.
Any comments or questions, do not hesitate to leave them below. Give us the thumbs up if you share our sentiments!
Sublime Trading

CARDANO CRYTO STRATEGY - 5 ENTRIESStep #1: Cardano ADA price needs to trade above the 200-day moving average
The first condition that Cardano requires to satisfy is to trade above the 200-day moving average.
When price trades above the 200-day moving average we know we have a strong premise for a bullish trend to be put in place.
The more time Cardano price spends above the 200-day moving average and the biggest the distance between the Ada price and the 200-day moving average the stronger the trend is.
Step #2: Volume needs to be above average and twice as much volume compared with previous volume bars needs to come in
We need to look for instances when the volume bars are above the average volume (the red moving average). But this is not all; we also need the buying volume to be twice as much as previous volume bars.
In our Cardano chart we can note five instances where the volume was not just above average, but it was also double as the previous volume bars. In this case, we’re dealing with five possible buying levels.
Wait for trading situations where the buying volume is increasing considerably. This really shows institutional buying that has the power to move the Ada coin price.
Step #3: After volume has increased, buy at the opening of the next candle
When to buy Cardano ADA is quite intuitive if you have followed this cryptocurrency step-by-step guide.
The moment we see institutional buying presence we want to be sure we’re not left out. In this regard, after the volume has increased, we buy at the opening of the next candle preceding the big volume candle.
Usually, you’ll be buying right after the first bullish candle that often is the starting point of a new trend. Don’t be afraid to buy on the way up as this will pay handsomely in the long run.
Step #4: Place protective Stop Loss below the 200-day moving average
Hide your protective stop loss below the 200-day moving average.
A market that has a strong bullish trend should not drop below the most powerful moving average aka the 200-day moving average. By hiding your stop loss below the 200 moving average, we’re minimizing risk as much as possible.
Note* as the trend progresses you can also trail your stop loss below the 200-day MA.
Step #5: Take Profit when we break and close below the 200-day Moving Average
The 200-day moving average can serve us as a significant trigger for our exit strategy.
When we break below the 200 moving average, that’s the first sign that the trend is about to change the tide. When these happen make sure you take profits.
Note** the above was an example of a BUY trade using the Cardano trading strategy. Use the same rules for a SELL trade – but in reverse.

BITCOIN IS NEARING THE 2ND 'DEATH CROSS' ON THE CHARTS!This is what that means.
Bitcoin has fallen below $8,000 this month. The charts are showing something that has investors wondering if it is time to panic.
Bitcoin's chart shows price has experienced the first 'death cross' where the 50 sma crosses below the 100 sma. Now the 50 sma is approaching the 200 sma and it appears that the 50 sma may cross below the 200 sma also creating the second 'death cross'. This is used to illustrate when the 50 sma moves below the 200 sma – technicians often look at this pattern as a bearish sign of what's to come.
And in bitcoin's case, the 50 sma has already taken out the 100 sma, with the shorter-term trend line inching lower.
"When we are talking about bitcoin, I think it's important to remember that we don't have much history to go off of to identify long term trends," Jim Iuorio of TJM Institutional Services wrote to CNBC on Wednesday. "That being said, any time the 50-day crosses the 200-day, it should flash a warning…and when you couple that with the fact that bitcoin has been trending steadily lower since the launch of futures, I think that it is a major negative," he added.
But not everyone believes that a death cross marks more pain ahead for bitcoin. "Fast Money" trader Brian Kelly points out that he sees an uptrend in the chart of bitcoin that has been in play since August, and thinks that the same uptrend could actually be just as indicative of where bitcoin is headed.
"Bitcoin, just like the spot FX markets, follows technicals closely, therefore these support levels gain more importance," he wrote to CNBC. "If these levels hold, then it will confirm the uptrend from August is still valid."
The last time the death cross pattern occurred for bitcoin was in September 2015. After the death cross, bitcoin rallied close to $500 by early November that year from around $230.
Bitcoin has plunged about 38 percent year to date, but would still need to fall another 88 percent to erase all of the 2017 gains.
Quotes taken from Annie Pei article from Futures Now CNBC

1day chart closes 2 candles under the 200sma 1st time since 2014It looked as if there was a slight glimmer of a potential bull breakout from this current bear flag on the 4hour chart as the last 4 day candle found a way to close just above the trendline....however we all know that its not an official breakout until we close 1 more additionalc andle above the flag and at the same exact time that 4 hour candle closed above the bear flag trendline the 1 day chart just closed a 2nd confirmation candle below the 200sma for the first time since 2014....definitely not a food sifn...and any positive sentiment the 4hr candle gave buyers is likely to be outweighed by the sentiment the last 2 1 day candles are going to give sellers....Because of this I think probability is high that this next 4 hour candle will not close above the trendline thus invalidating any potential bull breakout from this recent smaller 4 hour bear flag. Further downside is what I anticipate.

EURAUD 1H FRACTAL BLASTER TRADING STRATEGYFractal Low Breakout level posted on chart
Waiting for a Bearish breakout of fractal low level
Bearish bias because
Price failed to break above 50 sma
Price failed to close above 20 sma
Sell Stop @ 1.5845
1st Take Profit @ 1.5805
2nd Take Profit at 200 sma
This trade is from our free pdf "FRACTAL BLASTER TRADING STRATEGY" PM me if you have any questions, I will be happy to help.


This is the dip you said you would buyWhile the overall markets are still full of uncertainty and fear over hawkish moves from the Fed remember that markets don't always go up.
This is the dip you said you would get into stocks on.
So many S&P giants trading at the 200 day SMA. I bet this will look like an amazing entry in 6 months from now.
We all know AAPL is a big player and unless the markets turn to recession or iPhones start exploding lava I'm going to say they will continue up and to the right.
Ray Dalio just posed a few pieces about his market thoughts, he knows what hes talking about.
The SPX DJI and IXIC are looking as of now like the bulls are winning.
But who knows.. maybe the Algos go crazy and we drop another 1000 Points.
Nun the less AAPL at the 200 seems like a steal to me.
...not a huge fan of the homepod tho... fucken Apple and their proprietary BS.

Bitcoin support at 50, 100, 200 Day Moving Averages(DMA) in 2017As we can see, the 50, 100, and 200 day moving averages were solid support points throughout 2017. Once Bitcoin touches the 200 day moving average (at a rate of less than once per year) historically it rebounds very, very strongly.
Edit: Made a typo. The orange text description should say "50 day moving average". Sorry!

BTC Bounce? A short analysis with entry pointsBitcoin following the downward trend, I've highlighted entry points that I personally have put orders in, the correspond with resistance zones circled previously. The downward trend broke through the 100-day Moving average in a big way but seems to have bounced near the 200-day MA (purple). We will see whether this is the bottom bounce or whether we will continue to fall further... I'm currently neutral, it could drop lower but I still have more fiat to put in if that's the case. If it bounces and recovers - great!

$BTC.X D1 Technical AnalysisSELL Zone below 13000$ (Target ~6900-7500$). Simple Moving Averages (50 & 200) #btcusd

XLM - possible Golden Cross! 50SMA may cross 200SMA this time...What are your thoughts?
If you have recommendations or tips - please, let me know below at the comment section.
/Pat

Golden Cross - Bullish ISATL (Inmarsat)How long will the bullish trend last? I wouldn't have sold as early as I did, if I knew about the "Golden Cross". I just recently learned about it. :-)
A Golden Cross occurs when the faster moving average (50day) goes above the slower moving average (200day), which is a good indicator to enter a long trade. A bullish Golden Cross (or Death Cross) is the opposite when a slower moving average (200day) goes below the faster moving average (50day), which is a good indicator to exit the trade.
Any recommendations or tips on how to determine a good entry point with a moving average?
Thanks,
Pat

BTC/USDT - Correction incomingIn the hourly chart, we can see various elements that support the price is going to correct:
1) BTC hit a new high at around 17480$ today, not much higher than the one it hit on December 8th, this could result in a double top formation.
2) The failure to make a new ATH in a strong way created a divergence in the MACD, showing losing bullish momentum.
3) The 200 periods SMA, which has served as support in various occasions in the past, has been prolonged (in the most sensible way I could find) and it touches the 50% Fib. retracement in a critical point, around 15000$. Why is that level important?
Because it is a "big even", a round, psychologically relevant number. Because it is where the 200 SMA and the 50% Fib retracement intersect (as stated above). Because the last BTC correction followed a downward angle of 48°, and, if it happened again, it would again hit that critical 15k.
This is why I believe the price will go there. It might fall more, but I think there is just too much support, both technically and fundamentally, right now.
Shorting BTC at this time of history is dangerous, of course, so a stop loss order should be placed just above the most recent high, around the 17550$ level.
I am not a financial advisor, this is just my personal opinion. Any comment is appreciated.

Hits target and turns In my previous analysis I described the bullish scenario that Oil will rally from the bottom of the channel to its top.
Now that Oil did hit the top of the channel, as projected, it is time to think about bearish trades.
In fact, those of you who have read my weekly newsletter could have seen the potential Sell Zone I've mentioned few weeks ago.
Today, Oil confirmed that 58-60$ was indeed a resistance zone
Oil is testing the Fast MA line as support but is seems like we should focus on bearish trade in the near-mid term future.

50 months MA line and a daily Cypher in focus DXY broke and closed below its 200 weeks MA line last week.
The holiday trading week (low volume) helped the sellers to push the Dollar beyond this important support line.
Now the next line of defense for DXY is the monthly 50 SMA line and the bottom of the structure zone (weekly) that you see in the chart.
The Cypher pattern and the 61.8 Fib level can be used as two potential entry zones for those who still hasn't lost faith in the Dollar's ability to rise!
Yellen testimony and U.S GDP in focus.
Read more about the Dollar, EURUSD and Stocks in this week's newsletter - #WeeklyMarketsAnalysis (search for it on Twitter)

Short term buying opportunity towards Black Friday? EBAY is testing support as we approach Black Friday and Cyber Monday.
The shopping spree expected can boost EBAY following its recent decline and send it back towards the bottom of the rising triangle, to test it as resistance.
Read more about EBAY, SPY, DAX, FTSE, DXY Gold and more in this week's newsletter
#WeeklyMarketsAnalysis in Twitter

Head and Shoulders pattern - Neckline being tested AUDCHF testing critical level
Daily Head and Shoulders in focus

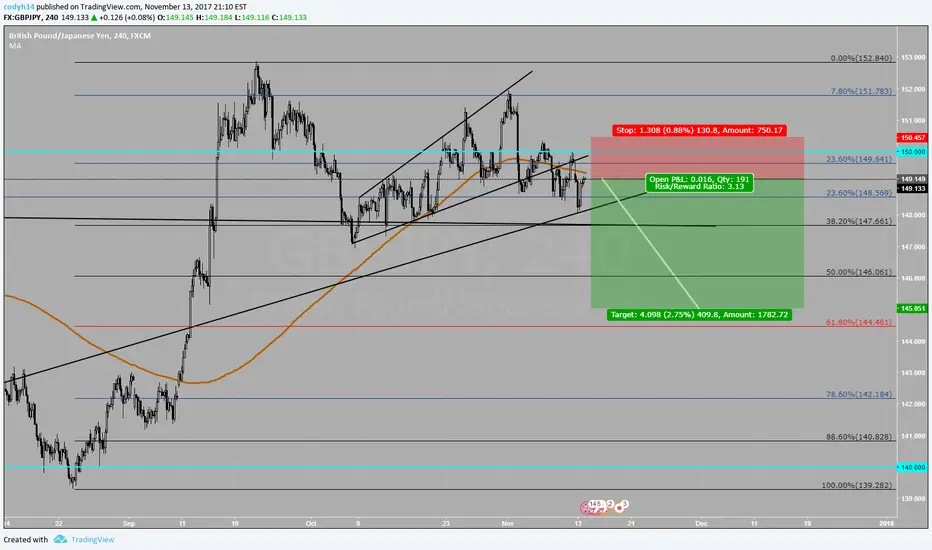
USD/CHF Swissy longer term short play off 200dmaWe got a lovely rejection wick off the daily on Friday and it beautifully bounced off the 200dma and a falling trend line. Great bit of confluence. Stops above that wick and shoot for a 50% retrace on that type of move the 50 back gives us a RR ratio of 3.5-1. Might even get down to previous lows if wanted to stretch for longer targets but don't be greedy.

$LTRPA longconsumer goods company- crossed 200DMA on above average volume and also hit a 75 day high


