LTCUSD : Sipping With Cup And HandleWhile Bitcoin is about to surpass $10K USD making history soon before 2017 ends, all the other major altcoins too are on the move to making new highs. On the other hand Litecoin (LTC) is already on the trajectory to reach $100 USD as the price is forming the Handle of the "Cup and Handle" chart pattern currently with Fibonacci retracement levels before making the all time new high.
2017

XMR AND IT´S FIRST TARGET REACHED, GOES FOR MORE
While I'm being quite conservative with Monero's forecast, for now it's behaving that way.
With the difference that a few days ago he broke a very strong resistance that came from the past and became the XMR that we all want.
From a healthy behavior, I continued in bull trend and according to my point of view XMR should be worth much more.
Thanks as always to all, to the followers, messages and likes!

2017 - OCTOBER RESULTSDear traders,
Here is the usual report for previous month. After fabulous september month, we had a Okay-ish month in October with a small growth of 2% or a few hundreds pips.
Best of luck for November!
OTK Trade
EURGBP +21 pips / +0.13% (follow-up of september)
USDCHF +85 pips / +1.74% (follow-up of september)
AUDNZD +93 pips / +1.79%
COUBERTAIN Trade
CADJPY 0 / 0 (follow-up of september)
PALLADIUM 0 / 0 (follow-up of september)
EURJPY +27 pips / +0.37%
FAIL Trade
EURCHF -179 pips / -1%
AUDCAD -57 pips / -1%
EURCAD -63 pips / -1%
AUDJPY -40 pips / -1%
EURNZD -265
ON-GOING Trade
EURUSD
WHEAT
AUDUSD
EURAUD
CADJPY
CADNZD
SILVER
GBPCAD
EURCAD
USDCAD
NGAS

EURUSD Small Term Upwards Correction (First Published Idea!)If correct, we should expect a slight bullish correction. However, Fed Rate Interest decision will define if we'll have a bearish or bullish trend over the next months.
I'm adopting the Elliot Wave Theory for these initial series of ideas, mixing eventually with future Fibonacci retracements that will indicate the entry point of each trade.

EURUSD - Prepares for Fall > 1.1380EURUSD - Trade Analysis > Month of October, 2017
Updated: Trade Analysis > EURUSD
Timeframe: 3W
Expecting uptrend to continue toward 1.1870 / 1.1950 levels with test of 1.2030/37 resistance possibility.
Strong reversal expected which could lead to low target @ 1.1380 levels.
Overall monthly average high range expected to hold between 1.1870 / 1.1950 levels
Average High @ 1.1810
Average Low @ 1.1380
Anticipated October closing price @ 1.1550
Updates / Adjustments will be reflected in comments.
* Personal analysis only. Please use your own rules and strategies prior to entering market.
** Forex trading involves HIGH RISK.
Before entering a trade, carefully consider your objectives, financial resources and level of experience.


USDJPY - Prepares for RISE > 116.36USDJPY - Trade Analysis > Month of October, 2017
Updated: Trade Analysis > USDJPY
Timeframe: 3W
Expecting downtrend to continue toward 112.43 / 111.80 levels.
Strong reversal expected which could lead to high target @ 116.36 level.
Overall monthly average high range expected to hold between 112.43 > 116.36 levels.
Average High @ 116.36
Average Low @ 112.43
Anticipated October closing price @ 114.64
Updates / Adjustments will be reflected in comments.
* Personal analysis only. Please use your own rules and strategies prior to entering market.
** Forex trading involves HIGH RISK.
Before entering a trade, carefully consider your objectives, financial resources and level of experience.

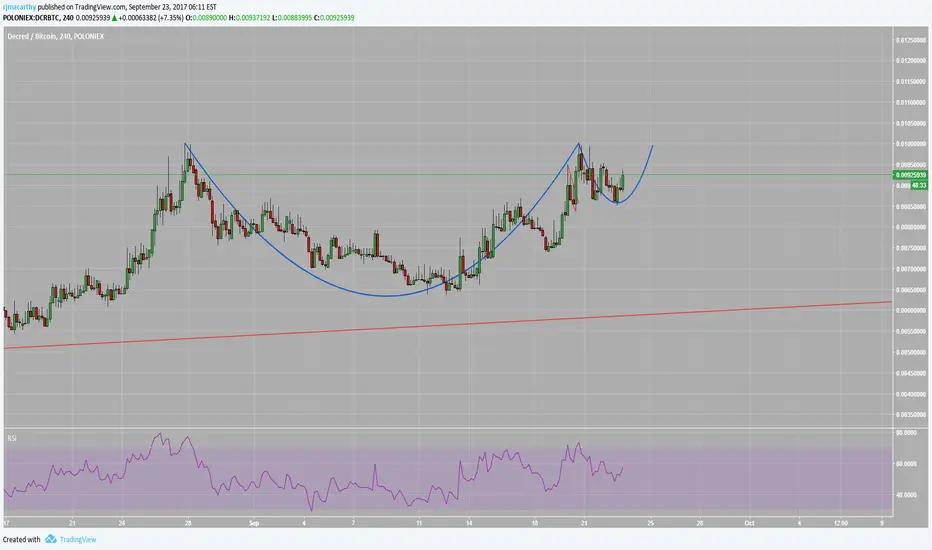
A nice hot cup of DCR - Long hold through Q4 2017DCR loves cup and handle pattern.
Watch this closely, next target 0.0125.
On non technical note - check roadmap and latest blog posts. DCR is ahead of the curve in many ways. A long hold through Q4 2017 will show great returns on this coin.
blog.decred.org
BTC TORO/BTC FINALLY BULLISH!As I indicated on the last chart, there is a white line by which the bitcoin tried to break without success, and coincidentally that levels were accurate FIBO levels (you can see by plotting the Fibonacci retracement levels through the arcs and their respective resistances)
Then he was subjected to the strongest levels of resistance so far (3.8 / 4.2), attempting immense opportunities giving symptoms that strength and intention followed, such as the King has accustomed us for this time of year.
Trying to avoid those levels of resistance, the trend first changed, which bull takes career and definitely broke firmly the white line, leaving behind bad memories.
Under my humble point of view, I believe (technically) that the levels below the 4k were already forgotten.
Now the BTC has more ambitious challenges, as well as fundamentals that it had to endure in a stoic way.
For believers, the bull run definitely started, a bullish and green time comes.
PATIENCE is the basis of timing, of not rushing, that everything returns in the long run and that the worst decisions are made in those moments of uncertainty.
Thanks as always for the likes, followers and for enjoying something, like me to what we call trading!

USDJPY 4th Qtr. Range AnalysisUSDJPY Range Analysis for 2017 4th Qtr.
High @ 114.40
Low @ 105.52
* Personal analysis only. Please use your own rules and strategies prior to entering market.
** Forex trading involves HIGH RISK.
Before entering a trade, carefully consider your objectives, financial resources and level of experience.

Bitcoin course until september 30th 2017The trend seems to be going down. Possible causes are SegWith2x and the closing exchanges in China on 30th september..


BTC - 2014 vs 2017 crisis (price movement)Looks like we have a similar situation in cryptos that the one at the end of 2013/start of 2014 "China crisis".
If we learn from the historical price movement, future movement in 2017 should be similar to the one shown on my graph.
After last bounce bear market is expected for probably more than 1 year after we reached the top.
There are more reasons to believe we have reached the top with 5000.
One of them can be found in related ideas.
This time I hope I am wrong. :/

Bitcoin predictionNew iteration. After a new high price drops to the previous high to start over. Every new high is ~5x the previous one.

BTC UPDATE / CRYPTOWORLD IS UNDER MEDIA ATTACKTo the management of the media, powerful and influential people, opinion formers and all those who are directly and undecidedly involved, we tell them that the more they hit us, the stronger we become.
I hope that my words will make echo in your charts.
Together we can against everything.

THE FIFTH WAVE HAS ENDED? I DO NOT THINK SO. BTC DESTINY.First I do not believe in my humble opinion that the Elliots waves works on cryptos.They are very complex to locate and synchronize. The margin of error is zero.
On the chart we see that after reaching the historical ATH, the price broke the main trend line (TL1) and tried to retest the ATH and found its Stop on the HH1.
I formed a new trend line (TL2) joining the critical and relevant points and the price was of HH1 to make a pullback in LL1.
It tried again and broke its trend at the same level as HH1. I named them HH2 to identify the pattern.
Again made a drop and ended up doing a new pullback in LL2 perfectly on TL2.
At this moment he is heading towards the HH3 and there can happen two things (no, it is not the Nike pipe)
You can make the recoil without reaching the HH3 or arriving definitively.
Here comes the moment of the greatest and last setback of the previous 3 months.
Two scenarios:
0.382 FIB USD 3.7 / 3.8K and continue with the bull run to far surpass the 5.2 K
0.618 FIB USD 3.1 / 3.2K + bull run.
Sorry but in my previous charts I was erratic, maybe for lack of practice, but I take care of my mistakes and I apologize.
Thank you as always to everyone!

potential good long trade opportunity in this chart , looking forward to a reversal in the crude oil market . with potential target up to 48.50


A simple high probability setup (R/R: 5.5+)This is an attempt to use Andrews A/R techniques (reverse pitchforks or median lines) with a horizontal structural stop. The next green parallel is used as a runaway target.


BTC up up up?It looks like BTC is deaf and blind; it is not paying attention to what is going on out there, nothing about China, North Korea, USA...well, this is its first test when geopolitical issues are not in good shape...IMO
