2018

2018 Fractal doesnt allow 21kSeems theres some people expecting current PA to hit 21k while copying 2018 before the final drop.
Lets take a look at the fib levels and we can see, yes, there is some same pattern going on following 0.382, 0.618, 0.768 fibs.
If that fractal would be in play, next station is a dive below 0.886 and no coming back once below.
Timewise a drop would occure ~10% before the apex, either all the time since the low or first high this would give 28th of oct - 3rd of nov
However a break about the downtrend would be a clear invalidation of this fractal
Lets see what happens
Hold my beer pls
----
No financial advice, do your own research, don't be stupid

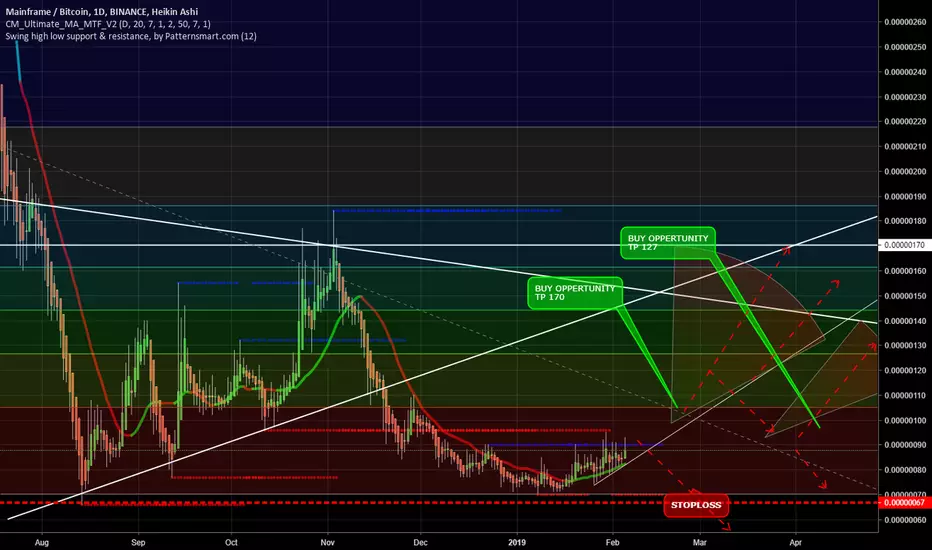
Descending triangleLook in 2018, support was tested many time and has been broken...
So, we could to expect the same thing here.

A Hellish Pattern (BTC 2018) For anyone that experienced this pattern that is extremely similar to a structure formed on BTC during late 2018 you know what I mean.
This is a replica of the formation.

2018.HKEX_Bearish Breakdown Trade_ShortENTRY: 13.68
SL: 15.16
TP: 11.18
- ADX>25
- Daily RS -ve
- Daily FFI -ve
- Weekly RS -ve
- Weekly FFI +ve
- Moving averages are aligned.
- Stoch RSI near 70 and dipping down.
- Entry based on today breakdown from range and >3% rebound off 10EMA with volume.
- Need to watch out for earning results which is approaching

Rejected again from descending triangle, like 2019 and 2018. Neutral. I just see a possible scenario. I hope we break the trend line and move to 72k.
It's still early too say, but we still not break any resistance yet.
I just think this choppiness is to completely kill leveraged traders from both sides before the take the plunge to 19k.

2018 chart BtC bear Just posting for reference to the current market and weekly rejection on the weekly ribbon


ETH probably --History repeats itself--2017-2024Probably the same scenario as 2017/2018 will be repeated

Bitcoin Analyze ⚔️2018 VS 2021⚔️Hi, I have come back again with another Competition , please pay attention to my chart ( BTCUSDT-2018-2021 ) and answer me, first , How many Similarities do you see in my chart? If you answer true, I will send you Airdrops 😂.
Second , Do you agree with me or not !? 🙏
For more info, Please visit my post 👉https://www.tradingview.com/chart/BTCUSDT/vcNphXFB-Bitcoin-Analyze-Descending-Channels-Gartley-Patterns/
Do not forget to put Stop loss for your positions (For every position you want to open).
Please follow your strategy , this is just my idea, and I will be glad to see your ideas in this post.
Please do not forget the ✅ ' like' ✅ button 🙏😊 & Share it with your friends, Thanks, and Trade safe.

Elliott Wave Analysis: SP500 Is Nearing 2018 Highs In Gold PriceHello traders and investors!
Today we will talk about stocks, specifically S&500 against GOLD (SPX/GOLD ratio chart), in which we see an interesting development we want to share.
As you can see, stocks remain in the strong uptrend and there can be room for more gains, we just have to be aware of another, higher degree correction as S&P500 is approaching 2018 highs in gold price, clearly for the 5th wave. We know that after every five waves, a three-wave correction follows, so be aware of limited gains on stocks, while GOLD may find the support soon.
Of course, it's a weekly chart and there's still room for slightly higher levels to break into 2018 highs, so it may take some time before we will see a change in the trend, ideally till the end of summer.
Be humble and trade smart!
If you like what we do, then please like and share our idea!
Disclosure: Please be informed that information we provide is NOT a trading recommendation or investment advice. All of our work is for educational purposes only.


BTCUSD: If Bitcoin Repeats History? Monthly TD Sequential Red 1Part 6: With the month of September coming to close in the coming days on a Monthly TD Sequential Red 1 price flip, October will be critical as to whether Bitcoin's monthly candle will close as a green 1 to break the sequential correction, or continue with another 6-8 red candles - as has happened in 2014 and 2018 during bear markets. Note that the Monthly Red 1 candles immediately preceding ATH have been excluded, as previously only have led to a 1-4 candle correction.
As intriguing is that 4 years have now passed since Bitcoin's 2014 Monthly Red 1 candle that led to the 2016-2017 bull market. Additionally, the monthly RSI has broken down from 60 (bullish) to neutral territory, indicating scope for a 7-9 candle correction.
If Bitcoin Repeats History?
Part 1: Descending Triangle Looking Similar
Part 2: Measuring The Move of the Descending Triangle Breakdown
Part 3: A repeat of 2014? Worst Case Scenario A $2,500 Low
Part 4: Extrapolating 2012 Descending Triangle Breakdown
Part 5: If 2017 Descending Triangle Repeats? Best Case Scenario

BTC very long term A project I made few months ago, as we are going by blue parabolic line so i decided to upload this idea, maybe someone will learn something or see something that I or others don't


If Bitcoin Repeats History? Descending Triangle Looking SimilarThe daily bars of the 2018 descending triangle are starting to match the current 2019 descending triangle. If the bearish breakdown also repeats itself in the same way, then this would be the outcome, continuing on from where the charts fit together. Notice how a similar bearish breakdown would take us to the 200 Week MA, given its current trajectory. This would be long-term bullish if this happened, ie finding support again one year later $2K higher. I'd therefore find it unlikely to return to a bear market, or even continued consolidation (which would both be under the 200 Week MA).

Bitcoin Dollar BTC USD UpdateAt first I was afraid, I was petrified
Kept thinking I could never buy some shitcoins on the side
And yet I spent so much money thinking when it will go wrong
But It grew strong, And I learned how to stay long
And now They're back, it's FOMO's race
I just walked in to find everyone with a bull-mask on their face
Should I have flipped that stupid bagg, Should I have trade that stupid coin
If I'd known for just one second this FUD is back to haunt me
Go on now, go, walk out the door, Just turn your alts now
They're not welcome anymore
Weren't you the one who tried to dump me with pumped buys
Do you think I'd crumble
Did you think I'd lay down and die?
Oh no, not I, I will survive
Oh, as long as I know how to hodl, I know I'll stay alive
I've got all my life to live
and i got all these coins to spend, so, I'll survive
I will survive, hey, hey,

NEWGOLD INC NGD JANUARY 2019 LONG STOCK PRICE TARGETA PICTURE IS WORTH A THOUSAND WORDS
AMEX:NGD TSX:NGD

2013 bull run VS 2017 Bull run Hi
This Chart shows that we retraced all the way to the .786 fib level and it acted as resistance for roughly 224 days till it finalized its double bottom touch.
I believe the current pattern for the next 224 days will go as followed.
the .618 fib will be temp support for smaller moves till we touch the .786 for the last time just like 2013 did .
if we break these levels we will have to rethink the future as a whole for BTC

USDJPY, start of bull for week 1, 2019USDJPY has made a very predictable and good price movement. Anyone who has shorted it since week 50, would have ended with very good profit! I personally shorted but did not hold it all the way as I mainly day trade, so I got a couple of drop while USDJPY was on its way down.
So what can we expect for 2019, week 1? From my analysis, the bear movement of USDJPY should have ended, and a new bull trend on 1H should be coming up. I would expect perhaps week 1 or week 2 of 2019 to make bullish movement, to perhaps finish off the 3 bullish level, and they can continue on to bear and back to bull. Some traders have asked me how long can the trend last?
My answer: as long as it last. Even though counting the zones and levels have been fairly accurate to give us an overview of the price movement, this type of analysis does not provide an estimate of how many pips it will go. It is based on price movement and price patterns. Trying to estimate the extent of pips movement is not a strength of my trend analysis. However, from the price movements, we can usually infer how strong the current trend is. For USDJPPY, the bear trend that was showing itself in the H1 chart is quite strong, giving very little space for range movement in the respective zones, it went straight down with no hesitation. so it might take a while for the bull trend to commence because it takes time for traders to accept or to change their positions from bear to bull. That being said, I am in the view that week 1 of 2019 will bring the prices up, at least break up to a bullish level 2 trend.
Keep an open mind and be flexible if there is a need to change your positions. That will keep us profitable for the many years to come.
If you have any thoughts on USDJPY's movement for the coming weeks, please share them below, I look forward to learning and staying profitable together. Please help me like this analysis, and follow me for my weekly updates!

GBPUSD, moving from 2018 to 2019GBPUSD did not move a lot in week 52 of 2018, it did break upwards to a bullish level 3 zone, however, it wasn't by a lot. Anyone who entered long in this pair would have stayed in the green, however, it might not hit the expectations of many traders.
Most of the movement was spent in the range of the level 3 zone. The price movement doesn't seem convinced that it will continue to head upwards, and a reversal pattern was spotted in the level 3 zone, which hinted that the following week 1 of 2019, we might see a new bearish trend. The break from bullish level 1 to level 2 and top level 3 wasn't too fantastic. Each break upwards is just marginally higher than the previous. This did not give me confidence on the upward strength of GBPUSD.
On the other hand, GBPUSD hinted that the coming bearish trend will be as strong as the second top of the double top pattern in level 3 zone failed to reach the same high as the first top. I will be building contract short contracts and expecting a drop for week 1 of 2019.
However, lets stay flexible and open to market development and trade in the direction of the market, so we can all stay profitable in 2019!
If you have any thoughts on GBPUSD's movement for the coming weeks, please share them below, I look forward to learning and staying profitable together. Please help me like this analysis, and follow me for my weekly updates!
