Bitcoin - Back Inside The Range? 📦Hello TradingView Family / Fellow Traders,
📌 on Weekly: Left Chart
As per my last analysis, BTC is still hovering around the 38,000 - 40,000 resistance zone.
🏹 To sustain bullish control and assert dominance from a macro perspective, a crucial requirement is a weekly candle close above 40,000. Such a development would likely lead to a parabolic movement, aiming for the 50,000 resistance level.
📌 on H4: Left Chart
Meanwhile, considering BTC's proximity to a resistance zone, there remains a possibility of bearish intervention, potentially pushing it back into a range reminiscent of the 30,000 to 32,000 range.
📉 To trigger the bearish scenario, a break below the last significant low in red at 35,670 is required.
📚 Always follow your trading plan regarding entry, risk management, and trade management.
Good luck!
All Strategies Are Good; If Managed Properly!
~Richard Nasr
2024

BTC/USDT - Markets are GREEDYWith markets being greedy and prices being overbought, we are not seeing much bullish movement here (at least not for long). We are still seeing signs of turnover; the only question is, when?
As the surge of the $40K zone is increasing and it is acting almost like a magnet, there is a chance of having a shorts squeeze near this zone, but as soon as we reach it, we are seeing a really nice drop to come after that.
Swallow Team

EURUSD Outlook 2023/2024
The FOREXCOM:EURUSD has been mitigating the price zone of 1.12147 and 1.17122 since 2015, and had a rejection move from the zone on July.
On the 1W Time Frame:
1. Price did a change of character
2. Price tapped the 0.618 premium zone
There are 3 things that can happen
1. Price rejects the premium zone and pushes down
2. Price enters a more premium zone, then pushes down
3. Price breaks the structure high and pushes up
This is the overall outlook for FOREXCOM:EURUSD , check out some trading ideas that I have on my profile.

When to sell MRF (Madras Rubber Factory)Namaste!
MRF is the biggest valued stock (INR) in India. It's price is around half the nominal GDP per capita (2022) of India.
It seems overvalued to me. You see, retail individuals cause the volatility (rapidly falling prices). Retail individuals react overwhelmingly and quickly to emotions and they cause the volatility (rapidly falling prices). But due to insanely INR price of MRF, it surely has kept away retail people. This costly stock would have been mostly attracted sensible big pocket individuals and financial institutions.
But now I think it is a good time to book profits in MRF Ltd (at Rs 1,10,000). Following are the reasons:
1. Most of the worlds' central banks increased interest rates at very fast pace. RBI didn't increase as rapidly because they wanted growth. Many companies reported record profits due to cheap credit in India.
2. RBI increasing rates in the year 2024: You see, GDP growth was an important factor to the current ruling party because history has taught that the government which didn't increased GDP growth figures during their ruling tenure, has lost the following elections in India. So, it has been greatly paid attention to increase GDP growth percentage, of course at the cost of inflation .
3. Coming recession in the year 2024 (personal assumption) .
4. Slight uncertainty in the economy due to 2024 election.
5. India got a good hype due to moving production from China to India. It caused the Indian stock market (Nifty50) to not fall as much as their global peers . I wouldn't say it isn't possible, but it would take longer time period than the market is pricing in.
6. My bearish instinct .
I do not own and/or planning to own any shares or position in the stock.
Disclaimer: This article should not be considered as an investment or trading advice. The analysis is based on my understanding and experience in the markets. You must do your own analysis and/or consult your financial advisor before investing or trading.

S&P closes low, but is this the end to it?Stock Market Update: S&P Shows Low Movement, But Advancements Expected
The $S&P500 index exhibited low movement today, initially dipping -0.20% but quickly regaining ground to close with a slight negative of -0.1%.
The market's resilience in maintaining and even advancing current price levels is surprising.
In the short term (1-2 months), there's a higher probability of further advancement towards the 4553-4570 range, provided support is held above the daily resistance level of 4523.
NASDAQ:NVDA Nvidia's strong earnings report, released after market close, reinforces the likelihood of an upward move. Nvidia, along with Tesla, collectively accounts for nearly 70% of the S&P's daily trading volume.
The recent slump in the Wholesale industry may discourage investors with a 3+ month investment horizon. However, for shorter-term investors (1-2 months), the upcoming Black Friday and Holiday season could lead to unexpectedly strong performance from other retail companies.

Quantitative Tightening Effects on the Markets This video tutorial discussion:
• What is QE and QT?
• Each impact to the stock market
• The latest QT, how will the stock market into 2024?
Dow Jones Futures & Its Minimum Fluctuation
E-mini Dow Jones Futures
1.0 index point = $5.00
Code: YM
Micro E-mini Dow Jones Futures
1.0 index point = $0.50
Code: MYM
Disclaimer:
• What presented here is not a recommendation, please consult your licensed broker.
• Our mission is to create lateral thinking skills for every investor and trader, knowing when to take a calculated risk with market uncertainty and a bolder risk when opportunity arises.
CME Real-time Market Data help identify trading set-ups in real-time and express my market views. If you have futures in your trading portfolio, you can check out on CME Group data plans available that suit your trading needs www.tradingview.com

BTC - Macro View 🌐Hello TradingView Family / Fellow Traders,
📈 Following the rejection of the 25,000 support, BTC experienced a significant 50% surge , forming another bullish impulse that confirms the ongoing upward trend.
Consequently, we've identified and outlined a rising channel in orange.
BTC is currently approaching the upper boundary of the orange channel, coinciding with the 40,000 resistance zone.
🏹 To sustain bullish control and assert dominance from a macro perspective, a crucial requirement is a weekly candle close above 40,000. Such a development would likely lead to a parabolic movement, aiming for the 50,000 resistance level.
📉 Meanwhile , considering BTC's proximity to a formidable resistance zone, there remains a possibility of bearish intervention, potentially pushing it back into a range reminiscent of the 25,000 to 30,000 range.
This scenario's confirmation would depend on lower timeframes, especially if a bearish reversal setup is triggered.
📚 Always follow your trading plan regarding entry, risk management, and trade management.
Good luck!
All Strategies Are Good; If Managed Properly!
~Richard Nasr

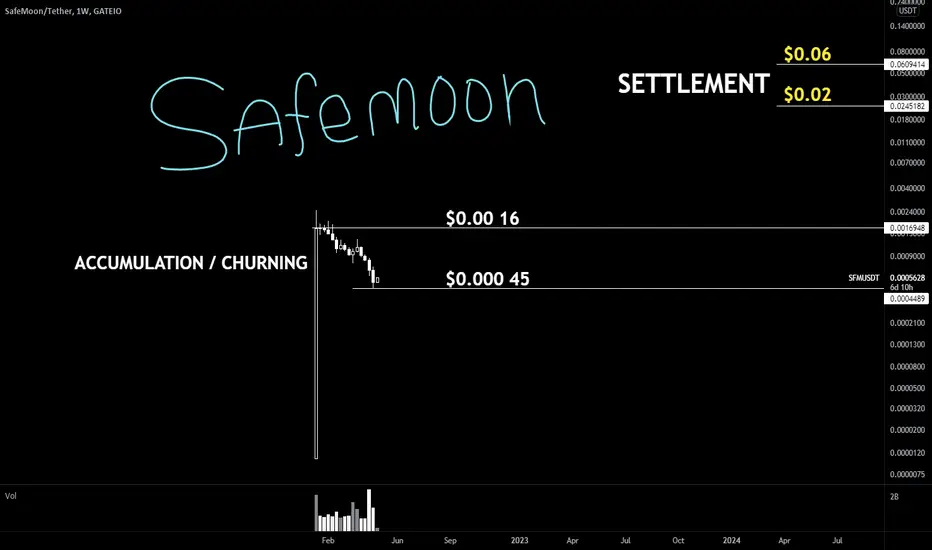
SAFEMOON: $0.000 55 | The Most Hated Coin Yet Adored by Few Reminds me of FANTOM at $0.02 shakedown to $0.002
then afte few months it pumped to $0.28 and a year later Dubai Royal Arabs mooned it to Financial Freedom to $3.0
just move one decimal to the left that would be $0.028 and $0.30 cents for SAFEMOON
Vegas Fund and Food Security with efficient energy sounds like a plan
in addition with all directions of hate should fuel interest over time
banker just needs to discredit the majority and GAP it Up to $0.01
care of Big Fish or ANGEL White Knights etc..
FNGD retrace to $8.50 before target of $10.51, coil/fakeout/pumpFNGD to go back down to $8.50 before target of $10.51 Nxt
I'm expecting a little retracement back to $8.51 with buy limits set from 8.88 down to 8.51
Take Profits at $10.17 and $10.51
Expect to retrace again and coil up. People will be talking about bears taking over, but the Santa rally will cheer bulls up and give them hope... meanwhile we are playing both sides.
Into 2024:
Due to everything going on and how much this market has tripped everyone up and out, I expect a double fakey to occur. FNGD will appear to be pumping (bears winning on FNGU and S&P) then the bulls will appear to take control and the descending triangle on the S&P will appear to have a breakout to the upside only to fail.
People will say its due to a news event, but the Operator/Fed is planning this. Equities will retreat to safety of Bonds. S&P will Fall, and lay off employees, people will beg for the Fed to cut rates and when they do Bonds will explode then Gold then after Equities and Crypto Capitulation we will rebuild on the scorched earth.
BUY BUY BUY WHEN THERE IS BLOOD IN THE STREETS IN MARCH/APRIL 2024!

NIFTY Market CAP trend forecast until JULY 2024 Current bear market will continue until the end of February 2024.
During 2023 possible growth of NIFTY will occur starting mid of November until December in the range between 9327-9650. In December NIFTY will start falling from the area of 9650 down to 8800 (possible extreme bottom of 8653) in the beginning of January 2024. January-February 2024 is the perfect time to buy NIFTY Stocks.
End of February 2024 will mark major bullrun in NIFTY until the end of July 2024 in the range of 9327-10609.
Possible sideways-upside movement might occur between May and July 2024.

bearish retest of top rangeThings are moving fast. Too fast.
The last time things moved this fast was before a big blowout.
Looking to get in to a 1x short over the next weeks depending on how chart looks.
Maybe we see a wick up on the next monthly candle and then retrace?
Good luck everyone, good luck to the people who are buying this to hold for longer. It's not back sorry this is not how bull markets start or are being made, .. this is the first lower high and everyone who is still holding this ponzi or still desperate enough to trade this day by day and follow altponzis gets exited.
If youre in a rush to make money youre in a rush to lose money.
patient.

Altcoin death scenario for 2024 - XVGUSDHello guys,
is there anything which would make this count invalid?
- I mean, we all know that most alts will die one day tragically, i assume it to be a silent slow death to have as much as possible people suffer from it... ?! Is this a possible scenario?
Thanks for your feedback, have a nice day!

Others 1W (Crypto Total Market Cap) until end of 2023Sideways until the end of November between 101B and 124B. In December Others Market Cap may jump up to 137B - (false)breakout? Followed by (probably unsuccessful) retest in the second half of December (end of January 2024) falling down to 124B or even lower to 106B.
To be updated in January 2024...

BNB/USDT Support ZonesBNB has had a strong Bearish pennant formation on the daily and 4hr candles. Price is expected to pull down to either 2 zones of 187 & 118 respectively. Monthly support zones is market at 187 where price had strong bullish upside momentum. Expected to further be in a sideways market trending until 2024.

Low Volatility Clue to Upcoming Growth 📉🚀🔍 The Quiet Before the Surge: Imagine the market as a serene pond, not a ripple in sight. That's low volatility, my friend! But here's the juicy part: it's like the market is catching its breath before leaping into action.
🚀 Springboard to Momentum: Low volatility? Think of it as the trampoline for a potential price leap. The calm is like the calm before a concert – the band's tuning up, and the audience is in for a treat. In the crypto world, that treat might just be a price rally.
💡The Precursor to Uptrend: When the market's rocking low volatility, it's like a hush before the storm – a storm of bullish action, that is. Keep your eyes peeled because this serene moment often precedes an upward price movement.
🚴♂️Traders' Playground: Traders love these tranquil spells. They're like pit stops during a race, a chance to strategize and gear up for what's next. A little breather, a lot of potential.
So, what's the low-volatility takeaway? 🌌 It's not just a downtime; it's a heads-up for traders and investors. The calm might just be the quiet you need to brace yourself for a burst of excitement.
Stay curious, watch the charts, and get ready for the market's next groove! 📊🎉
❗See related ideas below❗
Follow + Like this post and leave a nice comment, it will allow me to move faster and make more useful content! 💚💚💚

Impact of Cryptocurrency Market Capitalization on Market DynamicIn the world of cryptocurrency, staying informed about market trends and indicators is essential for making informed trading decisions. One crucial metric that often goes hand-in-hand with market sentiment is the overall cryptocurrency market capitalization. This article delves into why keeping an eye on the cryptocurrency market capitalization is crucial and how it can provide insights into the broader market situation.
Understanding Cryptocurrency Market Capitalization:
Market capitalization refers to the total value of a cryptocurrency or the entire cryptocurrency market. It's calculated by multiplying the current price of a cryptocurrency by its circulating supply. Monitoring the market capitalization provides a snapshot of the market's size and valuation at any given time.
The Impact on Market Dynamics:
Keeping track of cryptocurrency market capitalization can offer valuable insights into market dynamics and trends. Here's why it matters:
Market Sentiment Indicator: Changes in market capitalization can reflect shifts in investor sentiment. Rapid increases may indicate bullish enthusiasm, while significant declines might signify market apprehension.
Market Trends Identification: Monitoring market capitalization over time can help identify trends such as bull markets, bear markets, and periods of consolidation. It offers a broader context for analyzing price movements.
Relative Comparison: Comparing the market capitalization of different cryptocurrencies allows traders to assess their relative performance. It helps in identifying potential investment opportunities.
Impact of Market Events: Major news, regulatory developments, or technological advancements can influence overall market capitalization. Tracking these changes can provide insights into market reactions.
Market Liquidity: Market capitalization can also give an indication of the overall liquidity of the cryptocurrency market. Higher market capitalization often implies higher trading volumes and increased market activity.
Conclusion:
Monitoring the cryptocurrency market capitalization is an essential practice for traders and investors seeking a comprehensive understanding of the market's dynamics. It serves as a key indicator of sentiment, trends, and the broader market situation. Combining insights from market capitalization with technical analysis, fundamental research, and other indicators can enhance your decision-making process.
As the cryptocurrency market continues to evolve, adapt your strategies to account for changing market conditions. Remember that market capitalization is just one piece of the puzzle, and a holistic approach that considers multiple factors is crucial for successful trading in this dynamic landscape.
❗See related ideas below❗
Follow + Like this post and leave a nice comment, it will allow me to move faster and make more useful content! 💚💚💚

SOYBEAN - IMMINENT SELL OFFSOYBEAN FUTURES - MONTHLY SUPPLY AND DEMAND ANALYSIS
Soybean sold at Monthly Supply Zone -> Destiny: Monthly Demand Zone
I suggest make the following probable trades:
- Sell Soybean until reach Monthly Demand zone
- Buy Soybean from Monthly Demand Zone until Monthly Supply Zone

Bitcoin's Second Bottom Before Halving: A Potential Trap When Bitcoin undergoes a significant price decline and subsequently forms another bottom before the halving, some traders might interpret this as an attractive entry point to buy Bitcoin at a seemingly discounted price. The expectation is that the halving will trigger a supply shortage and, in turn, drive up the price.
However, financial markets are inherently uncertain and influenced by various factors, both within and outside the cryptocurrency space. While historical patterns and past halvings may provide insights, they do not guarantee future outcomes. The second bottom could be a "bear trap," luring traders into buying, only for the price to continue declining or remaining stagnant, resulting in losses for those who entered the market with high expectations.
It is essential for traders and investors to exercise caution and avoid making decisions solely based on historical patterns or event speculation. Conducting thorough research, staying informed about market developments, and employing proper risk management strategies are crucial when participating in the volatile and unpredictable world of cryptocurrencies like Bitcoin. Additionally, seeking advice from financial experts can help in making informed investment choices.


SUPPORT LINE btcsupport line $27900 to $28500, then next 60 days hits $40k regardless, $50k is max by end June, correction in July to $35K then Moon shot to $70K by DEC 2023- Jan 2024.

Bitcoin year of despairmajor resistance rejected and elliot wave theory. Year of despair for bulls. Youve been warned.

you can sell bitcoin Now !welcome everybody ! I hope you are happy! This is a simple and awesome analysis and you can sell either in the futures or in the forex market! I wish you a happy year

BTC 2023-2024 ProjectionRandom walk until fed lowers interest rates.
Looking for a pivot in fed policy and landing between mid may to august.
