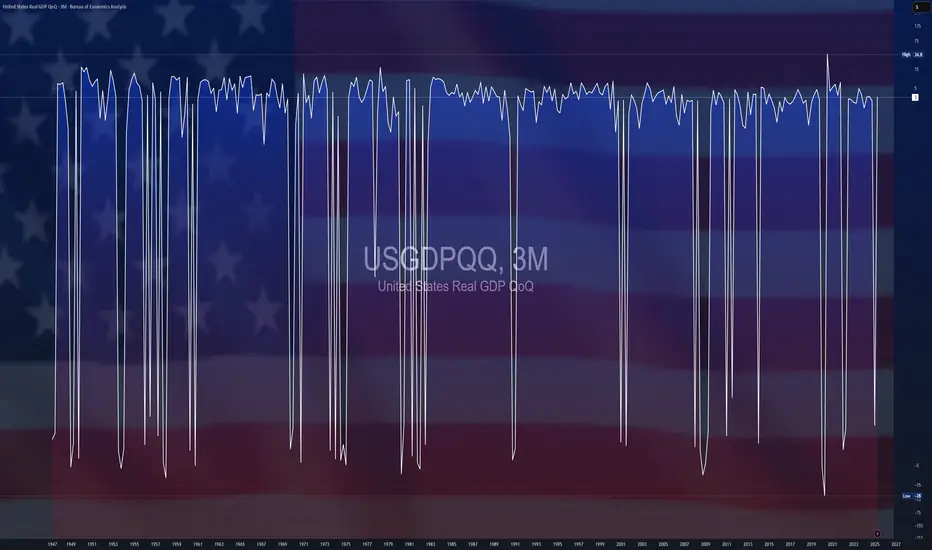
$USGDPQQ -U.S Economic Growth Outpaces Forecasts (Q2/2025)ECONOMICS:USGDPQQ 3%
Q2/2025
source: U.S. Bureau of Economic Analysis
- The US economy grew at an annualized rate of 3% in Q2 2025,
sharply rebounding from a 0.5% contraction in Q1 and exceeding market expectations of 2.4% growth, largely driven by a decline in imports and a solid increase in consumer spending.
However, the gains were partly offset by weaker investment and lower exports.
2025
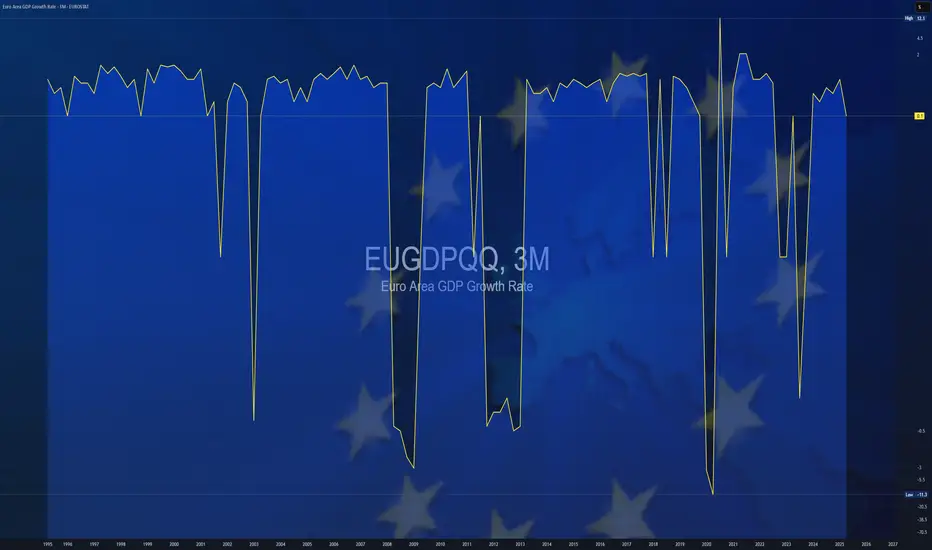
$EUGDPQQ -Europe GDP (Q2/2025)ECONOMICS:EUGDPQQ
Q2/2025
source : EUROSTAT
- The Gross Domestic Product (GDP) In the Euro-Area expanded 0.10 percent in the second quarter of 2025 over the previous quarter.
GDP Growth Rate in the Euro Area averaged 0.37 percent from 1995 until 2025, reaching an all time high of 11.60 percent in the third quarter of 2020 and a record low of -11.10 percent in the second quarter of 2020.
BTC - Trap, Tap, and Blast Off!BTC has been overall bullish, trading within the rising blue channel (1). After reaching a local high, it entered a short-term correction, forming a falling red channel (2).
👀All eyes are now on the key demand zone (3), which aligns with the lower bound of both the red channel and the rising blue structure.
🔎As long as this confluence holds, we anticipate a potential bullish impulse in August.
A retest of the $111,500–$112,000 zone could serve as the trigger for the next leg toward $128,000. Let’s see if BTC is gearing up for another breakout or if a deeper correction is in play.
🔔 Disclaimer: This analysis is for educational and informational purposes only. It does not constitute financial advice or a recommendation to buy or sell any asset. Always do your own research and manage your risk accordingly.
📚 Always follow your trading plan => including entry, risk management, and trade execution.
Good luck!
All strategies are good, if managed properly.
~ Richard Nasr

ARTY - The Undervalued Gaming Rocket?While most eyes are on memecoins and major Layer-1s, a sleeping giant may be gearing up in the GameFi sector — and this time, it’s powered by real innovation and user growth.
🎮 Fundamental Boost
Artyfact has just launched its long-awaited Play-and-Earn mode — the first of its kind. This new feature is expected to onboard hundreds of thousands of gamers into the ecosystem. And here’s the catch: players can only purchase gaming NFTs using KUCOIN:ARTYUSDT . This shift not only introduces a fresh wave of demand but also builds real token utility — the kind most GameFi tokens lack.
💼Additionally, recent sell pressure from early investors has now faded. Those who had been staking ARTY for three years have finally taken their profits. With that wave of selling behind us, the token now has room to breathe — and potentially fly.
And yes, I bought ARTY myself — not financial advice, but I’m personally betting on its next big move.
📊 Technical Analysis
AMEX:ARTY has been trading within a bullish ascending triangle, forming higher lows and maintaining strong support around the $0.13 level. Each time it tapped this zone, it triggered strong impulse moves — one up 88%, another over 100%.
Right now, ARTY is back at that exact support level, with a third impulse wave potentially brewing. A bounce from here could send it back toward the upper trendline near $0.30 — our first target.
If that breaks, the next resistance sits around the $0.70 zone, a previous structural high and psychological round number. And if the gaming adoption kicks in as expected, we could be heading toward a macro bull market target of $1+, which would represent a multi-X move from here.
📈 3 Bullish Targets for AMEX:ARTY
$0.30 — top of ascending triangle
$0.70 — structural resistance from prior impulse
$1.00+ — psychological milestone backed by new NFT demand and adoption
📍 Why ARTY?
Artyfact is not just another GameFi project — it’s building a functional gaming economy where NFTs have real use, and where the token is required for participation. In a sea of hype-driven tokens, ARTY stands out by actually shipping product and onboarding users.
With the new Play-and-Earn mode gaining traction, a solid technical base forming, and sell pressure behind us, ARTY could be setting up for its biggest run yet.
➡️ As always, make sure to do your own research and only invest in what you truly believe in.
🎯 Stick to your trading plan — entry, risk, and execution.
Good luck!
All strategies are good, if managed properly.
~ Richard Nasr

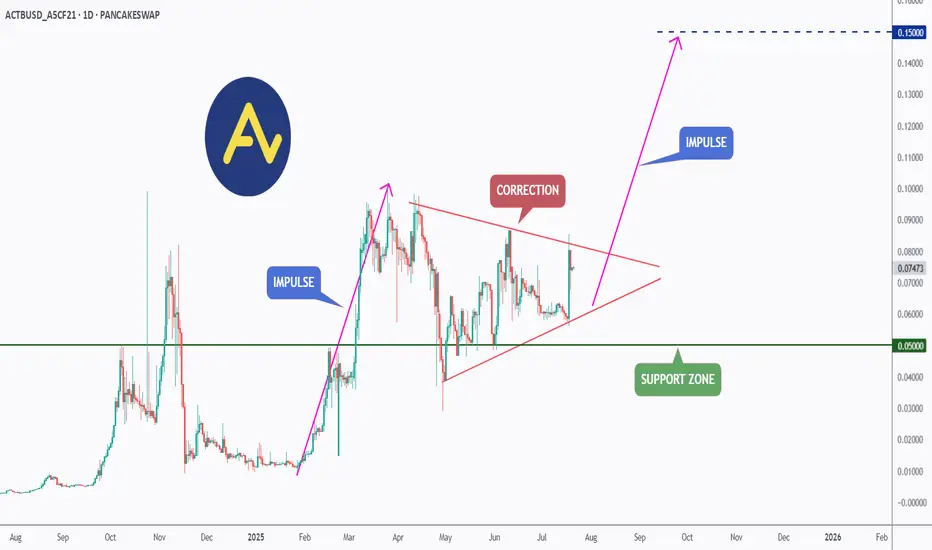
ACT (Acet) - Eyeing the Next Impulse Move?ACT has been forming a textbook bullish continuation pattern.↗️
After a strong impulse leg earlier this year, price has been consolidating within a symmetrical triangle, signaling a healthy correction phase.
🏹Today, ACT broke out of the triangle to the upside , indicating that bulls may be taking control once again.
📍If momentum continues, the next impulse move could push price toward the $0.15 resistance as a first target — a major psychological and technical level.
As long as the $0.050 support holds, ACT remains in bullish territory with upside potential in sight.
📚 Always follow your trading plan regarding entry, risk management, and trade management.
Good luck!
All Strategies Are Good; If Managed Properly!
~Richard Nasr
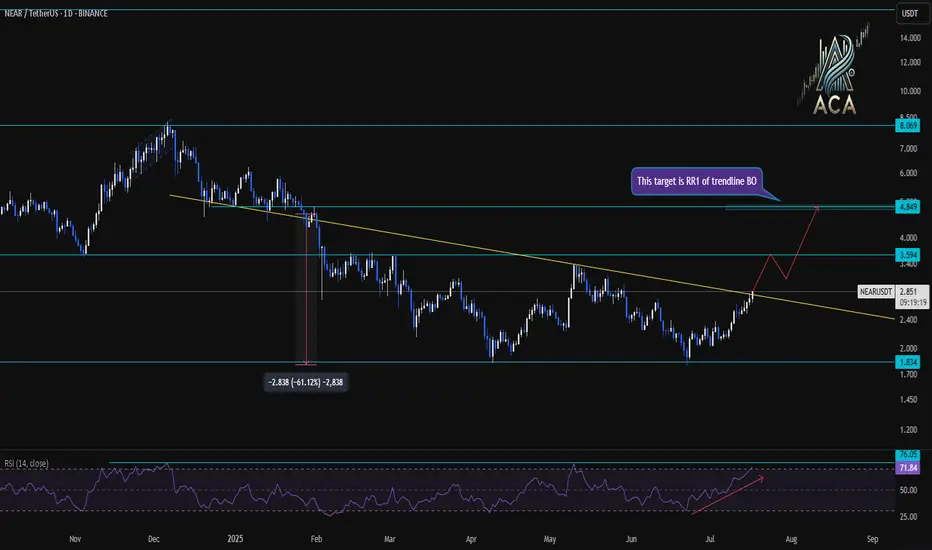
NEARUSDT Daily Chart Analysis|Strong Breakout & RSI ConfirmationNEARUSDT Daily Chart Analysis | Strong Breakout & RSI Confirmation
🔍 Let’s break down the latest NEAR/USDT daily chart, spotlighting critical resistance, target levels, and momentum signals.
⏳ Daily Overview
NEAR has confirmed a bullish breakout above its long-term descending trendline. This move comes with a surge in price and a strong daily candle—clear evidence of renewed bullish momentum.
📊 Momentum & RSI
RSI has surged to 76 (overbought zone), higher than the typical overbought level of 70. This spike reflects strong buying pressure, but also signals the possibility of near-term pullback or consolidation.
RSI-Momentum Convergence: The RSI uptrend is in lockstep with price action, confirming that bullish momentum is genuine and backed by increasing strength—not a divergence.
🔑 Key Levels
- First Resistance: $3.59—watch this closely as the next hurdle for bulls.
- Breakout Target: $4.85, which corresponds to the measured move (RR1) from the trendline breakout and aligns with the next horizontal resistance.
- Extension Target: $8.01 if momentum persists and price sustains above $4.85 in the coming weeks.
📌 Highlights
- Clear trendline breakout validated by strong RSI convergence.
- RSI has entered the overbought zone (76), backing momentum—watch for either breakout follow-through or brief cooling.
- Key levels: $3.59 (first resistance), $4.85 (breakout target).
🚨 Conclusion
Momentum is with the bulls after the breakout. Eyes on $3.59 as the near-term test; a clean move above opens up $4.85 and potentially $8.01 if momentum continues.
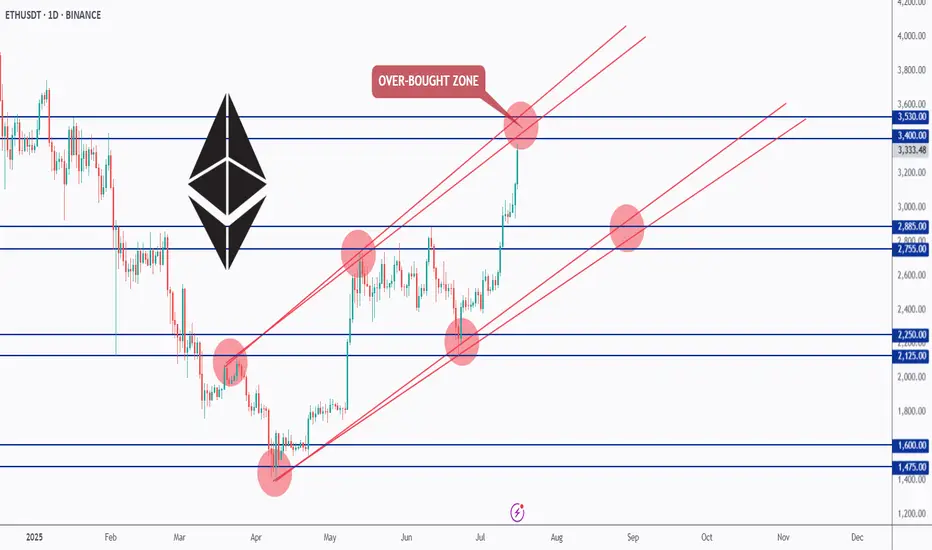
ETH Testing Overbought Zone — What’s Next?📊ETH has been overall bullish, trading inside this rising red channel for months.
After breaking above the $2,885 resistance, bulls took full control, and price is now approaching the upper red trendline — an overbought zone where we’ve seen rejections before.
As long as ETH holds above the $2,885 zone, the bulls remain in control. But since we’re near a strong resistance and the top of the channel, we’ll be waiting for a potential correction or at least a slowdown in momentum before looking for fresh entries.
📌 Key levels to watch:
Resistance: $3,400 – $3,530
Support: $2,885 – $2,755
Let’s stay patient and follow the market’s lead. 🧠
Let me know your thoughts in the comments 👇
📚 Always follow your trading plan regarding entry, risk management, and trade management.
Good luck!
All Strategies Are Good; If Managed Properly!
~Richard Nasr
ETH Building Blocks - Keep it Simple🧱 Building Block - ETH Weekly Analysis 🧱
Ethereum has been trading within a well-defined structure, respecting key horizontal zones — each acting as a crucial building block in ETH’s macro journey.
🔹 Zone 1 ($1,700 - $2,100)
A strong demand and accumulation zone. ETH bounced from here multiple times, proving itself as the foundation of the current bullish attempt.
🔹 Zone 2 ($2,400 - $2,600)
We're currently hovering around this key mid-range resistance. A successful break above it would pave the way for the next major leg up.
🔹 Zone 3 ($2,900 - $3,400)
A major historical resistance turned supply area. ETH needs strong momentum and volume to break through this ceiling.
🔹 Zone 4 ($3,800 - $4,200)
The final building block before retesting ATH territory. A retest here could signal full bullish control in the coming months.
📍 As long as Zone 1 holds, ETH remains structurally bullish. Watch for breaks and rejections at each building block to gauge the next move.
Which block will ETH break next? 🔮
📚 Always follow your trading plan regarding entry, risk management, and trade management.
Good luck!
All Strategies Are Good; If Managed Properly!
~Rich

SEI - One More Bullish Impulse Soon!Hello TradingView Family / Fellow Traders. This is Richard, also known as theSignalyst.
📈After surging by over 75% last week , SEI is currently in a correction phase.
However, it is approaching the intersection of the previous high marked in orange and blue trendline acting as a non-horizontal support.
📚 As per my trading style:
As #SEI approaches the blue circle zone, I will be looking for bullish reversal setups (like a double bottom pattern, trendline break , and so on...)
📚 Always follow your trading plan regarding entry, risk management, and trade management.
Good luck!
All Strategies Are Good; If Managed Properly!
~Rich

BTC is Back in Price Discovery Mode — Targeting $140K!After a clean break above the previous all-time high, Bitcoin has officially entered a new impulse phase, trading within a steep rising channel.
The green zone around the previous ATH is now acting as a strong support zone, confirming the shift in market structure.
🟠 The macro trend remains intact, and bulls are clearly in control.
🌀 Corrections continue to offer opportunities for trend-following entries, and if momentum holds, BTC could be on its way toward the $140,000 mark — the upper boundary of the macro channel.
Until then, every dip is a gift in this bullish cycle. 🔥
🧠 Trade with the trend. Manage your risk. Stay ready.
📚 Always follow your trading plan regarding entry, risk management, and trade management.
Good luck!
All Strategies Are Good; If Managed Properly!
~Richard Nasr

BTC - Falling Correction = Continuation?BTC has been playing by the rules lately!
Every time Bitcoin forms a falling correction, it turns out to be a bullish continuation pattern — and history might be repeating itself 👀
As shown on the chart:
Previous falling channels (flag/wedge structures) have consistently led to strong bullish impulses.
The current correction also appears to be a falling channel, hinting at another potential bullish leg soon.
As long as the structure holds and no major support is broken, the next target could be a new all-time high.
Let’s see if BTC continues to respect this textbook behavior.
📌 Remember: Falling corrections in an uptrend = healthy continuation!
📚 Always follow your trading plan regarding entry, risk management, and trade management.
Good luck!
All Strategies Are Good; If Managed Properly!
~Rich

BTC – Bullish Continuation Ahead ?Bitcoin has been trading within a well-defined rising channel since mid-2023, respecting both upper and lower bounds beautifully.
After each impulsive move, we’ve seen healthy corrections followed by bullish continuations — a classic market structure in play.
🟦 Accumulation Zone: After a long accumulation phase, BTC kicked off a strong bullish cycle.
🟥 Correction Phases: Each major move was followed by a red correction zone before resuming the uptrend.
🟧 Current Phase: BTC is consolidating just below the upper channel boundary. A breakout above this zone could confirm the next bullish wave toward $140K+.
🔵 Key Observations:
Structure remains intact within the channel
Previous breakout zones now acting as support (blue arrows)
Continuation patterns are forming, signaling potential upside
🏹As long as the orange zone holds, BTC remains in a bullish structure, and a breakout would likely push us to new highs.
📍Will history repeat and BTC continue its journey toward the upper channel boundary? Let’s wait for confirmation!
💬 What’s your bias here? Are you bullish or waiting for a deeper pullback?
📚 Always follow your trading plan regarding entry, risk management, and trade management.
Good luck!
All Strategies Are Good; If Managed Properly!
~Richard Nasr

BTC - Bulls Getting Ready!!Hello TradingView Family / Fellow Traders. This is Richard, also known as theSignalyst.
📈BTC has been bullish trading within the flat rising wedge marked in blue and it is currently retesting the lower bound of the wedge.
Moreover, the orange zone is a strong demand.
🏹 Thus, the highlighted blue circle is a strong area to look for buy setups as it is the intersection of demand and lower blue trendline acting as a non-horizontal support.
📚 As per my trading style:
As #BTC approaches the blue circle zone, I will be looking for bullish reversal setups (like a double bottom pattern, trendline break , and so on...)
📚 Always follow your trading plan regarding entry, risk management, and trade management.
Good luck!
All Strategies Are Good; If Managed Properly!
~Rich

Cautious — this Chart is Slippery!Hello TradingView Family / Fellow Traders. This is Richard, also known as theSignalyst.
🛢️After surging by over 35% in the past two weeks, USOIL took a hit following Trump's announcement of a ceasefire between Iran and Israel.
However, from a technical perspective, USOIL is approaching a strong daily support zone marked in red.
As long as this support holds, the bulls remain in control.
📊The next bullish impulse will be confirmed upon a break above the last minor high marked in blue.
In such a scenario, a move toward the supply zone (also marked in red) would be expected.
📚 Always follow your trading plan regarding entry, risk management, and trade management.
Good luck!
All Strategies Are Good; If Managed Properly!
~Rich

(NPC) non-playable coinNew to Kraken exchange, seems to be a contender in something fascinating to those people that buy weirdly strange internet meme tokens. Only a few days have passed but after the second ticker the price appears to not be losing.

(jasmy) jasmy "array"I can't share my indicator ideas unless I publish them publicly. I don't feel like sharing my indicators with the public is necessary so I guess I will not be publishing many new ideas because the Trading View website is removing features where unpublished custom indicators are allowed to be included in sharing. Trading View is too strict and they keep choking the freedoms of watchlist, now indicators, what's next to be taken away from users of the website?

ENA - Already Over-Sold!Hello TradingView Family / Fellow Traders. This is Richard, also known as theSignalyst.
📈ENA has been overall bearish trading within the falling channel marked in red and it is currently retesting the lower bound of the channel.
Moreover, the blue zone is a strong demand.
🏹 Thus, the highlighted blue circle is a strong area to look for buy setups as it is the intersection of demand and lower red trendline acting as a non-horizontal support.
📚 As per my trading style:
As #ENA approaches the blue circle zone, I will be looking for bullish reversal setups (like a double bottom pattern, trendline break , and so on...)
📚 Always follow your trading plan regarding entry, risk management, and trade management.
Good luck!
All Strategies Are Good; If Managed Properly!
~Rich

MSTR - The Saylor in the Storm!Hello TradingView Family / Fellow Traders. This is Richard, also known as theSignalyst.
📈MSTR has been overall bullish trading within the rising channel marked in blue. (log chart)
Currently, it is in a correction phase within the falling red channel.
Moreover, the red zone is a strong demand.
🏹 Thus, the highlighted blue circle is a strong area to look for buy setups as it is the intersection of demand and lower trendlines acting as non-horizontal support.
📚 As per my trading style:
As #MSTR approaches the blue circle, I will be looking for bullish reversal setups (like a double bottom pattern, trendline break , and so on...)
📚 Always follow your trading plan regarding entry, risk management, and trade management.
Good luck!
All Strategies Are Good; If Managed Properly!
~Rich

Market3I haven’t been posting much lately simply because there’s nothing particularly interesting to say, the market has been a bit dull.
2025 should be a strong year for altcoins, as they’ve been consistently suppressed. With BTC dominance reaching 64%, which is quite significant, all attention remains on Bitcoin.
On this chart, you can see that $1.17 trillion acted as a rejection level for the crypto market (excluding BTC and ETH). Time will tell, but I anticipate a $4 trillion altcoin bull market before the end of 2025.
Remember, Fibonacci plays a crucial role in long-term market predictions.
Invest wisely and at the right time.
Happy Tr4Ding !

BTC - Let's Do It Again!!Hello TradingView Family / Fellow Traders. This is Richard, also known as theSignalyst.
📈 As per our last analysis (attached on the chart), BTC rejected the lower orange trendline and moved higher as expected! ✅
🔄 BTC is now retesting the lower trendline again, so we’ll be looking for new trend-following buy setups as long as the red structure at $105,000 holds!
📚 Always follow your trading plan regarding entry, risk management, and trade management.
Good luck!
All Strategies Are Good; If Managed Properly!
~Rich

Bitcoin Levels in 2025Prediction levels on Bitcoin in 2025.
*first step - 143000 $ - 144000 $
* quick shot and back - 210000 $
* almost imposible in 2025 - 280000 $
We waiting for Fed decissions in this week.
- FOMC protocol 28 may 2025 - 19:00 (GMT +1)
- PKB USA 29 may 2025 - 2:30 PM (GMT +1)
- Core PCE 30 may 2025 - 14:30 (GMT +1)

BTC - New Impulse Soon!Hello TradingView Family / Fellow Traders. This is Richard, also known as theSignalyst.
📈 BTC has been bullish, trading within the rising channel marked in orange. 🟧
In a typical trend, corrections are usually bearish. 🔻
However, in BTC’s case, the correction phases marked in red are flat — a strong signal that the bulls are in control 💪 and not allowing the bears to trigger a classic pullback.
As long as BTC holds within the rising orange channel, we expect the next impulse phase to kick off soon 🚀 — aiming for the $115,000 round number. 🎯
This move will be confirmed once BTC breaks above the current flat correction zone marked in red. ✅
📚 Always follow your trading plan regarding entry, risk management, and trade management.
Good luck!
All Strategies Are Good; If Managed Properly!
~Rich

+460% potential profit with TVS MotorThis is my pick for buy&hold in 2025 in NSE India. A part of Nifty Auto Index which will drive its growth and lead the sector.
Strong chart from all angles. This is published as demo of what is available on my social media. You can find more through links in my profile.
