2025 roadmap for gold xauusd by my strategyAs we look ahead to 2025, this analysis outlines a comprehensive roadmap for trading XAU/USD (gold) based on my proprietary strategy. With a focus on key market drivers, technical indicators, and geopolitical factors, this roadmap aims to provide traders with actionable insights and a clear vision of Potential price movements for gold.
In this report, I will delve into the fundamental and technical aspects that are likely to influence gold prices in 2025, including expected shifts in monetary policy, inflation trends, and global economic conditions. I will also highlight critical support and resistance levels, chart patterns, and relevant indicators that could guide buying and selling decisions.
Additionally, the analysis will explore the impact of external factors such as interest rates, currency fluctuations, and market sentiment on gold’s performance. By implementing my strategy, traders will be better equipped to navigate the complexities of the gold market and identify profitable opportunities in the coming year.
Join me on this journey to uncover the potential pathways for XAU/USD in 2025 and refine your trading approach in alignment with emerging trends.
these price is the Key Points for changing the trend and will be nice for swing position .
i wish you the best in 2025 and you will be make more money than past...
2025
Bitcoin's 2024 Halving to 2025 Peak: Will BTC Reach $294K?📌Historical Observations
- 2012 Halving → 2013 Top:
Duration: ~1 year.
Price increase: ~8,600% (from ~$12 to ~$1,150).
- 2016 Halving → 2017 Top:
Duration: ~1.5 years.
Price increase: ~2,900% (from ~$650 to ~$19,500).
- 2020 Halving → 2021 Top:
Duration: ~1.5 years.
Price increase: ~900% (from ~$8,600 to ~$69,000).
- 2024 Halving → Projected 2025 Top:
Halving price: ~$64,000.
📌Identified Patterns
- Time from Halving to Peak: Peaks occur around 1.33 to 1.5 years after the halving.
- Diminishing Returns: Growth rates decrease with each cycle:
2012 to 2016: ~66% reduction in returns.
2016 to 2020: ~69% reduction in returns.
Expected reduction for 2024 cycle: ~60-70%.
📌Projection for the 2024 Cycle
Duration to Peak:
Add 1.33 to 1.5 years to the halving date (April 2024).
Projected top: June to October 2025.
Price Growth:
Assuming diminishing returns, we estimate 300% to 360% price growth from the halving price.
Next Top Price=Halving Price×(1+Growth Rate)
300% growth: $64,000 × 4 = $256,000.
360% growth: $64,000 × 4.6 = $294,400.
📌Final Projection
Next Bitcoin Peak Price: Estimated between $256,000 and $294,400.
Timing: Likely between June and October 2025.
Here’s to a successful and prosperous trading year ahead! 🎉
You’ve got this! Let’s make 2025 your best trading year yet.
~ Rich
BTC 2025 I have plotted the yearly OHL. White line shows year open.
If you think BTC is bullish then you buy the year open and hold till EOY or hodl till your heart desires.
Alternatively you could gamble and wait for a dip below year open and buy then. Or perhaps you can wait till there's a dip below year open and then wait for a reclaim back on top of the year open level to start bidding.
Regardless I see a strong bull trend:
12 years of buy year open and hold till EOY = positive return
3 years of buy on year open and hold till EOY = negative return
2015 is an outlier but despite the heavy drawdown the year end gave a positive return.
The probabilities are very skewed and its pretty crazy how complicated we make the LTF analysis and forecasts where the simplest of strategies garners significant gains.
The years following a halving year (2013, 2017, 2021) all have a 100% hit rate of buy year open and hold till EOY. Those years offered a very positive return and marked the top of the "cycle" being followed by a down year.
My personal opinion is you either buy now or buy higher later. We might look back in a few years and lament on how we had so much time to buy sub 100k.
Alts see a similar pattern. The beginning of the year is crucial in determining what lies ahead.
Strategy 2025. BTC Airless Scenario Below $100'000 Choking PointThe crypto market is flashing a worrying outlook for 2025, since a disappointing Santa Claus rally this year could deepen issues.
This is especially important if BTC will not be able to finish the year 2024 firmly above $100'000 per coin.
The financial market has had a tough week, but it might also be in store for a tough year in 2025.
The market is on track for its worst weeks over years after the Federal Reserve gave a hawkish forecast for interest rate cuts in 2025. But looking at the market's internals, it's clear that damage had been inflicted well before the Fed's Wednesday meeting—and the signal is a historic indicator of tough times ahead.
The number of stocks in Top Stock Club S&P 500 that are declining outpaced advancing stocks for 14 consecutive days on Thursday.
The advancing/declining data helps measure underlying participation in market moves, and the recent weakness signals that even though the S&P 500 is only off 4% from its record high, there's damage under the hood of the benchmark index.
This is evidenced by the equal-weighted S&P 500 index being off 7% from its record high.
According to Ed Clissold, chief US strategist at Ned Davis Research, the 14-day losing streak for the S&P 500's advance-decline line is the worst since October 15, 1978.
Clissold said 10-day losing streaks or more in advancing stocks relative to declining stocks can be a bad omen for future stock market returns.
While this scenario has only been triggered six times since 1972, it shows lackluster forward returns for the S&P 500. The index has printed an average six-month forward return of 0.1% after these 10-day breadth losing streaks flashed, compared to the typical 4.5% average gain seen during all periods.
"Studies with six cases hardly make for a strategy. But market tops have to start somewhere, and many begin with breadth divergences, or popular averages posting gains with few stocks participating," Clissold said.
Perhaps more telling for the stock market is whether it can stage a recovery as it heads into one of the most bullish seasonal periods of the year: the Santa Claus trading window.
If it can't, that would be telling, according to Clissold.
"A lack of a Santa Claus Rally would be concerning not only from a seasonal perspective, but it would allow breadth divergences to deepen," the strategist said.
Also concerning to Clissold is investor sentiment, which has flashed signs of extreme optimism since September. According to the research firm's internal crowd sentiment poll, it is in the seventh-longest stretch in the excessive optimism zone, based on data since 1995.
"Several surveys have reached what could be unsustainable levels," Clissold said, warning that any reversal in sentiment could be a warning sign for future market returns.
Ultimately, continued stock market weakness, especially in the internals, would suggest to Clissold that 2025 won't be as easy as 2024 for investors.
"If the stock market cannot rectify recent breadth divergences in the next few weeks, it would suggest our concerns about a more difficult 2025 could come to fruition," the strategist said.
Moreover, Dow Jones index has printed recently The Three Black Crows Bearish candlestick pattern, on weekly basis.
This is especially important, since mentioned above pattern is massively unwinding from Dow's all the history highs.
Previously this pattern has already appeared in TVC:DJI in November 2021 and lead to 20 percent decline in 2022 for Dow Jones Index and to more than 70 percent decline in BTC.
The Three Black Crows Bearish candlestick pattern also has appeared in Dow Jones Index in September, 2018 (lead to 18% decline) and in July, 2007 (lead to more than 50% decline).
The main technical graph represents a Choking Strategy for BTC in 2025, i.e. BTC airless scenario below $100'000 choking point.
The epic 52-week SMA breakthrough in BTC will definitely accelerate a decline at all.
30/12/24 Weekly outlookLast weeks high: $99,988.07
Last weeks low: $92,529.54
Midpoint: $96,258.81
As the year comes to an end, we have a split week with new years day landing on Wednesday. The yearly candle starts @ $42,300, blasted past the previous ATH @ $69,000 and is now $90,000-100,000 a huge climb in the second straight green year for Bitcoin, all eyes on the yearly close!
Historically the yearly close can be fairly uneventful as some portfolio rebalancing & tax implications are taken into account in some countries around the world, so for BTC to close around the current price would be very positive.
Going into 2025, history suggests that the 3rd year of a Bullrun is the final year and so part of planning for 2025 will include some sort of exit strategy. Now I do believe that crypto is here to stay long term and this year has proven that with mainstream ETFs, government acceptance and in some case embrace, also businesses adding BTC to their balance sheet and more and companies accepting crypto as payment. All extremely positive for the space cementing cryptos mass adoption.
For this week if we do see any move of note I believe it will be later in the week once the bigger players return to work, but I'm also conscious of January 20th when the presidential inauguration takes place. After that date there really shouldn't be too much holding back the continuation of the Bullrun.
Solana Is In A Good Spot! My StrategyHey everyone,
here's a breakdown of my mid-term strategy for Solana (SOL/USDT). We're focusing on simple but effective rules, such as a Support & Resistance flip, which is happening as we speak.
Based on my experience (this is my third cycle), these steep corrections are great opportunities to add different altcoins to your portfolio and in some cases, take a leveraged position. 2025 will be bullish for crypto. And Solana is one of the better picks in this market.
If you like these kinds of explanatory ideas, please let me know in the comments.
Best,
Anton
#KOALA AI #KOKO artificial intelligence KOALA AII think it's worth packing a little surprise bag for myself for 2025. Horizontal yellow shaded levels are buy zones. Invalidations are multiple daily closing candles below the horizontal blue box. Targets are the red price tags above. tp: 1.2.3. It is not investment advice, it is everyone's own decision.
7 Mindset Checks for Trading Success in 2025!Are You Psychologically Ready to Be a Trader? 🎯
As we step into the New Year, it's the perfect time to reflect on whether you're truly prepared to take on the world of trading. Here’s a checklist to assess your mindset and psychological readiness for the challenges ahead.
1️⃣ Do You Get Angry When You Lose?
If you tend to get upset over a lost game or seek revenge, trading might amplify those emotions. With money at stake, it's easy to blame external factors like the news, politics, or distractions for a losing trade.
But here's the truth: losses are part of the process. Successful traders embrace losses as learning opportunities and focus on the next profitable setup instead of dwelling on the past.
Remember: Revenge trading is a trap. The market doesn’t cause losses—you do. Instead of seeking revenge, take responsibility, learn, and move forward.
“The best fighter is never angry.” – Lao Tzu
2️⃣ Do You Think You’re Always Right?
Ego is a trader's biggest enemy. Trading isn’t about being right or wrong—it’s about making money.
If your ego drives your decisions, you might overestimate your abilities, skip your trading plan, and take unnecessary risks. Stay humble and let the market teach you.
Ego-filled traders may call themselves analysts or influencers, but true traders prioritize discipline over arrogance.
3️⃣ Do You Fasten Your Seatbelt Every Time You Drive?
Wearing a seatbelt is a simple yet critical risk management habit. Similarly, in trading, risk management is everything.
Professional traders focus on controlling risk, not chasing rewards. Trading without a stop loss is like driving without a seatbelt—one mistake can ruin everything.
Remember: the market can go anywhere. Be prepared for every outcome.
4️⃣ Are You a Follower?
Successful traders carve their own paths. Blindly copying others’ strategies or trades on social media undermines your independence.
You chose trading to be your own boss—embrace that responsibility. Develop and trust your own trading plan, tailored to your goals, personality, and style.
“If you don’t design your own life plan, chances are you’ll fall into someone else’s plan. And guess what they have planned for you? Not much.” – Jim Rohn
5️⃣ Can You Wait for the Green Traffic Light?
Patience is a cornerstone of trading success. Waiting for the right setup and following your plan with discipline ensures long-term profitability.
Self-discipline isn’t innate—it’s built over time. Commit to your plan, refine your strategy, and trust the process.
“The market pays you to be disciplined.”
6️⃣ Are You Committed to Long-Term Goals?
Just as a long-term relationship or fitness journey requires dedication and focus, so does trading. Jumping from one strategy to another only leads to inconsistency.
If your strategy is profitable, stick with it. Master it. Repetition and consistency turn your strategy into a money machine.
Successful trading is supposed to be boring. Embrace the grind.
7️⃣ Do You Finish Your Popcorn Before the Movie Starts?
If patience isn’t your strength, trading might test you. Most of your time as a trader is spent waiting—for setups, for trades to play out, and for profits to materialize.
“The stock market is a device for transferring money from the impatient to the patient.” – Warren Buffett
📚 The Takeaway
Trading isn’t just about charts and strategies—it’s a test of your psychology, discipline, and patience.
As we welcome the New Year, let’s focus on improving not just our trading skills but also our mindset. A strong foundation in trading psychology leads to better decision-making and long-term success.
Work on your human psychology, develop your risk management, and commit to the journey. Remember, successful traders are made, not born.
Here’s to a successful and prosperous trading year ahead! 🎉
You’ve got this! Let’s make 2025 your best trading year yet.
~ Rich
GOLD - 2025 Forecast - Technical Analysis & Trading Ideas! 2025 forecast:
While the price is above the support 2475.27, resumption of uptrend is expected.
We make sure when the resistance at 2789.95 breaks.
If the support at 2475.27 is broken, the short-term forecast -resumption of uptrend- will be invalid.
Technical analysis:
A peak is formed in daily chart at 2726.10 on 12/12/2024, so more losses to support(s) 2582.31, 2527.50 and minimum to Major Support (2475.27) is expected.
Trading suggestion:
There is possibility of temporary retracement to suggested Trend Hunter Buy Zone (2527.50 to 2475.27). We wait during the retracement, until the price tests the zone, whether approaching, touching or entering the zone.
We would set buy orders based on Daily-Trading-Opportunities and expect to reach short-term targets.
Beginning of entry zone (2527.50)
Ending of entry zone (2475.27)
Take Profits:
2582.31
2644.20
2721.30
2789.95
2850.00
2900.00
2950.00
3000.00
__________________________________________________________________
❤️ If you find this helpful and want more FREE forecasts in TradingView,
. . . . . Please show your support back,
. . . . . . . . Hit the 👍 BOOST button,
. . . . . . . . . . . Drop some feedback below in the comment!
🙏 Your Support is appreciated!
Let us know how you see this opportunity and forecast.
Have a successful week,
ForecastCity Support Team
TradeCityPro | ENJUSDT Analysis Christmas Holiday👋 Welcome to TradeCityPro Channel!
Let’s analyze ENJ during the holiday season and identify triggers across different timeframes to make the most of market opportunities. Don't forget to check the Signature section at the end for updates! 😊
🌐 Overview Bitcoin
Before diving into ENJ analysis, let’s look at Bitcoin. It broke the 95445 short-term support and is expected to move toward the 92722 support, where it might form a new structure. Key support levels for Bitcoin are 91K, 86K, and 81K, which hold significant importance.
Additionally, Bitcoin dominance is also dropping, forming red candles during this decline. This means the market as a whole is correcting:
Coins bullish against BTC are correcting less, Coins bearish against BTC are showing more red candles than Bitcoin itself.
📊 Weekly Timeframe
ENJ hasn’t shown significant movement. After breaking its smaller box resistance, it entered the larger timeframe box, only to get rejected from the upper boundary and return to the entry point of its box.
The 0.3743 resistance has become increasingly important. Once broken, it could signal a buy opportunity, preparing for a potential break of 0.6920. However, ensure the breakout is accompanied by increasing green candle volume and confirmation through RSI surpassing 83.90.
If you are holding ENJ and looking to activate your stop loss to exit, it’s logical to sell after breaking 0.1256 and closing a weekly candle below it. Always take stop losses seriously and look for re-entry triggers later.
📈 Daily Timeframe
After hitting the 0.3838 daily resistance, ENJ has formed lower highs and lows, returning to the 0.2116 support zone, which is crucial.
This 0.2116 support holds significance due to Fibonacci alignment,Its position on the 50% level, indicating potential for a rebound if the trend weakens.
Alternatively, breaking this support could lead to lower lows, bringing ENJ back into its weekly box. In this case, it might retest the 0.1854 and 0.1520 support levels.
⏱ 4-Hour Timeframe
Market volume has significantly dropped, suggesting reduced trading activity during the holidays. This low 24-hour trading volume has led to irrational and unnecessary market fluctuations.
📈 Long Position Trigger
After breaking 0.2483, a long position can be opened, but given the low market volume, trades should be executed with reduced risk.
📉 Short Position Trigger
After breaking 0.2105, a short position can be considered. However, logical trading during these conditions involves small stop losses and focusing on risk-to-reward ratios while quickly taking profits.
💡 BTC Pair Insight
Currently, ENJ isn’t performing well against Bitcoin. After showing some signs of life by testing the 0.000000374 resistance, it got rejected and returned to its support level.
Keep in mind that breaking this resistance could finally bring ENJ some gains against Bitcoin, which would likely translate into USDT price increases during a bullish market.
📝 Final Thoughts
Stay calm, trade wisely, and let's capture the market's best opportunities!
This analysis reflects our opinions and is not financial advice.
Share your thoughts in the comments, and don’t forget to share this analysis with your friends! ❤️
USDT Dominance Analysis. The dominance is moving within a descending channel, confirming a bearish structure.
Multiple rejections from the upper trendline (marked with arrows) indicate strong resistance around the 4.40% zone.
The highlighted green area near 4.10% acts as a crucial support zone, aligned with the channel's lower boundary.
A breakdown below this zone could lead to a sharp decline toward 4.00% or lower levels.
Moving Averages:
The green moving average (likely 200-period) suggests a broader bearish bias as dominance struggles below it.
The purple moving average (shorter-term) adds to the immediate resistance near 4.30%.
Short-Term Expectation:
The chart suggests a potential pullback or retracement toward the support zone, as the red arrow depicts.
Breaking below the support zone could intensify selling pressure in the crypto market, potentially signaling inflows into altcoins or BTC.
Resistance: 4.30% – 4.40%
Support: 4.10%, followed by 4.00%
USDT dominance appears to be consolidating near key levels, with a likely continuation of its downtrend unless significant bullish momentum emerges. Monitor for a breakdown of the support zone, as it could impact overall market liquidity dynamics.
For updates on other coins or personalized insights, feel free to reach out via DM.
@Peter_CSAdmin
Bitcoin Dominance - Falling Wedge Broken - Altseason is here #BTC.D (Bitcoin Dominance) #Analysis
Description
---------------------------------------------------------------
+ Bitcoin dominance has formed a nice falling wedge pattern and support is broken successfully.
+ This was the moment that everyone was waiting for, in 2025 we are gonna see a huge bull run, greater than last bull run.
+ Falling wedge is a bearish pattern and the dominance has successfully broken down from the wedge and heading towards the next support at around 39% (This is gonna be a the peak of the alt season)
+ 2025 jan will be huge for altcoins.
---------------------------------------------------------------
Enhance, Trade, Grow
---------------------------------------------------------------
Feel free to share your thoughts and insights. Don't forget to like and follow us for more trading ideas and discussions.
Best Regards,
VectorAlgo
The Crypto Market Game: How to Win Against Fear and ManipulationDid you really think profiting from the current bull run (a comprehensive upward market) would be easy? Don't be naive. Do you think they’ll let you buy low, hold, and sell high without any struggle? If it were that simple, everyone would be rich. But the truth is: 90% of you will lose. Why? Because the crypto market is not designed for everyone to win.
They will shake you. They will make you doubt everything. They will create panic, causing you to sell at the worst possible moment. Do you know what happens next? The best players in this game buy when there’s fear, not sell—because your panic gives them cheap assets.
This is how the game works: strong hands feed off weak hands. They exaggerate every dip, every correction, every sell-off. They make it look like the end of the world so you abandon everything. And when the market rises again, you’re left sitting there asking, “What just happened?”
This is not an accident. It’s a system. The market rewards patience and punishes weak emotions. The big players already know your thoughts. They know exactly when and how to stir fear, forcing you to give up. When you panic, they profit. They don’t just play the market—they play you. That’s why most people never succeed: they fall into the same traps over and over again.
People don’t realize that dips, FUD (fear, uncertainty, doubt), and panic are all part of the plan. But the winners? They block out the noise. They know that fear is temporary, but smart decisions last forever.
We’ve seen this play out hundreds of times. They pump the market after you sell. They take your assets, hold them, and sell them back to you at the top—leaving you with nothing, wondering how it happened.
Don’t play their game. Play your own.
Strategy 2025. Introducing Palantir, BTC Killer Of The Year 2024It's gone 3 months or so since Palantir stock has joined on Friday, September 20 Stock Top Club, also known as S&P 500 stock index SP:SPX .
Palantir was one of the strongest contenders for inclusion in the broad market S&P500 Index.
This inclusion, as well as Dell (DELL), came after tech companies Super Micro (SMCI) and Crowdstrike (CRWD) also joined the index earlier in this year 2024.
Since that, Palantir stock became the best (i.e. #1) S&P500 index performer this year, with current +375% YTD return in 2024, being highlighted at 80.55 USD per share - the new all the history peak reached last Friday, December, 19 at regular session close.
What is most important also, even recent Federal Reserve (The US Central Bank) hawkish projections on monetary policy in 2025 were not able to stop the only game in the city, or even make a pause on Palantir leadership.
Since Palantir stock is rallying 7th month in a row, the stalkers remain decently far away, swallowing the galactic dust of Palantir shares.
Judge for yourself.
One of the nearest pursuer, Nvidia Corporation NASDAQ:NVDA (# 4 out of all S&P500 index performers in 2024) is nearly to finish the year of 2024 with +170% return, i.e. lagging against Palantir behind twice.
The quite similar things happen with the most popular and heavy c-coin, also known as Bitcoin BITSTAMP:BTCUSD that is currently +130% YTD return in 2024.
What is most important also, Palantir stock outperforms both - S&P500 index, Nvidia Corp. and Bitcoin 7th straight month in a row.
In human words that means, Palantir stock monthly returns (every single month from May to December 2024) were better against each of mentioned above assets.
What is Behind this?
On November 4, 2024 Palantir Technologies has announced financial results for the third quarter ended September 30, 2024.
“We absolutely eviscerated this quarter, driven by unrelenting AI demand that won’t slow down. This is a U.S.-driven AI revolution that has taken full hold. The world will be divided between AI haves and have-nots. At Palantir, we plan to power the winners,” said Alexander C. Karp, Co-Founder and Chief Executive Officer of Palantir Technologies Inc.
Q3 2024 Highlights
• U.S. revenue grew 44% year-over-year and 14% quarter-over-quarter to $499 million
• U.S. commercial revenue grew 54% year-over-year and 13% quarter-over-quarter to $179 million
• U.S. government revenue grew 40% year-over-year and 15% quarter-over-quarter to $320 million
• Revenue grew 30% year-over-year and 7% quarter-over-quarter to $726 million
• Closed 104 deals over $1 million
• Customer count grew 39% year-over-year and 6% quarter-over-quarter
• GAAP net income of $144 million, representing a 20% margin
• GAAP income from operations of $113 million, representing a 16% margin
• Adjusted income from operations of $276 million, representing a 38% margin
• Rule of 40 score of 68%
• GAAP earnings per share (“EPS”) grew 100% year-over-year to $0.06
• Adjusted EPS grew 43% year-over-year to $0.10
• Cash, cash equivalents, and short-term U.S. Treasury securities of $4.6 billion
• Cash from operations of $420 million, representing a 58% margin and $995 million on a trailing twelve month basis
• Adjusted free cash flow of $435 million, representing a 60% margin and over $1 billion on a trailing twelve month basis.
Is the stock growth fundamentally deserved? Definitely, "Yes".
Palantir stock Alpha
What is Alpha?
Alpha (a) is a term used in investing to describe an investment's ability to beat (outperform) the market, or its “edge.” Alpha is thus also often referred to as excess return or the abnormal rate of return in relation to a benchmark, or any other asset (even against simple sitting in a cash) when adjusted for risk.
The main graph represents a comparison across Bitcoin and Palantir stocks. Since Palantir outperforms BTC twice over the past 12 months (watch lower "percent bar chart" subgraph), so why isn't to continue the play, by staying in a long with Palantir, and kill "the new oranges" respectively.
Top Trading Ideas of 2025: AI, Bitcoin, Stock Picks and PoliticsIf you’re extremely online and watching the blog of every investment bank, financial institution and markets-focused media outlet, you’ve probably seen a few of those already — year-ahead previews are just too enticing to pass on.
With this Idea, we’re aiming to lay out what our traders care about the most — the big trading and investment trends that will drive a huge chunk of the buying and selling. While only a forecast, this type of outlook could help you to better prepare your trades and set your gaze upon the assets and categories that will slosh around billions upon billions next year.
So let’s do it.
🤖 AI on the Horizon
A thematic priority and one of the top investment trends in 2025 will undoubtedly be Nvidia artificial intelligence. AI is touted as the game changer of the tech industry and all big tech players are racing to seize as big a market share as they can.
To get a feel for what may be coming, let’s look at what happened this year. According to technology-focused analyst firm Omdia, Microsoft MSFT was the biggest buyer of Nvidia’s NVDA flagship AI chip Hopper. (One of these babies will run you about $30,000.) Estimates point that the tech giant bought 485,000 Hopper chips (~ $15 billion ). It’s understandable because Microsoft is OpenAI’s biggest investor with about $13 billion jammed into the ChatGPT parent.
Next in line for the Hopper chip in 2024 is Meta META with 224,000 units. Other big spenders for the AI-enabling tech include Tesla TSLA , Amazon AMZN and Google GOOGL .
Next year, that upside trend is expected to pick up the pace with Hopper’s successor Blackwell — a next-generation AI chip , which has seen insane demand , according to Nvidia’s main man Jensen Huang.
With all that AI buzz, investors will be closely following Nvidia’s every step for signs of whether the chip juggernaut could carry on the miraculous growth.
₿ Bitcoin is the New Orange
What’s the new year without some orange-colored cryptocurrency? Bitcoin BTCUSD is now a $2 trillion beast ready to tear down every permabear’s gloom-and-doom forecast. So what can you expect to see in 2025?
With Donald Trump’s inauguration on January 20, the cryptocurrency industry is poised for deregulation (think, crypto companies finally getting bank accounts). The President-elect has set out to assemble a team of A-list venture capitalists , entrepreneurs and, frankly, billionaires.
And with the Congress largely made up of crypto bros, digital-asset companies hope regulators will wave away a whole string of suits against them — Coinbase, Kraken and Binance have been carrying a target on their backs for years.
Stripping down weighty rules will help companies expand services and establish bigger footprints, potentially powering Bitcoin’s valuation.
Other than having banks take deposits or lend to crypto companies, something else can propel Bitcoin. The US government may soon have its very own Bitcoin strategic reserve . The vehicle will aim to collect a total of 1 million Bitcoin over a five-year time horizon. The goal: keep stacking and never sell.
🎯 The Game of Whack-a-Mole
Here’s why stocks won’t be skyrocketing in 2025: the Federal Reserve just said it’s nearly done with lowering interest rates. After Fed boss Jay Powell announced another trim to borrowing costs Wednesday, he struck a cautious note saying that the US central bank is now projecting two rate cuts, down from a previous forecast of four.
In other words, stock picking is back on the menu. It’s easy to feel smart — even a genius — when your trade is in profit together with the broader market. But true craftsmanship is best seen amid churning waters when markets are volatile, tough and choppy.
No doubt there will be winners even if equities are moving sideways or looking down. But it’s hard to imagine that US stocks could pull off a third straight 20%+ annual gain (the S&P 500 SPX was up more than 24% in 2023 and is up 24% on the year so far).
Also, the broad-based index is at a record high . So is the 30-stock Dow Jones Industrial Average DJI and the tech-heavy Nasdaq Composite IXIC . Among the big factors that could contribute to a negative year for stocks are rate hikes, recession or stubborn inflation.
All in all, stock pickers, this might just be your year!
🏛️ Power Plays and Market Sways
President-elect Donald Trump’s agenda is pretty clear by now and he isn’t even officially sworn in. If it could be summed up in a sentence it would probably be “America, heck yeah.”
Trump’s second four-year term is expected to usher in a new era of growth through an America-first approach, sweeping deregulation and tax cuts. All that mix of reflation policies threatens to flare up price pressures again. Add to that some hefty tariffs on US imports and you get a powerful concoction of “wait and see if this bursts in your face.”
Inflation expectations have already crept up and the recent consumer price index readout for November does sound some alarm bells. If things are heating up, Trump’s moves may bring them to a boil — tariffs are inflationary and immigration control is inflationary.
And so if the election win introduced animal spirits into the markets, the presidency starting next year will get a chance to make good on all the promises given by the President-elect (and expose some potential weaknesses).
📣 With that, we conclude the walk through what we think makes the most sense to grab headlines next year. What’s your take — do you think there are opportunities to be seized in 2025? Share your thoughts and let’s spin up a discussion!
Market Year Wrap 2024: Key Highlights and Outlook for 2025Market Year Wrap 2024: Key Highlights and Outlook for 2025
The year 2024 has been a transformative period in the global financial markets, characterised by a mix of challenges and opportunities. Inflation battles, monetary policy shifts, economic uncertainties, and surprising bouts of optimism dominated the landscape. These forces created a volatile yet dynamic environment where some markets flourished while others struggled under significant pressure.
From central bank interventions to geopolitical developments and technological advancements, every corner of the financial world experienced notable activity. In this article, we will take a detailed look at the major trends and events shaping the global economy in 2024 and provide insights into what lies ahead in 2025.
Inflation and Interest Rates: A Balancing Act
In 2024, inflation showed signs of moderation globally. In the United States, it stabilised around 2.7%, marking a notable shift that bolstered market confidence and set a cautiously optimistic tone for the broader economy.
Throughout the year, rate cuts dominated monetary policy discussions. Following the unprecedented rate hikes implemented in response to the COVID-19 pandemic, major central banks began scaling back rates. However, they had to walk a tightrope between a complex landscape of lower but still stubborn inflation and resilient labour markets and the necessity for monetary easing. The magnitude and pace of these cuts varied significantly, reflecting differences in economic conditions across regions and creating complex relationships in the forex market.
Analysts widely anticipate that policymakers will adopt a more measured approach to easing monetary policy as 2025 unfolds. Most developed market central banks, excluding Japan, are expected to reduce interest rates to neutral levels by the year's end. However, if economic conditions deteriorate more than anticipated, there is potential for central banks to push rates below neutral to support growth.
The Fed, in particular, faces a delicate balancing act, as it must carefully navigate potential policy developments—such as trade tariffs—that may not ultimately materialise. At the same time, any resurgence in inflationary pressures could prompt a shift toward a more restrictive rate trajectory in 2025 and beyond, further complicating the policy landscape.
Forex Market: A Year of Divergence
Currency markets in 2024 were shaped by a combination of monetary policy shifts, economic recovery efforts, and political developments. The US dollar experienced a rollercoaster year, initially depreciating against major currencies as markets anticipated the Federal Reserve’s first rate cut since the COVID-19 pandemic. However, it rebounded toward the end of the year, influenced by post-election optimism and expectations of protectionist trade policies under the Trump administration.
The British pound demonstrated resilience throughout 2024, supported by the Bank of England’s patient and measured approach to monetary policy. Despite potential rate cuts, the pound maintained its strength, reflecting confidence in the UK’s economic fundamentals. In contrast, the euro faced significant headwinds. The ECB’s aggressive easing measures widened interest rate differentials with the pound and the dollar, weakening the euro. By the end of the year, trade uncertainty stemming from potential US tariffs weighed heavily on the euro, given the Eurozone’s dependence on global trade.
The Japanese yen experienced mixed fortunes, bolstered by the Bank of Japan’s decision to raise its benchmark interest rate to 0.25%, the highest level since 2008. This move provided much-needed support for the yen, although concerns about potential US trade policies created downside risks. Meanwhile, commodity-linked currencies such as the Australian and Canadian dollars saw fluctuations driven by interest rate differentials, global trade dynamics and their respective economies' ties to the United States and China.
Analysts caution that President Trump’s tariff policies could intensify the overvaluation of the US dollar in 2025, potentially heightening the risk of global financial instability. The prospect of trade restrictions may add complexity to an already volatile economic landscape.
Commodity Markets: Precious Metals Shine, Oil Struggles
Commodity markets have seen a resurgence in investor interest. According to data from WisdomTree and Bloomberg, the proportion of investors allocating resources to commodities rose to 79% in 2024, compared to 71% in 2023—an expected rebound after a challenging year for commodities in 2023.
Precious metals, particularly gold and silver, emerged as top performers. As of time of the writing on 11th December, gold prices surged by over 30%, while silver outpaced gold with a 35% gain. Several factors drove these impressive performances, including geopolitical tensions, economic uncertainties surrounding the US presidential election, and strong demand from emerging market central banks. According to analysts, these factors should continue supporting precious metals in 2025.
Natural gas prices also experienced significant growth, rising 30% to 50% across major markets in Asia, Europe, and North America. Colder weather forecasts have fueled demand, particularly in Europe and Asia. Analysts suggest that this bullish sentiment in gas markets is likely to persist through the winter, with prices unlikely to see significant declines until well into 2025. However, high gas prices are expected to increase power costs globally, straining fragile economic growth in key regions such as China and Europe while rekindling inflationary concerns.
Oil, however, faced a challenging year despite geopolitical crises and production cuts. One of the reasons is a weak demand, particularly from China. In the United States, gasoline inventories exceeded long-term seasonal levels. According to analysts, the growing transition to electric vehicles in developed markets represents a long-term challenge for oil demand. Although some analysts anticipate a recovery in 2025 as OPEC+ production cuts take effect and geopolitical risks persist.
Stock Markets: Tech Leads the Charge
The US stock market delivered robust performances in 2024, reaching new record highs, with the technology sector at the forefront. Innovations in artificial intelligence (AI) played a pivotal role in driving growth, with major companies such as Microsoft, Nvidia, and Amazon reporting strong earnings. This momentum boosted broader indices, with the S&P 500 and Nasdaq 100 recording gains of 28.57% and 27.4%, respectively, as of 10th December.
The broader market also benefited from declining inflation, interest rate cuts, and better-than-expected corporate earnings. These factors may contribute to the stock market growth in 2025. However, stretched valuations temper some of the optimism, and concerns about potential trade tariffs add a layer of uncertainty.
Looking Ahead to 2025: Key Market Drivers
As we look ahead to 2025, several critical factors are poised to influence the direction of financial markets.
Central Bank Policies
Central banks will remain pivotal in shaping financial markets in 2025. The balance between maintaining growth and addressing inflationary pressures will be a key theme for central banks throughout the year, influencing the strength of equity markets. Interest rate differentials will play a significant role in determining currency movements.
Global Economic Recovery
The global economy is expected to continue rebounding from pandemic effects. GDP growth, employment trends, and trade balances will be key factors influencing financial markets.
Trade War Uncertainty
Potential trade tariffs pose a significant risk. The scope, products, and geographies targeted will determine the impact on global GDP, inflation, and interest rates. Any escalation in trade tensions could disrupt markets and strain economic recovery.
Artificial Intelligence and Innovation
AI and emerging technologies may drive productivity gains, offering an upside to global growth. By boosting efficiency and reducing costs, AI could also exert disinflationary pressure, influencing economic dynamics in the long term.
Geopolitical Tensions
Geopolitical risks, including trade disputes and political conflicts, remain unpredictable but could disrupt markets.
Final Thoughts: Embracing Opportunities Amid Volatility
The year 2024 brought its share of challenges and opportunities, showcasing the resilience and adaptability of global markets. From navigating geopolitical uncertainties and evolving monetary policies to embracing the transformative potential of technologies like artificial intelligence, market participants faced a dynamic landscape.
Looking ahead to 2025, the horizon offers new opportunities. Continued advancements in innovation, shifts in economic policies, and the resolution of key global tensions could set the stage for exciting market fluctuations. Use the new year to test your skills and look for new opportunities!
This article represents the opinion of the Companies operating under the FXOpen brand only. It is not to be construed as an offer, solicitation, or recommendation with respect to products and services provided by the Companies operating under the FXOpen brand, nor is it to be considered financial advice.
TAO - Don't Underestimate it!Hello TradingView Family / Fellow Traders. This is Richard, also known as theSignalyst.
📈TAO has been bullish , trading within the wedge pattern in blue.
Currently, TAO is in a correction phase approaching the lower bound of the wedge.
Moreover, the $500 is a strong round number!
🏹 Thus, the highlighted blue circle is a strong area to look for buy setups as it is the intersection of support and lower trendline acting as non-horizontal support.
📚 As per my trading style:
As #TAO is around the blue circle, I will be looking for bullish reversal setups (like a double bottom pattern, trendline break , and so on...)
📚 Always follow your trading plan regarding entry, risk management, and trade management.
Good luck!
All Strategies Are Good; If Managed Properly!
~Rich
BTC dominance 2024-2025(prodolzhenie prognoza po dominacii bitkoina 2023-2024)
Proshlyj prognoz otrabotal prakticheski ideal'no, nemnogo promazal po vremeni (uskorilsya), nemnogo oshibsya s metodikoj raschyota dominacii (uchyol al'tkoiny - podrobno v obnovleniyah na proshlom prognoze po dominacii). Odnako v celom prognoz pravil'nyj!
Nakaplivat' bitkoin bylo bolee pravil'nym resheniem nezheli otkupat' al'tkoiny.
Podavlyayushchee bol'shinstvo al'tkoinov obnovilo svoi minimumy k bitkoinu.
Teper' prishla pora razvorota. Tyazhelo sprognozirovat' tochku razvorota (kak eto bylo s proshlym prognozom) kak po vremeni tak i po urovnyu, odnako ya sklonyayus' k variantu chto eto proizojdyot ot 55-65% vo vremennom promezhutke konca2024 achala2025 goda. I ustremitsya v blok 35-45% k koncu 2025 goda.
!!! Etot prognoz bolee kak prodolzhenie v popytke najti mesto razvorota, a ne kak samostoyatel'nyj predydushchij prognoz. Ya by ne stavil mnogoe na nego, odnako tendenciya dolzhna byt' yasna - gryadyot al'tsezon.
BTC\USD - 2025 ATHV prodolzhenie prognoza po obnovleniyu ATH v 2024 godu
Kak vidno, vopreki vsem hejteram bitkoina shortivshim ego osen'yu 2023, a takzhe rasskazyvayushchih skazki o tom, chto posle 48000 ego obnulyat, eto ego poslednij cikl - bitkoin udivil dazhe menya)))
Delo v tom, chto on obognal moj prognoz na polgoda, chto dlya menya bylo absolyutnoj neozhidannost'yu)
Celi dostignuty i my mozhem prodolzhat' dal'she)
Kasaemo ATH2025
Ot ATH2021 Primerno 1430 dnej dlya pikovogo znacheniya v 2025 godu
Tri diapazona ceny:
1 - (oranzhevyj, negativnyj) - 90-120k
2 - (zheltyj, nejtral'nyj) - 120-140k
3 - (zelenyj, pozitivnyj) - 140-150k
Dopuskayu chto bitkoin vnov' mozhet vsekh nas udivit' (a eto on umeet = burnyj rost osen'yu 2023 vopreki ozhidaniyam + rost k ATH vesnoj 2024 ran`she prognoza) i pokazat' znachenie vyshe 150-200k. Odnako veroyatnost' takogo sobytiya ya ocenivayu takzhe, kak i prognoz nizhe 90k (v dannom sluchae ya oshibus' i moj prognoz vovse ne srabotaet).
Sam zhe ya sklonyayus' k diapazonu 120-140k.
Takzhe dopuskayu veroyatnost' otkloneniya po vremeni +\- 1 mesyac
Bitcoin Log Trend Curve - Feb 2025 peakJust wanted to draw a curve matchin the logarithmic trend of BTC price.
By this estimate we see a peak in Feb 2025 of about 95,000. But the price would only go down or sideways from here. I drew these lines in October of 23, but never published it - and so far it's following the trend. Just a fun thing I wanted to try, idk if it means anything.
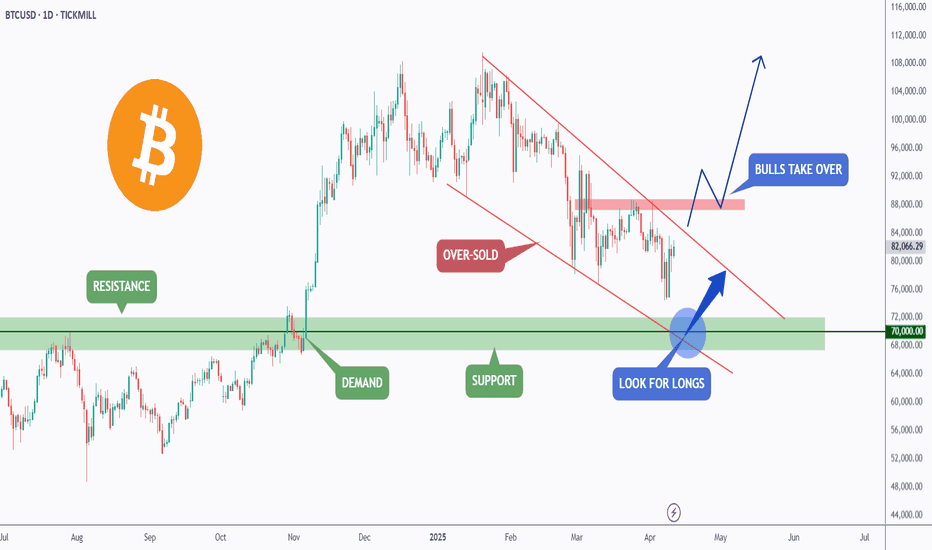
BTC - Bullish Phase Confirmed!Hello TradingView Family / Fellow Traders. This is Richard.
🗒 Do you remember this post from 2023?
and this post from last month?
📌 It is confirmed. Pattern 1 Activated after breaking above the red channel and 70k.
❗️N.B. Always remember, nothing moves in a straight line, so we might see a correction (in the form of a higher low) along the way.
Always follow your trading plan regarding entry, risk management, and trade management.
Good luck!
🗒 All strategies are good, if managed properly!
~Rich
$BTCUSD Bitcoin will continue to growBitcoin has been in correction for 160 days. Now, there is a redistribution of hands, and among those who bought for the past 160 days, the average purchase price is 64k.
According to the structure, we see liquidity withdrawal from the bottom in each correction—marked with red crosses—which means that they liquidate long positions and then continue to move up.
We still have a year until the end of the bull cycle, and I think you will be pleasantly surprised when you see what prices will be in the next three months. Summer is over, and the most interesting time in the market is starting.
I am now more focused on the altcoin market and the cryptocurrency market. As they have more potential to rise/fall:)
Right now, the fear and greed index is down
I'm looking positively into this fall and the next three months. If there will be a fall, it will not last long and will be bought back quickly.
Best regards EXCAVO